analog tachograph disc, image processing, polar coordinates conversion
Artur RYGUŁA*, Andrzej W. MITAS
Silesian University of Technology, Faculty of Transport Department of Transport Informatics Systems
Krasińskiego St. 8, 40-019 Katowice, Poland Andrzej DUŚ
DRABPOL accident analysis laboratory Akacjowa St. 24/26, 42-233 Mykanów, Poland *Corresponding author. E-mail: [email protected]
ANALOG TACHOGRAM ANALYSIS IN THE EUCLIDEAN COORDINATES
Summary. The article presents methods for processing image of circular tachograph disc (used to register vehicle’s and driver’s work) to the rectangular coordinates. Selected techniques were described in detail and also the images obtained as a result of their use were compared. In addition, the practical examples of the processed tachogram images analysis were indicated.
ANALIZA TACHORAMU ANALOGOWEGO W UKŁADZIE
WSPÓ
Ł
RZ DNYCH PROSTOK TNYCH
Streszczenie. W artykule przedstawiono metody przetwarzania koncentrycznego obrazu wykresówki (tarczy tachografu) służ cej do rejestracji pracy pojazdu i kierowcy do układu współrz dnych prostok tnych. Szczegółowo opisano wybrane techniki oraz porównano obrazy uzyskane w wyniku ich zastosowania. Dodatkowo wskazano praktyczne przykłady analizy przetworzonego obrazu rejestracji z wykresówki, zarejestrowanego przez urz dzenie analogowe.
1. INTRODUCTION
detailed analysis of the losing or overwriting data problem, resulting from the transformation of circular into rectangular coordinates.
2. METHODS OF CONVERTING CIRCULAR DISC TO RECTANGULAR FORM
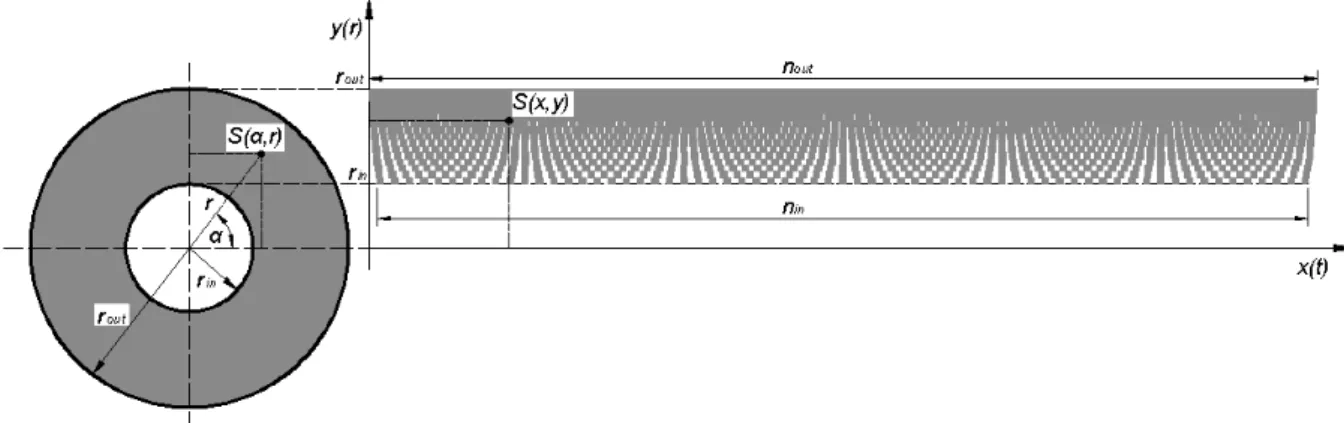
Transforming the circular image of tachograph disc into a rectangular form consist in replacing polar coordinates of each point on the circular graph by Cartesian coordinates and representing their position on a horizontal time axis.
Fig. 1. Schematic diagram: circular disc and disc converted to rectangular form
Rys. 1. Schemat ideowy: tarcza okr gła i tarcza po przekształceniu od układu wsp. prostok tnych
Each point of the circular image is described by the angle of rotation α (specify the position of a point on the circular time axis) and the radius r (specify the value of a register parameter such as the speed at the given time period). In the rectangular form the same point is defined as a set of coordinates x (location on the horizontal time axis) and y (value of parameter). The number of points of converted circle with inner
r
inand outerr
out radius on the inner and outer circle perimeter (similar to the upper and lower limit of the rectangular plot) accounts for:in
in
r
n
2
(1)out
out
r
n
2
For example on the disc scanned with resolution 1200 dpi (disc with speed range of 125 km/h) registered parameters of speed graph amount to:
2839
inr
(2)1920
outr
Hence the difference between the number of points on the outer and inner perimeter is:
5774
in outn
n
(3)As it can be seen, in reality it is not possible to replace the circular image by exactly rectangular form, only its representation with the possibility of overwriting, losing or so-called interlacing data could be done. In the following paragraphs described in detail the methods of processing the circular disc image to the rectangular coordinates
2.1. Minimum resolution method
by following objects. The greater the distance from the inner radius is, the greater amount of data is lost.
Fig. 2. Schematic diagram of minimum resolution method Rys. 2. Schemat ideowy metody rozdzielczości minimalnej
The point of the circular plot described by polar coordinates
S
(
,
r
)
in the form of Cartesian coordinates has the following parameters:in r in r r n x in
in
2 (4) inr
r
y
where:
n
in
2
r
in, the number of points on the inner circle,
(
0
;
1
;
2
;
3
...
2
)
in in in rr
r
r
in
,
rotating angle setting out the position on the circular time axis,
r
[
r
in,
r
out]
, radius specifying the distance from the centre of the disc.This method allows to obtain a rectangular picture with dimensions
n
in
(
r
out
r
in)
. As a result of transition,
(
r
out
r
in)
2 points of circular chart are lost.2.2. Maximum resolution method
The method of the maximum resolution bases on transforming the circular image into rectangular form with additional filling of missing points. Only the points through which the outer radius goes along are processed. The image is stretched at the bottom of the chart, and the missing sections are reproduced from neighbouring areas.
Fig. 3. Schematic diagram of maximal resolution method Rys. 3. Schemat ideowy metody rozdzielczości maksymalnej
The point of the circular plot described by polar coordinates
S
(
,
r
)
in the form of Cartesian coordinates has the following parameters:out r out r r n x out
out
2 (5) inr
r
y
where:
n
out
2
r
out, the number of points on the outer circle,
)
2
...
3
;
2
;
1
;
0
(
out out out rr
r
r
out
, rotating angle setting out the position on the circular time axis,]
,
[
r
inr
outAs a result of maximum resolution method application picture with dimension
n
out
(
r
out
r
in)
is acquired, that is an area larger forr
out/
r
inthan the area obtained by using the minimum resolution method. In the rectangular coordinates
(
r
out
r
in)
2 additional points are written.2.3. Real resolution method
Method of real resolution transforms the circular image into rectangular form without distortions and simplifications. As a result of the transition, in the rectangular form occurs so-called interlace (empty, not filled areas between points of the graph). The smaller the value of the circular radius is, the larger interlace in rectangular coordinates occurs.
Fig. 4. Schematic diagram of real resolution method Rys. 4. Schemat ideowy metody rozdzielczości rzeczywistej
The coordinates of the point
S
(
,
r
)
after conversion into the Cartesian coordinates amount to:out r out r
r
r
r
r
n
x
2
(6)in
r
r
y
where:
nr 2
r, the number of points on the circle in the radius r,
)
2
...
3
;
2
;
1
;
0
(
r
r
r
r
,rotating angle setting out the position on the circular time axis
]
,
[
r
inr
outr
, radius specifying the distance from the centre of the disc.Application of the real resolution method allows to create the trapezoidal shape picture with the grounds
n
out,
n
in. The area contains a
(rout2 rin2)points of the circle image.3. COMPARISON
Fig. 5. Deformations in the disc transforming process
Rys. 5. Zniekształcenia powstałe podczas przetwarzania tarczy
Extreme points of the image are displaced by the amplitude:
2 2
p p y
x
A (7)
where:
A, displacement amplitude,
xp,yp, coordinates of disc centre transfer vector.For example, if the centre of the disc transfer vector amount to w [2,4], obtained rectangular image is distorted by 8 chart points.
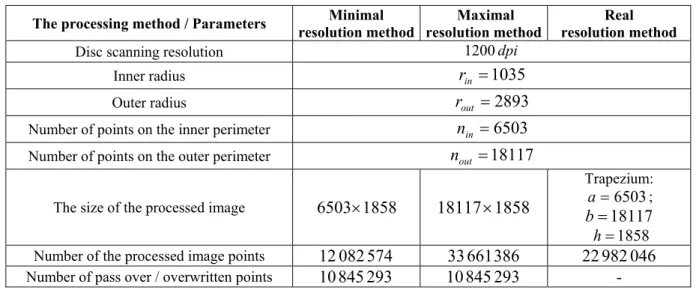
The identification of proper transforming method requires comparison of the parameters and results derived from various techniques application. Table 1 shows the basic parameters of the proposed methods.
Table 1 Comparative table of methods of transformation of images
The processing method / Parameters Minimal resolution method
Maximal resolution method
Real resolution method
Disc scanning resolution 1200dpi
Inner radius rin 1035
Outer radius rout 2893
Number of points on the inner perimeter nin 6503
Number of points on the outer perimeter nout 18117
The size of the processed image 65031858 181171858
Trapezium: 6503
a ;
18117
b
1858 h
Number of the processed image points 12082574 33661386 22982046 Number of pass over / overwritten points 10845293 10845293 -
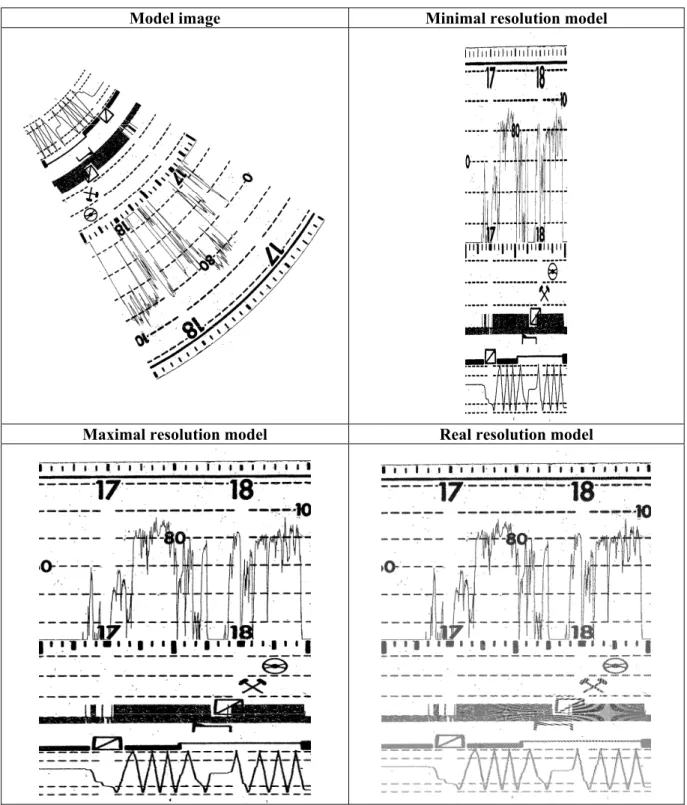
Table 2 Comparative table of images transformation results
Model image Minimal resolution model
Maximal resolution model Real resolution model
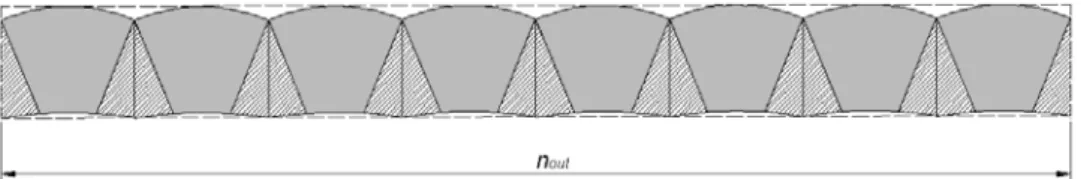
The most clear output picture is a result of maximum resolution transformation, as mention earlier this method however cause distortions, which in particular in the event of accident reconstruction can significantly affect on the reliability of the results.
Fig. 6. Example of distortions on the transformed disc
Rys. 6. Przykład zniekształceń na przetworzonym obrazie tarczy
The level of distortion depends on the disc scanning resolution. The higher the resolution is, the less visible distortions are. Distortions occur periodically, the number of periods are equal to 2
. Distortions can be minimize by multiplying the width of the image and thereby increasing the number of possible pixels intermediate positions on the time axis.4. EXAMPLES OF APPLICATION TACHOGRAPH DISC TRANSFORM INTO RECTANGULAR COORDINATES FORM
As mentioned earlier transforming the circular image to the rectangular coordinates could have practical application in everyday work of laboratory assistants and judicial experts. Below shown examples of the use of the rectangular image in the discs analysis process:
Marking the reference points (graphically indicating on the driving characteristic typical places of vehicle stopping, bus stops, the speed line reference, etc. Apply in order to increase the readability of road situation right before the hazardous event or to verify driver’s work validity). Connecting driving charts over 24h (using in the case of analysing discs with continuous
registration of the driving parameters for more than the permitted period of 24 hours. Charts duplication and connection allows to designate the driver’s working time line in the overlapping areas of registration).
Connecting driving charts (used in the case of two vehicle’s drivers. Combination of each driver's charts - recorded on a separate disc plot - greatly facilitates analysis and verification of the complete route records. Combining charts can also be used in the case of exchanging discs by one and the same driver from one-men crew e.g. to illustrate the complete driving characteristics registered on separated disc - time registrations could be even less than the day).
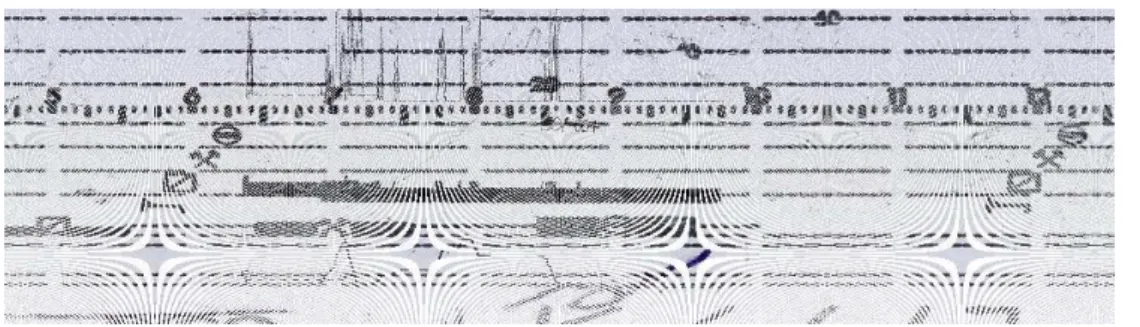
Fig. 7. Example of recording data over 24h Rys. 7. Przykład zapisu powyżej 24 godzin
5. CONCLUSIONS
The proposed methods of transforming analog tachograph discs into the Euclidean coordinates allows to obtain rectangular form of circular image in a quick and reliable way. Featured transformation techniques are applied depending on the needs and requirements of the current analysis. Presented methods could be used to analysis of vehicle operation as well as in analysis of driver’s working time period. In particular, it allows to verify the driver’s declaration of his daily work and compare accomplished task with commissioned ones, especially on account of travelled distance. Additionally places of vehicle stops could be specify. In case of accident reconstruction the reference lines which indicate values of local speed limits can be mark to estimate whether the driver did not exceed permitted speed. What is important, using transformed images to establish the value of acceleration forces to make use of methods which gives acceptable results for this kind of operations. For this reason, it is worth to use the real resolution method in order to maintain the required accuracy. Images obtained by using minimal resolution method have the smallest size, therefore they can be used for archiving data. In contrast, use of the method of maximum resolution allows to obtain the largest and what is more important the most readable images. The second parameter is required for visual assessment and verification of driving records. It should also be noted that according to the research conclusions [4] required resolution scanning for the reconstruction of road accidents should be at least 7200 dpi, however presented algorithms due to the computing complexity were limited to the model value of 1200 dpi.
References
1. Mitas A., Ryguła A.: The Computing Unit for Tachometer Data Analysis by Means of Driving Characteristics, Proceedings of the 7th International Conference on Transportation and Logistics Integrated Systems, Kraków, 2007, pp. 260-267.
2. Ryguła A., Mitas A.: Technologia informatyczna w zastosowaniu do analizy zachowania kierowcy. In: Technologie informacyjne w edukacji policjantów, Mitas A. (Ed.), Wydawnictwo Centrum Szkolenia Policji, Legionowo, 2008, pp.187-198.
3. Ryguła A., Mitas A.: Numeric Tolls for Tachogram Analysis. Transport Problems, vol. 2, no. 4, 2007, pp.73-81.
4. Duś A., Unarski J., Wach W.: Granice interpretacji zapisów kart tachografów w przypadku analizy intensywnego hamowania. In: Problemy rekonstrukcji wypadków drogowych, Zbiór referatów. Wydawnictwo Instytutu Ekspertyz S dowych, Kraków, 2002, pp. 281-294.
5. Drabpol. Strona główna. http://www.drabpol.pl/.