ANSYS CFD
Hitesh N. Panchal
1, P. K. Shah
21 KSV University, Gujarat Power Engineering and Research Institute, Mehsana, India. 2 Silver Oak College of Engineering and Technology, Ahmedabad, Gujarat, India.
Abstract
In every efficient solar still design, water temperature, vapor temperature and distillate output, and difference between water temperature and inner glass cover temperatures are very important. Here, two dimensional three phase model of hemispherical solar still is made for evaporation as well as condensation process in ANSYS CFD. Simulation results like water temperature, vapor temperature, distillate output compared with actual experimental results of climate conditions of Mehsana (latitude of 23° 59’ and longitude of 72° 38) of hemispherical solar still. Water temperature and distillate output were good agreement with actual experimental results. Study shows that ANSYS-CFD is very powerful as well as efficient tool for design, comparison purpose of hemispherical solar still.
Copyright © 2013 International Energy and Environment Foundation - All rights reserved.
Keywords: Hemispherical solar still; CFD; Water temperature; Vapor temperature; Distillate output; Evaporation; Condensation.
1. Introduction
The potable water is one of the basic needs for survival of human being. Due to fast increase in population in the world in general and India in particular, the potable water consumption has been increased tremendously. On the other hand available water in rivers, lakes and underground water has been polluted due to industrialization for up gradation of living standards for human being. Hence there is a need to develop self sustained system to purify available water into potable water for keeping healthy human being.
Solar still is particularly important fir locations where solar intensity is high and there is a scarcity of fresh water classified into direct or passive solar still and indirect or active solar still. The direct solar distillation system collects solar energy to produce potable water. Active solar still is particularly costly compared with passive solar still. [1, 2]. A number of experiments have made to develop and improve performance of solar still. The efficiency of solar still is directly proportional to inlet water temperature inside the solar still. To increase distillate output of solar still, some researcher [3-5] suggested coupling a flat plate collector because normal efficiency of solar still is about 30 to 40%. They got good improvement of 40 to 50% in distillate output compared with alone solar still. Solar still distillate output is also depends on latent heat of condensation, which is lost to atmosphere during the condensation process, hence some researcher [6, 7] used latent heat of condensation to increase temperature of feed water or saline water inside the solar still to improve performance. They found 10 to 20 % improvement in solar still. Solar still distillate output also depends on superheated steam produced at lower temperature. Hence, some researchers [8] used vacuum pump or vacuum system incorporated with solar still. They found also improvement in distillate water output from solar still
In this research paper, actual as well as CFD analysis of hemispherical solar still is compared under steady state conditions under climate conditions of Mehsana, Gujarat.
2. Material and methods 2.1 Test site for experiment
New hemispherical solar still was tested under climate conditions of Mehsana (latitude of 23° 59’ and longitude of 72° 38), Gujarat in a typical summer month, May 2012. Mehsana city is located at center of Gujarat. Tropics of cancer is also passing through this city hence this site is best for meteorological environment of Solar energy. It has two distinct season like hot season and cold season. Hot season is best chosen for experiment due to good solar insolation. Relative humidity exhibits a large diurnal cycle on order of 55% round the year. The monthly average wind speed for Mehsana (latitude of 23° 59’ and longitude of 72° 38) 2.5 m/s.
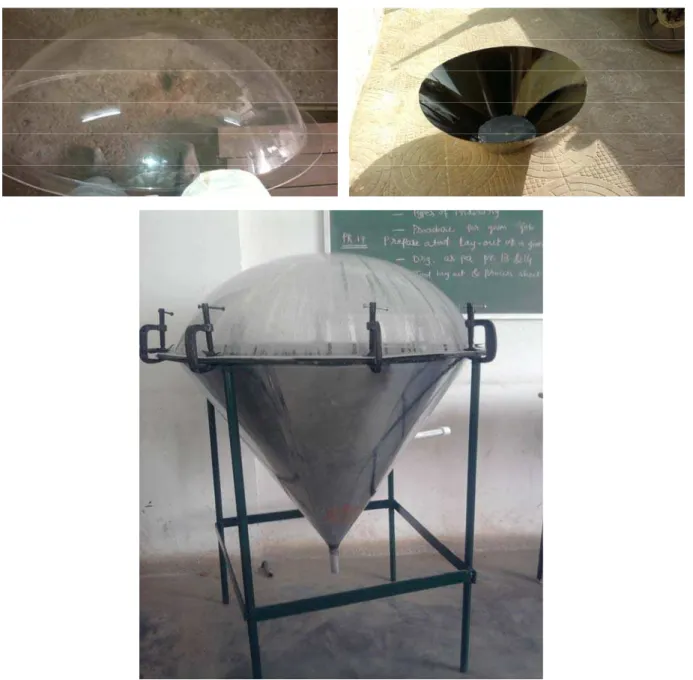
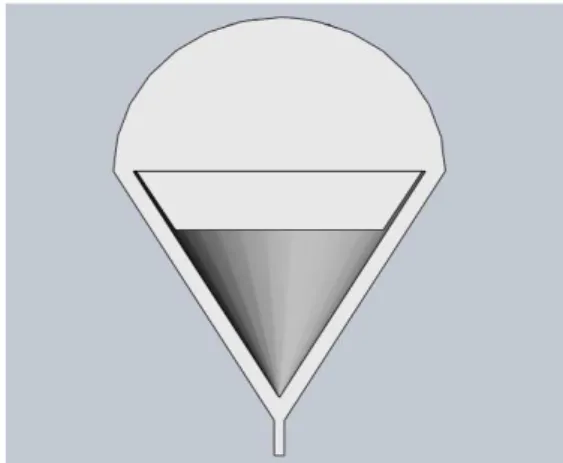
2.2 Design of the hemispherical solar still
A schematic diagram of hemispherical solar still is as shown in Figure 1 and photographs of components as well as complete fabrication of hemispherical solar still is shown in Figure 2. The hemispherical solar still is consists of circular basin and black colored absorber plate which carrying saline water, acrylic hemispherical cover, conical shaped water Distiller called hopper and container, which carries all of above components. Here, basin as well as black colored absorber plate made of mild steel. Mild steel plate has effective area of 0.55 meter square and a thickness of 5 mm. A hole of 30 mm is drilled centrally to carry out saline water from the MS tray. Acrylic hemispherical head is attached at top of the still which has absorptivity as well as transmissivity of 0.85 and 0.7 respectively. To decrease heat transfer losses, 5 mm thick rubber gasket is provided. Here for further sealing as well as pressure between hemispherical cover as well as basin, 4 C clamps have fitted at equal distances. Three K type thermocouples have used to know temperatures like inner glass cover, water temperature as well as ambient temperature. To know insolation of solar still, pyranometer is attached, which has 0.1 meter square lest count.
2.3 Experimental procedure
Experiments have performed at Geetanjali Society, Mehsana (latitude of 23° 59’ and longitude of 72° 38) on May, 2012. Before starting experiments all electronic instruments like pyranometer, thermocouples, Anemometer have calibrated properly otherwise there will be chances of errors in experiments. Experiments started around 9:00 am morning to 5:00 pm evening. Different temperatures, wind speed, solar insolation measured at every one hour of interval. Table 1 shows various measured temperatures and yield for hemispherical solar still. Here, 20 cm water depth has taken for measurements.
3. Simulation in ANSYS CFD software 3.1 Flow geometry
Figure 1. Schematic diagram of hemispherical solar still
Table 1. Measured temperature, yield, distillate output yield of hemispherical solar still
Sr. No. Time (Hour) Ta (C) Tw (C) Tg (C) I(t) W/m2 Mw (ml)
1 9:00 20 0 0 0 0
2 10:00 24 430 29 370 0.025
3 11:00 27 45 30 460 0.120
4 12:00 28.5 53 32 520 0.210
5 13:00 31 55 34 650 0.235
6 14:00 30 65 37 720 0.290
7 15:00 28 50 32 510 0.150
8 16:00 27 39 30 310 0.090
Figure 2. Components as well as complete fabrication of hemispherical solar still
3.2 Governing equations
Propose model equations based on continuity, momentum, mass and energy transfer conservation principles at steady state conditions which is explained below:
3.2.1 Continuity equation Gas Phase
0 )
.(rG GVG +SLG =
V
ρ
(1)Liquid Phase
0 )
.(rL LVL −SLG =
V
ρ
(2)Equations (1) and (2) shows continuity equation for liquid as well as Gaseous phase. Here, SLG is a rate
of heat transfer from liquid to gas phase and gas phase to liquid phase. Mass transfer phases must satisfy the local energy balance equation
Figure 3. 3-D model of hemispherical head solar still in solid works 2012 software
Figure 4. Unstructured mesh of hemispherical solar still
3.2.2 Momentum equation Gas Phase
GL G
G T G G arG La G G
G G
G
GV V r VP V r VV VV r g M
r
V.( ))=− + (
µ
min ( + ) ))+ρ
− (3)Liquid Phase
GL L
L T L L arL La L L L L
L
LV V rVP V r VV VV r g M
r
V.( ))=− + (
µ
min ( + ) ))+ρ
+ (4)Equations (3) and (4) represents Momentum equation for Gaseous as well as liquid phase. Here, MGL shows very important interfacial forces which acting on each phase by presence of another phase. CFX 12.0 solution manual [9] gives details of interfacial forces. Drag coefficient due to higher interfacial area was assumed to be 0.45.
3.2.3 Energy equations Gas Phase
) (
. )
.(rG GVGhG V q QLG SLGhLG
Liquid Phase
) (
. )
.(rL LVLhL V q QLG SLGhLG
V
ρ
=− − + (6)Figures 5 and 6 represents Energy equations for liquid as well as Gaseous phase. Here, hL and hG are
specific enthalpies of liquid as well as gaseous phase. Heat transfer between phases must satisfy following balance equation
GL
LG
Q
Q
=
−
(7)3.2.4 Volume conservation equation
It is a constraint, which shows that sum is unity hence,
1
=
+
LG
r
R
(8)3.2.5 Pressure constraint
Here, there is an assumption that, liquid as well as gaseous phase share same pressure field, hence
P
P
P
G=
L=
(9)3.2.6 Mass transfer equations
Mass transfer equations for liquid as well as gaseous phases are written below. Gas Phase
0 )))
( (
.(rG GVGYA − GDAG VYA −SLG =
V
ρ
ρ
(10)Liquid Phase
0 )))
( (
.(rL LVLXA − LDAL VXA −SLG =
V
ρ
ρ
(11)3.3 Initial and boundary conditions
Continuity equation and momentum equation are very important for ANSYS software. Hence, to solve momentum as well as continuity equations, suitable boundary conditions must be specified at all boundaries. Here, total 9 Hours Experimental data have used, hence ANSYS CFD simulation run time of 9 hours is required, which is unsteady state condition and it is not possible because of large number of compute time limitations as well as time steps. Hence, for easy calculations, an assumption has taken that, time period of 1 hours is applied to water as well as glass cover of hemispherical solar still, at that time temperature of water and glass cover remains constant. Hence, overall process is required 9 stages consisting of 1 hour time interval in quasi static condition
Here, in every 1 hour of time interval, an average temperature was set as a boundary conditions of hemispherical solar still. Solar insolation is based on absorption coefficient, emissivity of glass, reflectivity of glass etc. Due to evaporation of water, droplets of water formed and for droplet of water, adhesion as well as cohesion forces also taken accounted to obtain good result. Here, there is also an assumption taken that when solar insolation is applied to hemispherical solar still and after one hour of simulation, whatever water level decrease inside basin that much water is obtained at distillate output. Initial water level inside the basin of hemispherical solar still has taken as 2cm and after end of simulation whatever level is decrease inside basin, same amount of water is entered inside the basin for balancing purpose. Hence, hydrostatic pressure is proportional to water inside the basin of hemispherical solar still.
4. Result and discussion
4.1 Result and discussion of experimental work
output also lower.
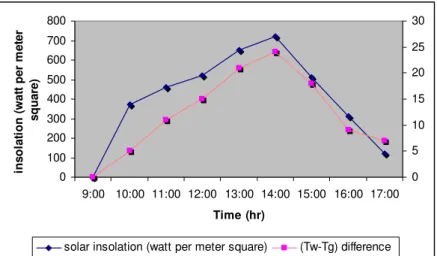
Many researchers have found that higher temperature difference between water temperature and inner glass cover temperature, higher will be distillate output. Hence, Figure 8 shows comparison of hourly variation of solar insolation and temperature difference of water and glass cover temperature. Figure 8 shows that, it will be zero during starting of experiment and then gradually increases from morning to noon 2 pm. Hence, maximum water distillate water available at 2 pm, and due to lower difference in temperature, after 2 pm, distillate output is decreases. Figure 9 shows hourly variation of solar insolation and cumulative distillate output of hemispherical solar still. It shows that, there is a gradually increases in cumulative output from morning 9 am to 5 pm evening.
0 5 10 15 20 25 30 35
9:00 10:00 11:00 12:00 13:00 14:00 15:00 16:00 17:00
Time (Hr) A m b ien t T em p er at u re ( C ) 0 10 20 30 40 50 60 70
Ambient Temperature (C) Water Temperature (C)
Figure 5. Comparison of time Vs ambient and water temperature
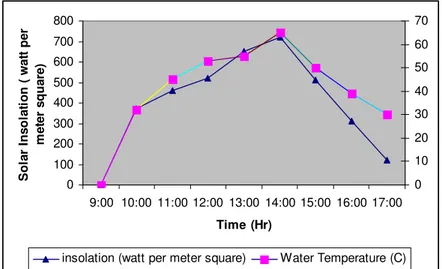
0 100 200 300 400 500 600 700 800
9:00 10:00 11:00 12:00 13:00 14:00 15:00 16:00 17:00
Time (Hr) S o la r I n s o la ti o n ( w a tt p e r m e te r s q u a re ) 0 10 20 30 40 50 60 70
insolation (watt per meter square) Water Temperature (C)
0 100 200 300 400 500 600 700 800
9:00 10:00 11:00 12:00 13:00 14:00 15:00 16:00 17:00
Time (Hr) In so la ti o n (w att p e r m e te r sq u ar ) 0 0.05 0.1 0.15 0.2 0.25 0.3 0.35
Insolation (Watt per meter square) distilate output (Kg)
Figure 7. Comparison of time Vs insolation and distillate output
0 100 200 300 400 500 600 700 800
9:00 10:00 11:00 12:00 13:00 14:00 15:00 16:00 17:00
Time (hr) in s o la ti o n (w a tt p e r m e te r sq u ar e) 0 5 10 15 20 25 30
solar insolation (watt per meter square) (Tw-Tg) difference
Figure 8. Comparison of time Vs Solar Insolation and difference of temperature
0 100 200 300 400 500 600 700 800
9:00 10:00 11:00 12:00 13:00 14:00 15:00 16:00 17:00
Time (Hr) So la r in s o la ti o n (w a tt p e r m e te r sq u a re ) 0 0.2 0.4 0.6 0.8 1 1.2 1.4
solar insolation (watt per meter square) cumulative distillate output (Kg)
Figure 9. Comparison of time Vs solar insolation and cumulative distillate output
4.2 Result and discussion of ANSYS CFD simulation
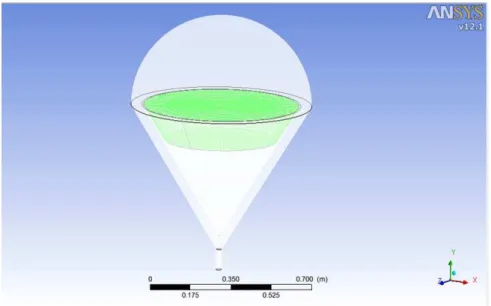
water inside basin of hemispherical solar still and then after evaporation, vapor is formed. After water and vapor domain, next step is application of solar insolation. Figure 11 shows water domain and Figure 12 shows vapor domain. Here motion of water and vapor remains stationary. Figure 13 shows solar insolation to hemispherical cover and water.
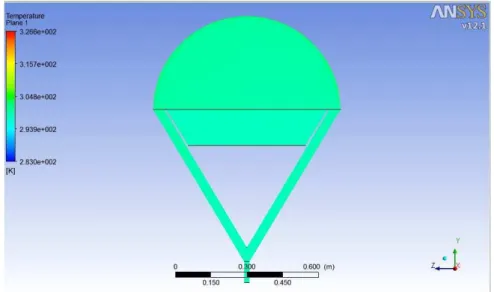
Figure 14 shows results of simulation runs and the experimental data of 9 hours of time period. In this figure it is clearly show that, as process of evaporation and condensation begins at 9:00 am morning, then water particles warm up in the solar still and then warming starts increasing up to 14:00 pm and then due to less thermal energy in form of solar insolation, warming of water is less hence it gets declined after 14:00 pm to 17:00 pm. It also shows 12 % distillate water errors while comparing with actual experimental results. Figures 14 to 21 shows different temperature contours obtained by ANSYS CFD simulation results during morning 9:00 am to 16:00 pm evening. Figure 22 shows comparison of simulation results of distillate output obtained by experimental as well as ANSYS CFD simulation results and Figure 23 shows comparison of ANSYS CFD simulation results of water temperature and actual experimental water temperature which has measured by K Type thermocouples. It shows good agreement and average error of water temperature is 8 % and error of distillate output of simulation as well as experimental was 6%.
5. Conclusion
Present research paper shows following points in conclusion.
• There is a good agreement of water temperature in experimental work as well as ANSYS CFD simulation work.
• There is a good agreement of distillate output in experimental work as well as ANSYS CFD simulation work.
• Predicted results by ANSYS CFD shows that Computational fluid dynamics is a very powerful tool for design parameters, diagnostic as well as simulation purpose of various solar stills as well as solar operated devices.
Figure 11. Water domain applied to hemispherical solar still
Figure 12. Vapor domain applied to hemispherical solar still
Figure 14. Temperature contour at 9:00 am morning
Figure 15. Temperature contour at 10:00 am morning
Figure 17. Temperature contour at 12:00 pm noon
Figure 18. Temperature contour at 13:00 pm noon
Figure 20. Temperature contour at 15:00 pm noon
Figure 21. Temperature contour at 16:00 pm evening
Figure 22. Comparison of distillate output of actual result and ANSYS CFD simulation results
0 0.05 0.1 0.15 0.2 0.25 0.3 0.35
9:00 10:00 11:00 12:00 13:00 14:00 15:00 16:00 17:00
Time (Hr)
Actual experimental distillate output (ml)
ANSYS CFD simulation result distillate output (ml)
Distillate output (m
0 10 20 30 40 50 60 70
9:00 10:00 11:00 12:00 13:00 14:00 15:00 16:00 17:00
Time (Hr) W a ter T e m p er at u re ( C )
actual experimental Water Temperature (C)
ANSYS CFD simulation result water Temperature (C)
Figure 23. Comparison of actual water temperature and ANSYS CFD simulation results
References
[1] Tiwari, G.N., Singh, H.N., and Tripathi R, 2003. Present status of solar distillation. Solar energy, Vil. 75 (5), pp. 367-3736.
[2] Abdenacer, P. K. and S. Nafila, 2007. Impact of temperature difference on solar still global efficiency. Desalination, Vol. 209, pp. 298-305.
[3] Kumar.s., Tiwari. G. N, 1996. Performance evaluation of active solar distillation system, Energy, Vol. 21, pp. 805-808.
[4] Rahim N.H.A. 2003. New method to store heat energy in horizontal solar still. Renewable energy. Vol. 28, pp. 419-433.
[5] Tanaka Hiroshi, 2009. Experimental study of basin type solar still with internal and external reflectors in winter, Desalination. Vol. 249, pp. 130-134.
[6] Velamurugan V., Shrithar, 2007. Solar stills integrated with mini solar still –analytical simulation and experimental validation, Desalination Vol. 216. pp. 232-241.
[7] Abdallah Salah, Mazen M, Abukhader and Omar Badran. 2009. Performance correlations for basin tyupe solar stills, Desalination Vol. 249, pp. 128-137.
[8] Shanmugan S. Rajamohan P and Mutharasu. 2008. Performance study on an acrylic mirror boosted solar distillation, Desalination Vol. 230, pp. 281-287.
[9] CFX User manual, ANSYS, Inc, Modeling, CFX 12.0 solver.
[10] Hitesh N Panchal, Dr. P. K. Shah “ Modeling and Verification of single slope solar still using ANSYS CFX”, International Journal of Energy & Environment, Vol.2, Issue 6, 2011.
Hitesh N Panchal is a Mechanical Engineer and he is 28 years old. He obtained Bachelor of Engineering (B.E.) in
Mechanical discipline from Government Engineering College, Modasa (North Gujarat University, Patan) and Master of Engineering (M.E.) in Mechanical discipline with specialization in I.C. Engine & Automobile Engineering from L. D. College of Engineering, Gujarat University, Ahmedabad. He is pursuing for his Ph.D from Kadi Sarva Vishwavidyalaya, Gandhinagar under Guidance of Prof. (Dr.) P. K. Shah. Presently, He is assistant Professor in Department of Mechanical Engineering in Gujarat Power Engineering & Research Institute, Mehsana, Gujarat, India. He has teaching experience of 6+ years in the field of Non-conventional energy sources, Internal Combustion Engine, Automobile Engineering, Power Plant Engineering, Thermodynamics, Elements of Mechanical Engineering etc. He has published 17 research papers in reputed journal publisher like Springer, Taylor & Franics, Elsevier, ASME etc. He guided more than 30 projects at UG level and 8 at PG level. He also got grant from GUJCOST, DST and AICTE. He got also best research paper award from “Research Fair” organized by GTU. He is also reviewer of many international journals like, IJME, JESTEC, IJWRE etc. He is life member of ISTE, ISHRAE, ISME, SESI etc. He is editor of Int. j. of wind & Renewable Energy, Int. j. of mechanical engineering, Int. J. of advances in Engineering & Technology, Int. j. of Energy & Environment Research, Int. J. of Advances in Engineering Sciences, Int. J. of Renewable Energy Research, Int. J. of Sustainable Energy, J. of Engineering, Science & Technology, Int. J. of Emerging trends and applications in Engineering, Technology & Sciences.
E-mail address: [email protected]
P. K. Shah did his Graduation and Post-Graduation in Mechanical Engineering from Gujarat University. He
obtained his Ph. D. in Solar Heat Transfer from North Gujarat Uni. He has teaching experience of 39 years in various Engineering Colleges in Gujarat. He is a popular teacher among the students. He has written number of technical research papers and has presented them in National and International Conferences. He has published 20 Research Papers in reputed International and National Journals. He has written many scientific and general articles in various magazines. He also has written a text book on Thermodynamics for Engineering students. The subjects of his interest are Heat and mass Transfer and Energy Sources. Presently, he is working as Principal in Silver Oak College of Engineering and Technology, Ahmedabad.