Free Energy Landscape Analysis
Nilesh K. Banavali1,2*, Alexander D. MacKerell, Jr.3*
1Laboratory of Computational and Structural Biology, Division of Genetics, Wadsworth Center, New York State Department of Health, Albany, New York, United States of America,2Department of Biomedical Sciences, The State University of New York at Albany, Albany, New York, United States of America,3Department of Pharmaceutical Sciences, School of Pharmacy, University of Maryland, Baltimore, Maryland, United States of America
Abstract
Background: Structural changes in molecules are frequently observed during biological processes like replication, transcription and translation. These structural changes can usually be traced to specific distortions in the backbones of the macromolecules involved. Quantitative energetic characterization of such distortions can greatly advance the atomic-level understanding of the dynamic character of these biological processes.
Methodology/Principal Findings:Molecular dynamics simulations combined with a variation of the Weighted Histogram Analysis Method for potential of mean force determination are applied to characterize localized structural changes for the test case of cytosine (underlined) base flipping in a GTCAGCGCATGG DNA duplex. Free energy landscapes for backbone torsion and sugar pucker degrees of freedom in the DNA are used to understand their behavior in response to the base flipping perturbation. By simplifying the base flipping structural change into a two-state model, a free energy difference of upto 14 kcal/mol can be attributed to the flipped state relative to the stacked Watson-Crick base paired state. This two-state classification allows precise evaluation of the effect of base flipping on local backbone degrees of freedom.
Conclusions/Significance:The calculated free energy landscapes of individual backbone and sugar degrees of freedom expectedly show the greatest change in the vicinity of the flipping base itself, but specific delocalized effects can be discerned upto four nucleotide positions away in both 59and 39directions. Free energy landscape analysis thus provides a quantitative method to pinpoint the determinants of structural change on the atomic scale and also delineate the extent of propagation of the perturbation along the molecule. In addition to nucleic acids, this methodology is anticipated to be useful for studying conformational changes in all macromolecules, including carbohydrates, lipids, and proteins.
Citation:Banavali NK, MacKerell AD Jr (2009) Characterizing Structural Transitions Using Localized Free Energy Landscape Analysis. PLoS ONE 4(5): e5525. doi:10.1371/journal.pone.0005525
Editor:Martin Egli, Vanderbilt University, United States of America
ReceivedAugust 4, 2008;AcceptedMarch 27, 2009;PublishedMay 13, 2009
This is an open-access article distributed under the terms of the Creative Commons Public Domain declaration which stipulates that, once placed in the public domain, this work may be freely reproduced, distributed, transmitted, modified, built upon, or otherwise used by anyone for any lawful purpose.
Funding:NIH Grant GM51501 to ADM Jr. Wadsworth Center, NYSDOH New Investigator startup funds to NKB. The funders had no role in study design, data collection and analysis, decision to publish, or preparation of the manuscript.
Competing Interests:The authors have declared that no competing interests exist. * E-mail: [email protected] (NKB); [email protected] (ADM)
Introduction
Biological macromolecules and their complexes often undergo large structural changes during their functional cycles [1,2]. Such structural changes can be distributed throughout many regions of the molecules [3], but they are usually localized to specific regions that transform internally [4], while other regions maintain their internal structure and move almost as rigid bodies. Irrespective of which category the structural changes belong to, a quantitative method that could identify and characterize the energetics of structural changes at the precision level of well-defined local degrees of freedom is highly desirable. Many experimental methods such as X-ray crystallography [5] or Nuclear Magnetic Resonance (NMR) Spectroscopy [6] can identify the atomic details of stable states involved in the structural changes. Biochemical assays of enzymatic function [7] or Fluorescence Resonance Energy Transfer (FRET) experiments [8] can characterize the kinetics and thermodynamics of the structural changes. However, it is typically difficult to experimentally obtain atomic structural details associated with the energetics of macromolecular structural
change. Free energy determination methods using Molecular Dynamics (MD) simulations with empirical force fields [9–11] provide a framework to connect the structural and biochemical studies by determining free energy landscapes of global structural changes and the associated effective free energy landscapes of any local degree of freedom.
to the structural studies of M.HhaI. To carry out our MD simulations, we chose the well-studied DNA HhaI recognition sequence CCATGCGCTGAC as the test case, with the underlined cytosine base undergoing flipping. The single base flipping was studied using umbrella sampling [9] with restraints along a pseudodihedral reaction coordinate [17] that we had previously developed and applied in a number of studies of base flipping [18–22].
Other studies have probed the energetic characteristics of localized backbone degrees of freedom individually by using
umbrella sampling [23] or unrestrained [24] MD simulations. These studies describe the correlated behavior ofa-c[23] ore-f [24] torsions in specific base steps in the helical state of a DNA duplex. The present study goes further by probing the behavior of all localized torsions simultaneously in the background of the overall structural change involved in single base flipping as described before [25]. A two-state classification of the overall structural change allows identification of its effects on the smaller scale localized structural changes that either accompany it or drive it. This free energy analysis offers a detailed structural and energetic picture of a molecular conformational change.
Results
Two-state classification of the Watson-Crick stacked and high energy flipped states
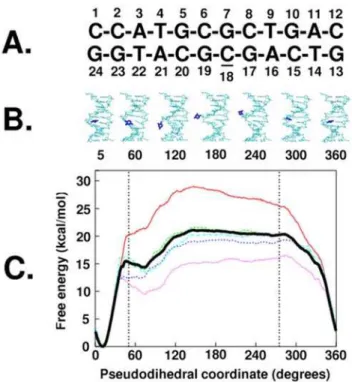
Base flipping is a structural change where an individual base moves out of its Watson-Crick (WC) base paired state, through either the minor or major groove, to a fully exposed state outside the double helix. Intermediate structures in the base flipping of the target cytosine (underlined in Figure 1A) are shown in Figure 1B with the associated free energy profiles or potentials of mean force (PMF) shown in Figure 1C. The free energy profile of the overall base flipping is similar to previously published PMFs [17–22] and shows the WC state in a deep energy well near 10u in the pseudodihedral coordinate with large barriers to flipping on either side (via the minor or major grooves) and a relatively flat landscape for the flipped states from 50uto 275u. The depth of the energy well for the WC paired state emphasizes the inherent stability of the DNA duplex and the energy required for a base to flip out of the double helix.
While there may be many subtleties in the base flipping process itself, on a coarser level, the nature of the one-dimensional free energy profile along the pseudodihedral restraint (Figure 1C) can be simplified into two states: the WC stacked state and the base flipped state. Table 1 indicates how dependent the calculated relative two-state free energy differences are based on the criteria used to classify the two states. If the sampling was divided into five subsets and different values of the one-dimensional pseudodihedral coordinate were used to classify the flipped and WC stacked states, the relative free energy differences vary from 6.2 kcal/mol to 20.9 kcal/mol. The details of how these values are obtained are given in the methods section. This variation was also apparent in the differences between the free energy profiles shown in Figure 1C.
Considering the entire sampling range, the classification criteria alone could vary the relative free energies from 7.1 kcal/mol to 13.9 kcal/mol. This energy difference provides a link between the
Figure 1. Free energy profile of the overall structural change
during cytosine base flipping. A. Numbered sequence of the
dodecamer used in the present study, underlined cytosine18 is the flipping base; B. Structures averaged over the last 2 ps of sampling in windows with pseudodihedral coordinates corresponding to labels, flipping cytosine18 shown in blue, rest of the DNA shown in cyan, harmonically constrained end basepairs are not shown; C. The Potential of Mean Force of Cytosine18 Base flipping along the periodic center-of-mass pseudodihedral reaction coordinate, Bold black line: entire 400 ps of sampling, red line: first 80 ps increment, dotted green line: second 80 ps increment, dotted blue line: third 80 ps increment, dotted pink line: fourth 80 ps increment, dotted cyan line: fifth 80 ps increment. doi:10.1371/journal.pone.0005525.g001
Table 1.The two state free energy difference between stacked and flipped states for different ranges of the pseudodihedral coordinate used to define the flipped state and different sampling intervals.
Sampling 25u–345u 35u–335u 45u–325u 55u–315u 65u–305u 50u–275u
0–80 ps 7.2 14 18.2 19.7 20.9 20
80–160 ps 7.2 13 13.5 13.5 13.7 13.5
160–240 ps 7.2 11.4 11.7 11.9 12.2 11.8
240–320 ps 6.2 9.1 9.1 9.2 9.2 9.2
320–400 ps 7.9 12.8 12.8 12.8 12.8 12.8
0–400 ps 7.1 13.3 13.8 13.9 14.1 13.9
experimental measurements and the structural states that are being measured. The qualitative nature of the free energy profile as reflected by the mean force along the pseudodihedral reaction coordinate directs the cytosine base towards the lowest energy stacked state at values below 50u and values above 275u in all sampling sets. The flipped state windows with pseudodihedral values between these two borders were therefore likely to be metastable. All subsequent analysis used these boundaries to classify the two states (the borders of the flipped state region are shown in Figure 1C as vertical dotted lines) and used the entire sampling range for both the stacked and flipped states. The flipped states hold potential free energy corresponding to the free energy difference between the stacked and flipped states. Previous structural analysis suggested that the stress accompanying a single base flipping out of the double helix was localized to backbone regions between the nearest neighbor partners [18]. The present two-state classification based analysis of energy landscapes can confirm whether this stress also subtly changes the behavior of remote regions of the molecule.
In experimental studies that quantified base pair opening using imino-proton exchange, it was the relative probabilities of the stacked and opened states that were probed [15,16]. However, there is evidence that these experiments may not measure the larger base flipping structural change observed in the presence of M.HhaI. It has been previously suggested that minimal correlated opening between the paired bases may be required for imino-proton exchange to occur [26], only locally open states may be involved, and opening of purine bases as opposed to pyrimidine bases may dominate the NMR measurements [21]. Opening rate constants from imino proton exchange are in the 100 s21range [15,16] while more recent experimental studies based on trapping of the flipped base in b-cyclodextrin yield rate constants in the
1023s21range. The 5 orders of magnitude difference between the rate constants obtained from the two experimental approaches corresponds to an energy barrier difference of up to 7 kcal/mol assuming that the pre-exponential term in transition state theory is the same for both processes. The present study indicates that this difference can be bridged by including marginally flipped conformations in the classification of the flipped states resulting in a smaller energy difference. Our results also suggest that the higher rate constants obtained from imino proton exchange might be associated with local opening or marginally flipped states while the lower rate constants obtained by trapping experiments might be associated with full flipping of the base out of the double helix.
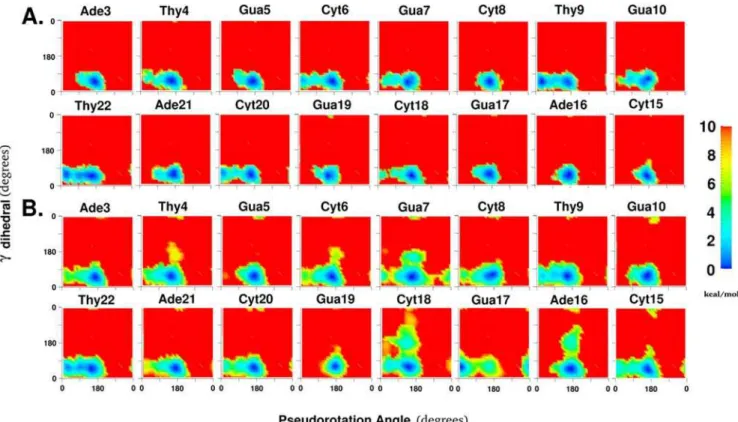
Conformational analysis using free energy landscapes This study focuses on readily visualizing and quantifying the range of conformational space sampled by local degrees of freedom during a structural change in the macromolecule; which in the present case is the flipping of a base out of a DNA duplex. This was performed by calculating the unbiased effective free energy landscapes of the local degrees of freedom, as described below in the Materials and Methods. For example, all panels in figure 2 show the 2D free energy landscape of the sugar pucker vs xdegrees of freedom for specific base positions. The color coding for the conformations goes from blue to green to yellow through to red in the direction of increasing energies, with red representing the forbidden conformations. Throughout this study, the forbid-den regions correspond to regions with relative energies of 10 kcal/mol or greater above the minimum for each 2D free energy landscape (see methods for justification of the value of 10 kcal/mol for truncation). The extent of convergence of calculated free energy landscapes is difficult to guarantee. Agreement with experimental results for the restrained degree of
freedom could indicate that calculated free energy landscapes are representative of the experimental regimen. This issue of convergence is discussed in greater detail in the supporting information.
Base and sugar degrees of freedom
The standard nomenclature of backbone torsions in DNA classifies them asa,b,c,x,e, andf[27]. The conformation of the furanose sugar ring can be condensed into two combined degrees of freedom called the pseudorotation angle and pseudorotation amplitude [28]. The six aforementioned torsions and the pseudorotation angle substantially describe the conformational state of each individual nucleotide, in contrast to other geometric criteria used to describe the relationship between nucleotide and base-pair positions or the helical state of the DNA oligonucleotide [29]. Since the difference between individual nucleotide positions is the identity of the base attached to the sugar moiety, the correlation between pseudorotation angle and the glycosyl torsion x is a localized conformational relationship of special interest in describing base composition and sequence dependent structural changes of the oligonucleotide.
Figure 2 shows the free energy landscape of motion along these two degrees of freedom for all 8 central base positions in the oligonucleotide for both the stacked state (Fig. 2A) and the flipped states (Fig. 2B). In the stacked state, all nucleotide positions, except Thy9, preferred the C29-endo sugar pucker (P value around 180u) and the correspondingxminimum around 260u(Table S1 of the Supplementary material). Interestingly, there were some clear differences between the behavior of the same base in different sequence contexts. For example, the order of relative preference for C29-endo sugar pucker over C39-endo sugar pucker was Thy4&Thy22.Thy9. The sequence context beyond immediate neighbors also seemed to play a role since Thy4 and Thy22 show consistently different preferences in both stacked and flipped states even while having the same adjacent bases in the sequence (59-Ade and 39-Gua). However, the differences may also result from a lack of convergence of the sampling of conformational space. The lowest energy state minima and the alternate minima seen to be accessible for certain positions give a succinct description of the ground state dynamics of this particular DNA sequence in aqueous solution for the sugar pucker andxtorsion degrees of freedom.
In base positions that show transitions between C39-endo and C29-endo sugar puckers, the O49-endo sugar pucker appears to be a metastable intermediate. The surfaces reveal two barriers separating the O49-endo conformation from the C39-endo and the C29-endo conformation. One barrier between the C39-endo and O49-endo conformations requires only a change in the sugar pucker, while the second barrier between the O49-endo confor-mation and the C29-endo conformation requires correlated changes in both sugar pucker and xtorsions. The ability of the present free energy analysis to readily identify these paths represents an important attribute of the method.
When the flipped state was considered separately from the stacked state (Fig. 2B), the minima in these two local degrees of freedom shifted significantly for some base positions. The most substantial shifts occurred for Thy9 and Gua17, which inverted their preferences from C39-endo and C29-endo sugar puckers to C29-endo and C39-endo sugar puckers, respectively. In addition, the range of 2D conformational space sampled increased for all base positions studied. This broadening of the valley regions of the free energy landscape made more regions of local conformational space accessible for the flipped state. There were also other clear shifts for the higher energy regions in Ade3 (C39-endo pucker more favorable), Cyt8 (C39-endo pucker more favorable), Gua10
(C39-endo pucker less favorable), Cyt15 (C39-endo pucker more favorable), Cyt20 (C39-endo pucker less favorable), and Ade21 (C39-endo pucker more favorable). The perturbation caused by the overall structural change of Cyt18 flipping is clearly not restricted to the adjacent base pairs alone.
However, for the flipped state, the greatest perturbation occurred in the vicinity of the flipping base. The sugar pucker andxtorsions for the flipping Cyt18 sampled almost 25% of the total 2D conformational space available. The x torsion was especially variable around the minimum of about 165u. This greatly increased flexibility is suggested to be associated with removal from the immediate constraints of the double helix. The orphan Gua7 base position also showed a remarkable character-istic: the so-called ‘‘west’’ barrier to sugar pucker change (i.e.
pseudorotation angles about 270u), which was indicated to be extremely disfavored according to vacuumab initiostudies [30], was about 8 kcal/mol and comparable to the ‘‘east’’ barrier (i.e.
pseudorotation angles about 90u). The Gua7 sugar could thus choose either barrier to invert sugar puckers when Cyt18 was flipped. Specific environmental conditions (in this case: no pairing with Cyt18 while base stacking is maintained) can change the conformational behavior of a specific nucleotide position in unexpected ways. Since protein binding and altered neighboring sequences both change the environment of individual DNA bases, the ability to quantify changes in conformational preferences of individual base positions due to environmental influences is likely to be very useful in understanding DNA-protein interactions and DNA sequence dependence.
BI/BII equilibrium
Theeandftorsions in DNA populate two correlated minima called the BI and BII forms [31]. The BI form is defined asein the range 130u–210uandfin the range 235u–295uand the BII form is defined asein the range 210u–300uandfin the range 150u–210u [31]. The free energy landscapes of theeandftorsions for the 8 central base pairs are shown in Figure 3. In the lower energy stacked state (Figure 3A), base positions Cyt8, Gua17, Cyt18, and Ade21 appear virtually locked in their BI form, while Gua7 and Gua19 show the greatest tendency to populate both the BI and BII forms.
In the flipped state, the broadening effect seen in x and pseudorotation angle degrees of freedom was also present for all 16 central base positions in theeand ftorsional space (Figure 3B). The BII form became less favorable in base positions Gua5 and Gua19 as compared to the stacked state. In Thy4, an additional region of conformational space withearound 300uandfaround 60u became accessible through the BII form. The BII form became the lowest energy minimum for the orphan Gua7 base position with two low energy paths connecting it to the location of the original BI form and to another minimum atearound 270u andfaround 270u.
Sugar and phosphodiester backbone
Among torsions that connect the sugar through the phospho-diester linkages to adjacent sugars, thectorsion lies immediately to the 59-side of each sugar, and theetorsion lies immediately to its 39-side. The correlated changes in the free energy landscapes of thectorsion and the pseudorotation angle for the 8 central base pairs are shown in Figure 4. One clear characteristic that agrees with crystallographic observations on B-form DNA structures [35] is that thectorsion prefers thegauche2minimum around 55uin all nucleotide positions. Thectorsion and the pseudorotation angle can sample regions within a diameter of approximately 90uaround the primary minimum in the 2D torsional space. As seen above with thex degree of freedom, the sampling range is greater for positions that show the possibility of exchange between C39-endo and C29-endo sugar puckers such as Thy4, Cyt6, Gua7, Thy9, Gua10, Cyt18, Cyt20, and Thy22, but only in the pseudorotation angle dimension, withcmaintaining its original minimum.
When only the flipped state is considered (Figure 4B), the general broadening effect and sugar pucker preference changes accompanying flipping seen above are observed in these degrees of freedom as well. In addition, thetransstate of thectorsion is now accessible in the nucleotide positions of Thy4, Cyt6, Gua7, Ade16, and the flipping Cyt18. The similarities between Ade16 and the flipping Cyt18 are especially notable since the intervening Gua17 base showed no change in preference for the c torsion and a complete shift to the C39-endo sugar pucker. This is consistent with our previous observations [17] that the flipping base can interact with regions of the DNA duplex beyond its immediately adjacent base pairs while it undergoes base flipping through either the minor or major grooves. The greatest broadening effect for the free energy landscape again occurs in the vicinity of the flipping
site. Cyt18 itself shows not only a clear metastable minimum for thetransstate of thectorsion but also greater accessibility of the
gauche+state with the C29-endo sugar pucker, and thetransstate with the C39-endo sugar pucker. These observations do not contradict structural data from experiment, since the flipping base is free of the constraints of the canonical double helix and probably resembles more the behavior of individual nucleotides where these conformations are not unusual [36]. In crystal structures of this sequence bound to theHhaImethyltransferase, the trans state of the c torsion of the flipping position was consistently observed, irrespective of the presence or identity of the flipping base [32]. This again illustrates how alternative confor-mations of local torsions stabilized through modifications of the environment contribute to larger scale structural changes such as base flipping.
The free energy landscapes of the pseudorotation angle ande torsions for the 8 central base pairs are shown in Figure 5. In the stacked state (Figure 5A), the pseudorotation angle preferences are as described above, but the correlated motion in the e torsion indicates that the BI/BII equilibrium mostly accompanies the C29 -endo sugar pucker and consequently the B-form of DNA. Most base positions show accessibility toetorsion values (around 260u) usually found in the BII form and not in the BI form [37]. Some base positions (Cyt8, Gua17, Cyt18, and Ade21, and to a lesser extent Thy9, Cyt15, Cyt20, and Thy22) did not show such accessibility. Notably,etorsion values around 260uwere not found to accompany pseudorotation angles below 90ucorresponding to C39-endo sugar puckers. This is reflected in the inverted L-shaped 2D free energy landscapes for nucleotide positions that show change in both sugar pucker andetorsion minima (e.g. Thy4 and Gua7). If these higheretorsion values were to accompany C39
-Figure 3. The two dimensional free energy landscapes of 8 central base positions showing the BI/BII equilibrium along theetorsion
and theftorsion for A. all pseudodihedral coordinate windows, B. only pseudodihedral coordinate windows classified as flipped
state windows as shown in Figure 1C.Representative locations of the BI and BII form minima indicated by arrows and labels for the Thy22 position. All torsion values are in degrees and energies are color coded in kcal/mol and truncated at 10 kcal/mol.
Figure 4. The two dimensional free energy landscapes of 8 central base positions along thectorsion and the pseudorotation angle for A. all pseudodihedral coordinate windows, B. only pseudodihedral coordinate windows classified as flipped state windows as shown in Figure 1C.All torsion values are in degrees and energies are color coded in kcal/mol and truncated at 10 kcal/mol.
doi:10.1371/journal.pone.0005525.g004
Figure 5. The two dimensional free energy landscapes of 8 central base positions along the pseudorotation angle and theetorsion for A. all pseudodihedral coordinate windows, B. only pseudodihedral coordinate windows classified as flipped state windows as shown in Figure 1C.All torsion values are in degrees and energies are color coded in kcal/mol and truncated at 10 kcal/mol.
endo sugar puckers, these energy landscapes are expected to be U-shaped.
In the flipped states (Figure 5B), the familiar broadening of the free energy landscape valleys also occurs in these two dimensions, but with varying trends for individual positions. While most nucleotides showed increased accessibility toetorsion values in the range of 260u, some base positions (Gua5 and Gua19) actually showed decreased accessibility. These higheretorsion values also did not occur with the C39-endo sugar pucker even in the flipped states. The exception to this rule was the orphan Gua7 base position, which not only shifted its lowest energy state to these highere values corresponding to the BII form (Table S1 of the Supplementary material), but also allowed them to accompany its C39-endo sugar pucker conformations, resulting in a roughly U-shaped landscape. Cyt18 also had much greater flexibility when it flipped out of the double helix, especially noticeable in its access of the unusual state where its sugar is in the C39-endo conformation and itsetorsion value is around 100u.
Helicoidal parameters
DNA conformation could also be understood in the context of base step or helicoidal parameters [38]. While we have focused our analysis on dihedral degrees of freedom, the present method may also be applied to analyze these base step and helicoidal parameters. As an example, the approach has been applied to twist and roll base step parameters and the results are included in the supporting material (see supplementary material figure S2 and text S1 for more details).
Discussion
Umbrella sampling MD simulations typically condense the complex multidimensional free energy landscape of specific conformational changes in macromolecules into one or two reaction coordinate dimensions [17,39]. Depending on the choice of reaction coordinate, the free energy profiles obtained provide uncomplicated insights into the properties of the specific processes studied. However, the conformational changes themselves are a complex combination of individual degrees of freedom at the atomic scale, amongst which, internal degrees like atomic bond lengths and angles are relatively rigid, while rotations around bonds are typically more flexible, often making important contributions to the studied conformational change. Changes in non-bonded interactions with other parts of the macromolecule and the solvent environment are also important in the conforma-tional changes. The present study presents a method to extract the complex localized conformational characteristics that contribute to larger conformational changes through the calculation of free energy landscapes of local degrees of freedom. A systematic analysis of the contribution of local torsions in single base flipping out of a DNA duplex was used as a test case.
Delving into the complexities associated with conformational changes becomes necessary because the simplification into a single reaction coordinate in umbrella sampling typically does not allow for mechanistic explanations for larger structural changes being observed to be derived. When certain single base mutations result in profound changes in conformational behavior or molecular recognition [40,41], a convincing mechanistic explanation is often elusive. When a very localized change results in a change in behavior for the entire macromolecule, the reason behind the change presumably needs to be tracked down to its local origins. In this case, the wealth of information in MD simulations is an advantage because it allows quantification of the complex free energy landscape with respect to the local degrees of freedom of
interest. In the present study, local features contributing to the structural change of base flipping on a DNA oligonucleotide are clarified by determining the local torsional free energy landscapes. The higher free energy (.10 kcal/mol) conferred on the double helix due to base flipping is partially stored by the flipped state as unfavorable torsions in the immediate vicinity of the flipping base, but also as unfavorable torsions in remote parts of the oligonucleotide. This dispersal of stress is not uniform, with certain remote nucleotides and certain torsions within the duplex showing greater susceptibility to assume unfavorable conforma-tions. This is presumably related to the long-range relationships between the backbone moieties or direct interactions with the flipping base itself, as previously observed [17]. Some of the more prominent examples are thectorsion in Ade16, the pseudorota-tion angle in Cyt15, and the BI/BII equilibrium in Thy22. Free energy landscape analysis also indicates unusual sequence dependent conformational properties of certain nucleotides unrelated to Cyt18 flipping. For example, Thy4, Thy9 and Thy22 show larger stabilization of the C39-endo sugar pucker, while Cyt8 and Ade21 show much lower stability of the BII form even when Cyt18 is in its stacked state.
In future studies, the criteria for subdivision of higher energy states can be branched further to obtain more detailed understanding of specific local conformational changes contribut-ing to different aspects of the overall structural change. The differences in free energy landscapes of local degrees of freedom between the two global states can also be quantified more precisely by overlap integral calculations [42]. The effect of environment (water and ions) is included in the localized free energy landscapes, but a more complete mechanistic decomposition of this effect is desirable. Since the free energy landscape can be extracted for any degree of freedom, free energy landscapes of order parameters describing water structure or ion positions can also be determined by the present method. The ability to energetically analyze macromolecular behavior in such detail also provides a good calibration tool for force field development by helping to relatively quickly determine how the free energy of alternate conformations is modulated by specific changes in force field parameters. Differences in free energy landscapes of local order parameters for the same nucleotide in varying sequence contexts will provide a quantitative measure of sequence dependence. This potential suggests that by routinely applying the present analysis to different nucleic acid sequences undergoing various structural changes, it may be possible to achieve a detailed and robust understanding of the relationship between base composition, base sequence and structural heterogeneity in nucleic acids. Finally, it should be reiterated that free energy landscape analysis is general and can be easily applied to any macromolecule to get an atomic-scale characterization of its biological function.
Materials and Methods
sodium ions to electrostatically neutralize the system. Long-range electrostatic interactions were treated using the Particle Mesh Ewald (PME) approach [50] with a B-spline order of 4 and a Fast Fourier Transform grid of one point per A˚ and a real-space Gaussian width kappa of 0.3 A˚21. Real space and Lennard-Jones (LJ) interaction cutoffs of 8 A˚ were used with non-bond interaction lists maintained and heuristically updated out to 16 A˚ . The entire system was minimized and the solvent environment was equilibrated for 20 ps using a constant volume, isothermal (NVT) ensemble MD simulation with the DNA non-hydrogen atoms kept harmonically restrained. The system was equilibrated for a further 0.5 ns of constant pressure, isothermal (NPT) [51] dynamics without restraints.
The procedure for calculation of the free energy of base flipping using umbrella sampling with the previously described pseudodi-hedral coordinate [17] is slightly modified in this study. Harmonic restraints with force constants of 2 kcal/mol were applied to non-hydrogen atoms of 59 and 39-end base pairs to prevent the end base-pair fraying observed in the previous study. This restraint also prevented translation and rotation of the DNA within the periodic simulation box. For the umbrella sampling, a periodic pseudodi-hedral harmonic restraint was used:
wj~
1
2Kjðjð Þt {jminÞ
2 ð1Þ
wherewjis the restraint energy,Kjis the force constant in kcal/
mol/radian2,j(t)is the value of the pseudodihedraljat timet, and jmin is the value to which the pseudodihedral is restrained. To impose periodicity in the restrained pseudodihedral, we use the following function:
j~ðjjz180jmod 360Þ{180 ð2Þ
All 72 windows spanning the periodic range (5uintervals for a total range of 360u) of the pseudodihedral coordinate describing base flipping were generated by using the above restraint with a large force constant of 10000 kcal/mol/radian2and 20 ps of NPT MD simulation to equilibrate each window before using the final coordinates as starting coordinates for the next window. This is in contrast with the very fast flipping used in the original study to generate initial coordinates and presumably allowed the system to absorb the flipping change more gradually. These initial windows were then used as starting points for umbrella sampling MD simulations with the pseudodihedral restraint. The final system in each window, consisting of 21306 atoms including 6842 waters and 22 sodium ions, was then allowed to evolve with a pseudodihedral restraint of 1000 kcal/mol/radian2for a further 0.4 ns of NPT MD simulations, all of which were saved at each step of the dynamics and used for subsequent analysis. The total simulation time for all windows combined was 30 ns. The periodic WHAM algorithm [39,52] was used to calculate the potential of mean force (PMF) along the one-dimensional pseudodihedral reaction coordinate from the time series of this variable saved at every integration step of the 0.4 ns production dynamics. This highest frequency of sampling was used to prevent capturing any brief transition states, however, it is possible to reduce the frequency of sampling to once every 50 steps without a substantial change in the energy profiles (see supplementary material figure S1 and text S1 for more details)
As explained in a previous study on global structural change in DNA [25], to calculate free energy landscapes of local degrees of freedom, first the biased probability distribution, ,rbias(j1,j2). for the two variables: j1= restrained pseudodihedral, j2= any
unrestrained localized variable such as a backbone torsion, was calculated from the time series of these two variables saved at each dynamics step in all umbrella sampling windows. The unbiased probability distribution ,r(j1,j2). was then calculated from
,rbias(j1,j2). using the Weighted Histogram Analysis Method (WHAM) equations [52]:
Sr jð 1,j2ÞT~
PN i
niSrbiasðj1,j2ÞT
PN i
njexpFj{wjð Þj1
kBT
ð3Þ
exp Fj
kBT
~ ð
Sr jð 1,j2ÞTexp½{wið Þ=j1 kBTdj1dj2 ð4Þ
whereNis the number of windows,niis the number of bins,njis the number of windows,Fjare the free energy constants for each window andwjis the biasing harmonic potential imposed along the pseudodihedral reaction coordinate shown in Eq. (1). The above WHAM equations minimize the overlap error between different windows that span the restrained pseudodihedral coordinate and corrects for the effect of the imposed artificial restraint. They therefore provide an accurate estimate of the continuous unrestrained free energy profile spanning the overall structural change along the pseudodihedral coordinate, inclusive of the local degrees of freedom whose free energy landscapes are being probed. A converged value of,r(j1,j2).was obtained by iterating through Eq. (2) and Eq. (3) using a convergence criterion of 0.0001 in successiveFjvalues. The unbiased density ,r(j2). for the unrestrained coordinatej2was obtained from:
Sr jð Þ2T~
ð
Sr jð 1,j2ÞTdj1 ð5Þ
and the free energy surface represented by W(j2) was obtained from:
Wð Þ~{j2 kBTlnðSr jð Þ2 TÞzC ð6Þ
whereCis an arbitrary constant. It is important to note thatW(j2) was calculated without enforcing sampling along the unrestrained dimension, j2, such that the entire range accessible to this dimension might not necessarily be explored. However, adequate sampling of the local, unrestrained degrees of freedom was assumed once convergence of the free energy profile along the original restrained pseudodihedral coordinate was attained (see supplementary material text S1 for an expanded discussion).
The two state free energy difference values shown in Table 1 were obtained by defining two specific ranges of the pseudodihe-dral windows as stacked and flipped, then integrating the Boltzmann factor exp[2W(jstacked)/kBT] or exp[2W(jflipped)/kBT] for those ranges in the pseudodihedral coordinatej, and finally getting the difference between the resulting free energy values
all flipped states (since all flipped states lie between 10 kcal/mol and 20 kcal/mol in overall free energy values); and (c) the probability of finding a specific conformation with a relative free energy of 10 kcal/mol is exponentially smaller (less than 1027) compared to the lowest energy conformation. It should be noted that generating separate histograms for two states without using the present WHAM methodology would be sufficient for simulations where no restraint potential is used. However, it would yield incorrect results for simulations with a biasing restraint potential.
In the present work, the free energy landscape protocol was applied to two unrestrained dimensions, though the method is certainly extensible to three or more conformational degrees of freedom. A description of how the method can be extended to two unrestrained degrees of freedom is included in the supporting material. However, inclusion of additional degrees of freedom in the free energy landscapes might make the histograms very sparse in individual windows and convergence might be more difficult. All analysis of torsion angle related parameters was performed using either the FREEHELIX98 program [54] modified to read CHARMM trajectories or the 3DNA program [38]. Molecular pictures were produced using DINO (http://www.dino3d.org) and graphs were made using either gnuplot (http://www.gnuplot. org) or OPENDX (http://www.opendx.org) and compiled using GIMP (http://www.gimp.org) software.
Supporting Information
Text S1
Found at: doi:10.1371/journal.pone.0005525.s001 (0.04 MB DOC)
Table S1
Found at: doi:10.1371/journal.pone.0005525.s002 (0.06 MB DOC)
Figure S1
Found at: doi:10.1371/journal.pone.0005525.s003 (2.41 MB TIF)
Figure S2
Found at: doi:10.1371/journal.pone.0005525.s004 (0.70 MB TIF)
Acknowledgments
The calculations were performed using computational support from an MRAC grant for Teragrid resources at PSC and TACC to NKB and computational support from CCNI/RPI to NKB.
Author Contributions
Conceived and designed the experiments: NKB ADMJ. Performed the experiments: NKB. Analyzed the data: NKB ADMJ. Contributed reagents/materials/analysis tools: NKB. Wrote the paper: NKB ADMJ.
References
1. Gross JD, Moerke NJ, von der Haar T, Lugovskoy AA, Sachs AB, et al. (2003) Ribosome loading onto the mRNA cap is driven by conformational coupling between eIF4G and eIF4E. Cell 115: 739–750.
2. Duderstadt KE, Berger JM (2008) AAA+ATPases in the initiation of DNA replication. Crit Rev Biochem Mol Biol 43: 163–187.
3. Gu B, Zhang FS, Wang ZP, Zhou HY (2008) Solvent-induced DNA conformational transition. Phys Rev Lett 100: 088104.
4. Harrison SC (2004) Whither structural biology? Nat Struct Mol Biol 11: 293–295.
5. Wery JP, Schevitz RW (1997) New trends in macromolecular X-ray crystallography. Curr Op Chem Biol 1: 365–369.
6. Foster MP, McElroy CA, Amero CD (2007) Solution NMR of large molecules and assemblies. Biochemistry 46: 331–340.
7. Chene P (2008) Challenges in design of biochemical assays for the identification of small molecules to target multiple conformations of protein kinases. Drug Discov Today 13: 522–529.
8. Schuler B, Eaton WA (2008) Protein folding studied by single-molecule FRET. Curr Opin Struct Biol 18: 16–26.
9. Torrie GM, Valleau JP (1977) Nonphysical sampling distributions in monte carlo free-energy estimation: Umbrella sampling. J Comput Phys 23: 187–199. 10. Chipot C, Pearlman DA (2002) Free energy calculations. the long and winding
gilded road. Molecular Simulation 28: 1–12.
11. Bolhuis PG, Chandler D, Dellago C, Geissler PL (2002) Transition path sampling: Throwing ropes over rough mountain passes, in the dark. Ann Rev Phys Chem 53: 291–318.
12. Klimasauskas S, Kumar S, Roberts RJ, Cheng X (1994)HhaImethyltransferase flips its target base out of the DNA helix. Cell 76: 357–369.
13. Mol CD, Hosfield DJ, Tainer JA (2000) Abasic site recognition by two apurinic/ apyrimidinic endonuclease families in DNA base excision repair: the 39ends justify the means. Mutat Res 460: 211–229.
14. Stivers JT (2004) Site-Specific DNA Damage Recognition by Enzyme-Induced Base Flipping. Prog Nucleic Acid Res Mol Biol 77: 37–65.
15. Gueron M, Kochoyan M, Leroy JL (1987) A single mode of DNA base-pair opening drives imino proton exchange. Nature 328: 89–92.
16. Leroy JL, Kochoyan M, Huynh-Dinh T, Gueron M (1988) Characterization of base-pair opening in deoxynucleotide duplexes using catalyzed exchange of the imino proton. J Mol Biol 200: 223–238.
17. Banavali NK, MacKerell Jr AD (2002) Free energy and structural pathways of base flipping in a DNA GCGC containing sequence. J Mol Biol 319: 141–160. 18. Banavali NK, Huang N, MacKerell Jr AD (2006) Conserved patterns in backbone torsional changes allow for single base flipping from duplex DNA with minimal distortion of the double helix. J Phys Chem B 110: 10997–11004. 19. Priyakumar UD, MacKerell Jr AD (2006) Computational approaches for
investigating base flipping in oligonucleotides. Chem Rev 106: 489–505. 20. Priyakumar UD, MacKerell Jr AD (2006) Base flipping in a GCGC containing
DNA dodecamer: A comparative study of the performance of the nucleic acid force fields, CHARMM, AMBER, and BMS. J Chem Theory Comput 2: 187–200.
21. Priyakumar UD, MacKerell Jr AD (2006) NMR imino proton exchange experiments on duplex DNA primarily monitor the opening of purine bases. J Am Chem Soc 128: 678–679.
22. Huang N, MacKerell Jr AD (2004) Atomistic view of base flipping in DNA. Philos Trans R Soc London, Ser A 362: 1439–1460.
23. Varnai P, Djuranovic D, Lavery R, Hartmann B (2003) Alpha/gamma Transitions in the B-DNA backbone. Nucleic Acids Res 30: 5398–5406. 24. Rauch C, Trieb M, Wellenzohn B, Loferer M, Voegele A, et al. (2003)
C5-methylation of cytosine in B-DNA thermodynamically and kinetically stabilizes BI. J Am Chem Soc 125: 14990–14991.
25. Banavali NK, Roux B (2005) The free energy landscape of A-DNA to B-DNA conversion in aqueous solution. J Am Chem Soc 127: 6866–6876.
26. Varnai P, Canalia M, Leroy JL (2004) Opening Mechanism of G.T/U Pairs in DNA and RNA duplexes: A Combined Study of Imino Proton Exchange and Molecular Dynamics Simulation. J Am Chem Soc 126: 14659–14667. 27. Saenger W (1984) Principles of Nucleic Acid Structure. New York: Springer
Verlag. 556 p.
28. Altona C, Sundaralingam M (1972) Conformational analysis of sugar ring in nucleosides and nucleotides - new description using concept of pseudorotation. J Am Chem Soc 94: 8205–8206.
29. Olson W, Bansal M, Burley SK, Dickerson RE, Gerstein M, et al. (2001) A standard reference frame for the description of nucleic acid base-pair geometry. J Mol Biol 313: 299–237.
30. Foloppe N, MacKerell Jr AD (1998) Conformational properties of the deoxyribose and ribose moieties of nucleic acids: A quantum mechanical study. J Phys Chem B 102: 6669–6678.
31. Schneider T (2001) Strong minor groove base conservation in sequence logos implies DNA distortion or base flipping during replication and transcription initiation. Nucleic Acids Res 29: 4881–4891.
32. Wang PY, Brank AS, Banavali NK, Nicklaus MC, Marquez VE, et al. (2000) Use of oligodeoxyribonucleotides with conformationally constrained abasic sugar targets to probe the mechanism of base flipping by HhaI DNA (cytosine C5)-methyltransferase. J Am Chem Soc 122: 12422–12434.
33. Horton JR, Ratner G, Banavali NK, Huang N, Choi Y, et al. (2004) Caught in the act: visualization of an intermediate in the DNA base-flipping pathway induced by Hhal methyltransferase. Nucleic Acids Res 32: 3877– 3886.
34. Marquez VE, Ben-Kasus T, Barchi JJ, Green KM, Nicklaus MC, et al. Experimental and structural evidence that herpes 1 kinase and cellular DNA polymerase(s) discriminate on the basis of sugar pucker. J Am Chem Soc 126: 543–549.
35. Foloppe N, MacKerell Jr AD (1999) Contribution of the phosphodiester backbone and glycosyl linkage intrinsic torsional energetics to DNA structure and dynamics. J Phys Chem B 103: 10955–10964.
37. Schneider B, Neidle S, Berman HM (1997) Conformations of the sugar-phosphate backbone in helical DNA crystal structures. Biopolymers 42: 113–124.
38. Lu XJ, Olson WK (2003) 3DNA: a software package for the analysis, rebuilding and visualization of three-dimensional nucleic acid structures. Nucleic Acids Res 31: 5108–5121.
39. Crouzy S, Baudry J, Smith JC, Roux B (1999) Efficient calculation of two-dimensional adiabatic and free energy maps: application to the isomerization of the C13 = C14 and C15 = N16 bonds in the retinal of bacteriorhodopsin. J Comput Chem 20: 1644–1658.
40. Edgell DR, Stanger MJ, Belfort M (2003) Importance of a single base pair for discrimination between intron-containing and intronless alleles by endonuclease I-BmoI. Curr Biol 13: 973–978.
41. Sidorova NY, Rau DC (2005) Differences between EcoRI nonspecific and star sequence complexes revealed by osmotic stress. Biophys J 87: 2564–2576. 42. Bernard D, Coop A, MacKerell Jr AD (2007) Quantitative Conformationally
Sampled Pharmacophore fordOpioid Ligands: Reevaluation of Hydrophobic Moieties Essential for Biological Activity. J Med Chem 50: 1799–1809. 43. Varnai P, Lavery R (2002) Base flipping in DNA: pathways and energetics
studied with molecular dynamic simulations. J Am Chem Soc 124: 7272–7273. 44. Huang N, Banavali NK, MacKerell Jr AD (2003) Protein-facilitated base flipping in DNA by cytosine-5-methyltransferase. Proc Natl Acad Sci U S A 100: 68–73.
45. Brooks BR, Bruccoleri RE, Olafson BD, States DJ, Swaminathan S, et al. (1983) CHARMM - a program for macromolecular energy, minimization, and dynamics calculations. J Comput Chem 21: 105–120.
46. Mackerell Jr AD, Banavali NK, Foloppe N (2000) Development and current status of the CHARMM force field for nucleic acids. Biopolymers 56: 257–265. 47. Mackerell Jr AD, Banavali NK (2000) All-atom empirical force field for nucleic acids: II. Application to molecular dynamics simulations of DNA and RNA in solution. J Comput Chem 21: 105–120.
48. Jorgensen WL, Chandrasekhar J, Madura JD, Impey RW, Klein ML (1983) Comparison of simple potential functions for simulating liquid water. J Chem Phys 79: 926–935.
49. Beglov D, Roux B (1994) Finite representation of an infinite bulk system: Solvent boundary potential for computer simulations. J Chem Phys 98: 10089–10092. 50. Darden T, York D, Pedersen L (1993) Particle Mesh Ewald - an N.log(N)
method for Ewald sums in large systems. J Chem Phys 98: 10089–10092. 51. Feller SE, Zhang Y, Pastor RW, Brooks BR (1995) Constant pressure molecular
dynamics simulation - the Langevin piston method. J Chem Phys 103: 4613–4621.
52. Kumar S, Bouzida D, Swendsen RH, Kollman PA, Rosenberg JM (1992) The weighted histogram analysis method for free-energy calculations on biomolecules .1. The method. J Comput Chem 13: 1011–1021.
53. Souaille M, Roux B (2001) Extension to the weighted histogram analysis method: combining umbrella sampling with free energy calculations. Comput Phys Comm 135: 40–57.