www.hydrol-earth-syst-sci.net/14/1233/2010/ doi:10.5194/hess-14-1233-2010
© Author(s) 2010. CC Attribution 3.0 License.
Earth System
Sciences
Catchment conceptualisation for examining applicability of chloride
mass balance method in an area with historical forest clearance
H. Guan1,2, A. J. Love1,2,3, C. T. Simmons1,2, J. Hutson1,2, and Z. Ding1,4
1School of the Environment, Flinders University, Australia
2National Centre for Groundwater Research and Training, Australia
3Department of Water, Land and Biodiversity Conservation, South Australia 4College of Earth and Environmental Science, Lanzhou University, China
Received: 9 September 2009 – Published in Hydrol. Earth Syst. Sci. Discuss.: 17 November 2009 Revised: 16 June 2010 – Accepted: 4 July 2010 – Published: 13 July 2010
Abstract. Of the various approaches for estimating ground-water recharge, the chloride mass balance (CMB) method is one of the most frequently used, especially for arid and semiarid regions. Widespread native vegetation clearance, common in many areas globally, has changed the land sur-face boundary condition, posing the question as to whether the current system has reached new chloride equilibrium, re-quired for a CMB application. Although a one-dimensional CMB can be applied at a point where the water and chloride fluxes are locally in steady state, the CMB method is usu-ally applied at a catchment scale owing to significant lateral flows in mountains. The applicability of the CMB method to several conceptual catchment types of various chloride equi-librium conditions is examined. The conceptualisation, com-bined with some local climate conditions, is shown to be use-ful in assessing whether or not a catchment has reached new chloride equilibrium. The six conceptual catchment types are tested with eleven selected catchments in the Mount Lofty Ranges (MLR), a coastal hilly area in South Australia having experienced widespread historical forest clearance. The re-sults show that six of the eleven catchments match a type VI chloride balance condition (chloride non-equilibrium with a gaining stream), with the ratios of stream chloride output (O) over atmospheric chloride input (I), or catchment chloride O/I ratios, ranging from 2 to 4. Two catchments match a type V chloride balance condition (chloride non-equilibrium with a losing stream), with catchment chloride O/I ratios about 0.5. For these type V and type VI catchments, the CMB method is not applicable. The results also suggest that neither a chloride O/I ratio less than one nor a low
sea-Correspondence to:H. Guan ([email protected])
sonal fluctuation of streamflow chloride concentration (a fac-tor below 4) guarantees a chloride equilibrium condition in the study area. A large chloride O/I value (above one) and a large fluctuation of streamflow chloride concentration (a factor of 10 and above) generally indicates either a chloride disequilibrium, or cross-catchment water transfer, or both, for which the CMB method is not applicable. Based on re-gression between chloride O/I values and annual precipita-tion for type VI catchments, a catchment with annual pre-cipitation of 900 mm in MLR has most likely reached new chloride equilibrium, and the CMB method can be applied if no cross-catchment water transfer occurs. CMB is applied to one catchment at chloride equilibrium, suggesting a net groundwater recharge of 27 mm/yr, about 3% of annual pre-cipitation.
1 Introduction
Among the various approaches for estimating groundwater recharge, the chloride mass balance (CMB) method is one of the most frequently used, especially for arid and semiarid regions (Petheram et al., 2002; Scanlon et al., 2002; Wilson and Guan, 2004). The basic idea of the CMB method is that the atmospheric input of chloride in precipitation as well as dry deposition is concentrated in the residual soil water via evapotranspiration (ET) processes. By measuring chloride concentration in soil water, or the resulting groundwater, we can estimate the (potential, if soil chloride is used) recharge rate.
1997; Edmunds et al., 2002). In terms of spatial extent, the method can be applied in one dimension (1D), or be inte-grated over a catchment (Dettinger, 1989). When the CMB is based on chloride profiles in the unsaturated zone, one-dimensional piston flow is assumed. Wood (1999) identified three uncertainties when the 1D CMB method is applied. It is difficult to quantitatively determine the chloride input to the profile due to run-on and runoff processes; the method does not measure macropore-flow recharge if soil matrix chloride concentration is used; and it is sometimes difficult to evalu-ate whether or not the profile is in a chloride-flux steady stevalu-ate. When these problems are resolved, the 1D CMB method is a good tool for investigating the spatial variability of ground-water recharge (Cook et al., 1989).
In mountainous terrain, a major problem in calculating the 1-D chloride mass balance is the difficulty of determin-ing chloride inputs, because lateral runoff and interflow alter chloride input from atmospheric deposition. Although math-ematically, this run-on and runoff effect can be accounted for in the CMB equation (Wood, 1999), it relies on accurate esti-mation of runoff volume and chloride concentration in runoff water. Chloride concentration in runoff water is often several times larger than that in rain water. In an arid area, a tenfold difference was reported by Flint et al. (2002). Not account-ing for this runoff would introduce a large uncertainty in the CMB calculation results. Also, owing to high spatial vari-ability in precipitation, ET and soil characteristics, it is very difficult to estimate groundwater recharge over the catchment based on a few 1D chloride mass balance calculations. These problems can be resolved by applying the CMB method over the whole catchment, since chloride in runoff water is inte-grated and can be measured at the catchment stream outlet. Application of the CMB method over a catchment is com-monly used to estimate mountain front (or block) recharge (Wilson and Guan, 2004; Wahi et al., 2008; Ma et al., 2009). To distinguish this application of CMB from the 1D-based CMB, it is referred to as the catchment CMB method. The catchment CMB is the focus of this paper.
Due to the high temporal variability of both atmospheric water and chloride inputs, and retarded response of recharge and especially chloride in the resulting groundwater, the catchment CMB method is used to estimate the average recharge rate over several years or more. Short-term recharge fluctuations due to seasonality and inter-annual climate vari-ability are not discussed in this paper. One of the major as-sumptions of the catchment CMB method is that the ground-water recharge rate of the catchment is in equilibrium with near-surface and atmospheric conditions in terms of both wa-ter and chloride fluxes over the whole catchment. Additional assumptions can be found in Wood (1999). As previously discussed, an equilibrium condition in the 1D profile is also required for CMB applications. Only when the soil chloride profile is in equilibrium with historical surface and climate conditions, and has not been disturbed by recent changes, can the 1D CMB be applied to each part of the chloride
pro-file (Cook et al., 1992, Phillips 1994). After a surface condi-tion change (e.g., forest clearance), the time to reach a new chloride equilibrium varies from place to place in the catch-ment. A new catchment chloride equilibrium condition is reached only when a new equilibrium is attained in all parts of the catchment, but it is possible that the 1-D CMB can be applied to some areas of the catchment before the whole-catchment CMB method can be performed. However, be-cause of the above-mentioned difficulties, in particular those resulting from lateral water movements, few studies have at-tempted to apply the 1D CMB to mountain catchments.
When the catchment CMB method is applied, it is impor-tant and critical to check the equilibrium assumption, espe-cially in areas of significant land use change, such as the coastal and some inland areas of Australia. As in many other countries, coastal areas of Australia house a large portion of the population and economic activities. Quantification of wa-ter resources in these areas, including groundwawa-ter recharge, is critical for various aspects of economic and societal devel-opment. Mountainous and hilly terrains in Australian coastal areas enhance precipitation, providing a significant amount of water resources to the area. With increasing awareness of the impact of climate change on water supply, estimates of groundwater resources have become more urgent. Because of its simplicity, the CMB method is a common method of estimating recharge (Petheram et al., 2002), but two prob-lems need to be resolved. First, widespread native vegetation clearance for agriculture since European settlement about 150 years ago has changed the land surface boundary con-dition, posing the question as to whether the current system has reached a new chloride equilibrium condition. Another challenge is that the spatial variability of atmospheric chlo-ride input is large in coastal areas (Kayaalp, 2001), so re-liable estimates of atmospheric chloride inputs are difficult. The latter issue was recently addressed for the Mount Lofty Ranges (MLR) in South Australia (Guan et al., 2010). The focus of this present paper is to examine the first issue, i.e., whether MLR catchments have reached a new chloride equi-librium.
this paper, we examine catchment CMB applicability based on surface condition data. The method described indicates whether or not a catchment has reached a new post-clearance chloride equilibrium, a requirement for valid application of the catchment CMB method. It does not provide the trajecto-ries of catchment responses to forest clearance as modelling approaches do.
Catchment stream chloride (or salt) load changes after clearance, and will eventually reach a new equilibrium sta-tus. Examination of the catchment chloride budget may pro-vide valuable information for revealing the current catchment chloride equilibrium status (i.e., how far a system is from the new equilibrium). In addition to forest clearance, the ment chloride budget is also influenced by climate, catch-ment hydrology (e.g., gaining vs. losing streams) and cross-catchment water transfers. To make the cross-catchment chlo-ride budget useful for estimating catchment chlochlo-ride equi-librium status, these factors should be considered, but a con-ceptual framework which includes all processes that influ-ence the chloride budget is lacking in the literature. Climate is considered an important factor influencing post-clearance catchment chloride response (Jolly et al., 2001), but at-tempts to link climate and catchment chloride balance to es-timate catchment chloride equilibrium status have not been reported. The primary objectives of this study are (1) to conceptualize catchment chloride equilibrium conditions and their quantitative indicators, (2) to demonstrate how these conceptual models, combined with climate information, are useful in assessing whether a catchment has reached a new chloride equilibrium for the CMB application, (3) to identify catchments in a coastal hilly region of South Australia that are valid for CMB application, and (4) estimate catchment groundwater recharge for these catchments.
2 Catchment chloride balance and the conceptualisation
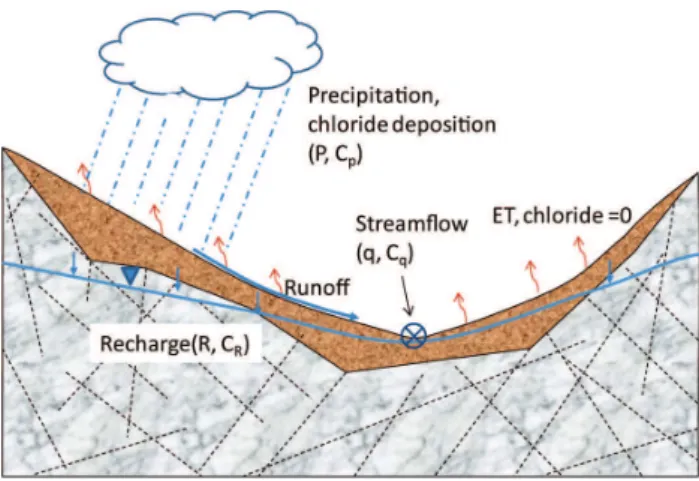
The hydrological processes that influence chloride mass bal-ance in a typical mountainous catchment are illustrated in Fig. 1. Atmospheric chloride is brought to the catchment by wet deposition with precipitation and dry deposition (Guan et al., 2010), and then transported by infiltrating and runoff water. Evapotranspiration concentrates chloride in the resid-ual water, but does not move it. Chloride is added to the groundwater by direct water-table recharge (Meinzer, 1923). Phreatophyte transpiration and capillary rise due to a shallow groundwater table (Dingman, 1994) concentrates chloride in groundwater, but these effects cannot be separated from other ET processes using chloride mass balance. Their effects are lumped together, and net water-table recharge refers to di-rect water-table recharge minus capillary rise and phreato-phyte transpiration. As vertical input of chloride is difficult to quantify due to lateral movement of chloride with runoff, it is difficult to estimate net water-table recharge using the
CMB approach. In a catchment with a losing stream, runoff chloride can be measured in the stream at the catchment out-let. For most situations, base flow also contributes water and chloride to the stream. Assuming that chloride concentration in the base flow is equal to that of net water-table recharge, the CMB can be written as
P·Cp=Rn·CR+q·Cq (1)
whereCp is chloride concentration in bulk precipitation,P
is precipitation in the catchment,CR is chloride
concentra-tion in net water-table recharge (generally, water near the water table is sampled to avoid chloride contamination from historical recharge or from regional recharge), and Rn is
the net water-table recharge minus base flow (referred to as net catchment recharge in this paper), q is the streamflow measured at the catchment outlet, andCq is chloride
con-centration of the stream water. This equation also applies to catchments where base flow is absent, where net catch-ment recharge is equal to net water-table recharge. In moun-tain terrain, net catchment recharge can be considered as the catchment contribution to the total mountain block recharge. For Eq. (1) to be applicable, groundwater recharge and chlo-ride flux should be in equilibrium with current surface and climate conditions. Under this situation, for a catchment without chloride sources and sinks, the ratio of the catchment chloride mass loss (output) through streamflow (O =q·Cq)
to total chloride mass input from atmospheric deposition (I =P·Cp), or the chloride O/I ratio, should be no more than
one. An equivalent O/I ratio for water is also used in this paper. The water O/I ratio is defined as the ratio of annual streamflow exporting water out of the catchment to annual precipitation bringing water into the catchment.
Fig. 1.A conceptual mountainous catchment showing hydrological processes involved in catchment chloride mass balance (modified from Dettinger 1989), whereP is precipitation,Cp is bulk chlo-ride concentration, ET is evapotranspiration,R is net water-table recharge (net water vertically added to the groundwater table from vadose zone),CR is the mean recharge groundwater chloride
con-centration,qis streamflow at the catchment outlet point, andCqis the streamflow mean chloride concentration. The upper zone of the cross section represents shallow colluvial type deposits, and while the lower zone represents fracture rock.
The feasibility of using chloride O/I ratios for determin-ing catchment chloride equilibrium status is demonstrated in the six conceptual catchments (Fig. 2). Two catchment types (I and II) represent chloride equilibrium conditions for which the CMB can be applied for estimating groundwater recharge, two (type III and IV) are in chloride equilibrium but contaminated by cross-catchment chloride transfer, and two (types V and VI) are non-equilibrium conditions, for which CMB is not applicable. These six conceptual catchments do not exhaust all possibilities. For example, cross-catchment water transfer can occur in chloride non-equilibrium catch-ments, and to catchments with a losing stream, not necessar-ily limited to type III and IV. Following similar conceptuali-sation, one may add more classes. We will discuss chloride balance and estimate chloride O/I ratios for each of the six conceptual catchment types. It should be noted that many of the chloride mass balance equations discussed here are used to illustrate and understand various components of catchment chloride balance, but are not suitable as a CMB method for calculating groundwater recharge because some components cannot be measured.
For a type I catchment (Fig. 2, panel I) , with a losing stream (average condition of the whole catchment, not neces-sarily the condition at the catchment outlet point), the catch-ment chloride mass balance is
P·Cp=R·CR+qe·Ce (2)
where CR is chloride concentration in net water-table
recharge R, qe is the event flow (quantitatively equal to
Fig. 2. Conceptualisation of catchment chloride balance under var-ious conditions:(I)Chloride steady state with a losing stream,(II)
Chloride steady state with a gaining stream,(III)Chloride steady state, with cross-catchment surface water transfer, (IV)Chloride steady state, with cross-catchment subsurface water transfer, (V)
Chloride non-steady state, in which historical soil chloride is pri-marily leached to groundwater, and(VI)Chloride non-steady state, in which historical soil chloride is leached to both surface water and groundwater. The losing and gaining streams are average sit-uations of the whole catchment, not necessarily the condition at the catchment outlet point. P is precipitation,R is direct ground-water recharge, qe is the event streamflow, qb is base flow from
direct-recharge groundwater,T is the cross-catchment water trans-fer,Rnis net groundwater recharge; average values are used across the whole catchment in units of mm. Clis for chloride deposition in mg m−2yr−1,Cis the chloride concentration (mg l−1) of vari-ous water flux indicated by the subscript, in whichCp (=Cl/P) is
the bulk precipitation chloride concentration. S is the re-mobile historical soil chloride leached into the stream and groundwater (mg m−2yr−1) over the whole catchment. OandI denote
chlo-ride being exported out of the catchment via streamflow measured at the outlet point, and chloride input from atmospheric deposition to the catchment, respectively.
streamflow in this case), and Ce is chloride concentration
For a type II catchment (Fig. 2, panel II), part or all of the groundwater recharge and its dissolved chloride returns to the surface, and is exported from the catchment. Chloride in stream water is derived from that in event flow and base flow,
q·Cq=qe·Ce+qb·Cb (3)
whereqbis the base flow, andCbis chloride concentration
of the base flow, other symbols are defined previously. Net catchment recharge is smaller than net water-table recharge, and can be estimated by Eq. (1) with an assumption that chlo-ride concentration in base flow is the same as that in the net water-table recharge. In a type II catchment, the chloride O/I ratio can be smaller than or equal to one.
Type III and type IV catchments (Fig. 2, panels III and IV) are those influenced by cross-catchment water transfer, with type III having surface water transfer, and type IV having subsurface water transfer. Chloride in the stream water is the sum of that from event flow, base flow, and cross-catchment transfer water,
q·Cq=qe·Ce+qb·Cb+T·CT (4)
whereT is cross-catchment transfer water flow, and CT is
chloride concentration in the cross-catchment transfer water. The chloride O/I ratio most likely exceeds one, depending on the relative amount of transferred water. The water O/I ratio of a type III or IV catchment is significantly larger than that of a type I or II catchment. Generally, the CMB method is not applicable to a type III or IV catchment. However, if the surface water transfer is quantified, net catchment ground-water recharge can be estimated for a type III catchment by Eq. (5), with assumption thatCbis equal toCR,
P·CP+T·CT =Rn·CR+q·Cq (5)
with symbols defined previously. In a type IV catchment, cross-catchment water and chloride inputs occur in the sub-surface. If these fluxes are located at depth and do not af-fect shallow groundwater and stream water, they can be ne-glected. The catchment can be regarded as a type II catch-ment. Otherwise, the CMB method is not applicable because
T is not known.
Type V and VI catchments (Fig. 2, panel V and VI) repre-sent post-clearance situations in which historical chloride ac-cumulated in the vadose zone under pre-clearance conditions is now released into groundwater and surface water. Catch-ment chloride balance is described by
P·CP+S=R·CR+qe·Ce (6)
whereSis remobilised historical soil chloride. For a type V catchment, base flow does not occur, the chloride O/I ratio is likely smaller than one because of low horizontal subsur-face flow bringing soil chloride into the stream. In a type VI catchment, base flow and horizontal subsurface flow de-liver historical chloride into the stream, and the chloride O/I
ratio is larger than one. As catchment chloride is not in equi-librium with current surface and atmospheric conditions in a type V or VI catchment, the CMB method is not applicable to either of them.
We examined these conceptual catchment types in relation to some published observations. Williamson et al. (1987) studied five catchments in southwest Western Australia over ten years (Table 1). Assuming that the forested catchments were in chloride equilibrium, and the cleared catchments were in disequilibrium after recent clearance, a type I con-dition can be ascribed to the Ernies catchment, a type II or IV condition to the Salmon catchment, a type VI condi-tion, probably with cross-catchment transfer (inferred from the large water O/I ratio) to the Wights catchment, and a type V condition to the Dons and Lemon catchments.
How are the conceptual catchment types and chloride O/I ratios used to determine CMB applicability? Generally, the CMB method is not valid for a catchment with a chloride O/I ratio larger than one. If cross-basin chloride transfer is ex-cluded, a chloride O/I ratio much greater than one is a good indicator of chloride non-equilibrium with current surface and atmospheric conditions. Since chloride O/I ratios can be below one for both equilibrium and non-equilibrium condi-tions, it is difficult to determine whether the CMB method applies to catchments having chloride O/I ratios less than one. In this situation, additional information, such as cli-mate, topography, catchment size, soil types and thickness, and aquifer properties may be helpful (Jolly et al., 2001; Dawes et al., 2004). Generally, it takes a longer time for catchments to reach a new chloride equilibrium in drier cli-mates (Jolly et al., 2001). Although factors such as vadose zone thickness may influence the time to equilibrium, the cli-mate condition gives a good first-order approximation. This climate-dependent catchment chloride response can be used to determine CMB applicability. For the three cleared catch-ments in Table 1, Wights was not in equilibrium, indicated by a chloride O/I ratio of 9.8 and the other two catchments (Dons and Lemon), with vegetation cleared at the same time as Wights, are not yet in steady state because they are drier than Wights.
3 Methodology
3.1 Study area and data
Table 1.Water and chloride ratios of five experimental catchments in (Williamson et al., 1987) and their corresponding chloride equilibrium types (The forest clearance occurred at the end of 1976. All quantities were measured during the data period).
Catchment Area km2 Data period Precipitation mm yr−1 Water O/I Cl O/I Type
Forested Salmon 0.82 1974–1983 1123 0.11 1.37 II or IV Ernies 2.70 1974–1983 738 0.02 0.09 I
Cleared
Wights 0.94 1977–1983 1027 0.31 9.79 VI Dons 3.50 1977–1983 721 0.02 0.14 V Lemon 3.44 1977–1983 737 0.03 0.22 V
Table 2.Eleven selected catchments in the Mount Lofty Ranges and related site information.
Catchment Gauge ID Easting m Northing m Data-period1 Area km2 Elevation2m Slope degree
1. Bremer at U/S 4 260 688 320 374 6 110 330 1998–2007 195 260 (67–534) 6 2. Western Flat Creek 4 261 018 303 709 6 116 027 2005–2006 33 382 (317–472) 5 3. Bremer at Bletchley 4 261 070 317 686 6 097 406 2005–2008 604 252 (28–534) 6 4. Finniss River 4261075 297 642 6 089 905 2005–2008 278 307 (102–481) 7 5. Currency Creek 4 261 099 296 277 6 074 320 2007–2008 76 215 (15–400) 6 6. Giles Creek 4 261 103 300 432 6 085 034 2007–2008 30 154 (30–372) 5 7. Onkaparinga at Houlgrave 5 030 504 292 589 6 115 458 2008/2009 334 412 (223–704) 7 8. Onkaparinga at Hahndorf 5 030 537 298 622 6 122 518 2003–2007 229 420 (295–615) 6 9. Pedler Creek 5 030 543 274 330 6 101 476 2001–2005 85 164 (40–405) 6 10. Torrens River at Mt. Pleasant 5 040 512 319 631 6 148 870 2006/2008 26 465 (413–543) 3 11. North Para River at Mt. McKenzie 5 050 533 323 834 6 172 797 1997–2007 44 440 (364–584) 4
1998–2007 indicates whole-year record from 1998 to 2007 (inclusive), and 2006/2008 indicates part-year record for the two endyears. This is elevation calculated from 25 m-DEM, with the first number being average elevation above sea level, and the two numbers in the brackets being the elevation range of the catchment.
to European settlement the whole area was covered by na-tive eucalyptus forest and woodland, and is assumed to have been in chloride equilibrium. Starting about 150 years ago, vegetation was cleared, primarily for agricultural and resi-dential use, and this continued until 1983 when government controls were instituted (Glanznig, 1995). Native vegetation coverage in the MLR is currently about 10% of that prior to European settlement. Historical vegetation clearance has dramatically altered surface conditions and disturbed the pre-clearance catchment chloride equilibrium.
Have the catchments reached new chloride equilibrium? This question needs to be answered before the CMB method is used to estimate groundwater recharge. Besides land use change, cross-catchment water transfer and reservoirs have modified local hydrology, including both water and chlo-ride balance. There are 15 reservoirs in the area, and three pipe lines convey water from the Murray River (Fig. 3) to the MLR, all of which add complexity to CMB applica-tions. To avoid this complexity, eleven catchments with-out upstream reservoirs were selected, one of which (catch-ment 7, Table 2) had a pipeline outlet which enabled ex-amination of the effect of cross-catchment water transfer on chloride balance. Daily streamflow and electrical conduc-tivity (EC) data for each catchment was downloaded (http:
//e-nrims.dwlbc.sa.gov.au/swa/) and summarized (Table 2). Maps (1 km resolution) of annual chloride deposition (Guan et al., 2010) and annual precipitation (Guan et al. 2009) were used to define spatial variability of water and chloride inputs. After the CMB applicability was tested, groundwater chlo-ride data (Radke et al., 2000; Green et al., 2007) were used to estimate groundwater recharge. Locations of these sam-ples are shown in Fig. 3. The majority of these data are from Radke et al. (2000), and some are from Green et al. (2007).
3.2 Chloride budget calculation
Fig. 3.The study area, left-hand side: digital elevation map showing the Mount Lofty Ranges (MLR), with stream water samples used to derive the relationship between chloride concentration and EC measurements (data from DWLBC and EPA), and right-hand side: eleven catchments of the MLR (the numbers correspond to those in Table 2), overlying the annual chloride deposition map with ground-water sample locations of chloride concentration for CMB applica-tion. Note that catchment 7 includes catchment 8, and catchment 3 includes catchment 1. The river to the east of MLR, flowing to the south, is the Murray River, which provides about 50% of water for the Adelaide metropolitan area via three main pipe lines through MLR (not shown). The inserts of Australia and South Australia maps are included to show regional location of the study area.
small. Since chloride concentrations in streamflow were not measured, 450 surface water analyses from the Department of Water, Land and Biodiversity Conservation (DWLBC), and the Environmental Protection Authority (EPA), of South Australia (Fig. 3) were used to develop an exponential re-lationship between chloride concentration and EC (Fig. 4). A similar function was obtained and applied to the Murray River and its tributaries (White et al., 2009), an area much larger than this study area.
3.3 Relating chloride equilibrium status with climate and surface conditions
How is a catchment chloride budget used to determine whether or not the CMB method applies? As both chlo-ride equilibrium (types I and II) and disequilibrium (type V) catchments can have a chloride O/I ratio below or equal to one, it is difficult to differentiate type V catchments from type I and II catchments using chloride O/I ratios only. Type VI catchments have chloride O/I ratios larger than one, which are easier to distinguish from type I and II catchments. They are distinguished from type III and IV catchments by the presence of known cross-catchment water transfer, or by their water O/I ratios, which are usually much higher than type V or VI catchments. Assuming that, under similar cli-mate conditions, type V catchments have similar chloride
Fig. 4. Measured chloride concentration of stream water vs. mea-sured electrical conductivity values, based on 306 samples by EPA mainly collected in May and October, and 145 samples by DWLBC collected in November, December, March, and July.
Fig. 5.Conceptualized evolution paths of type VI catchments start-ing from the forest clearance to type II catchments as a function of climate conditions, wherePi is mean annual precipitation; it in-creases fromP1toP5(extended from Fig. 2 in Jolly et al., 2001).
properties of the vadose zone, such as soil types and thick-ness, are associated with surface conditions such as climate and topography (Birkeland, 1999), and are thus related to the surface factors examined.
To demonstrate how surface conditions are used to esti-mate catchment chloride equilibrium status, imagine what happens to type II catchments after vegetation clearance, when they temporalily become type VI catchments. Because of different local climate conditions, these type VI catch-ments will undergo different evolution paths toward their new type II equilibrium status (Fig. 5). Catchment chloride O/I ratio is a good indicator of the chloride equilibrium sta-tus of type II/VI catchments. At a certain time point, chloride O/I ratios can be examined for all type VI catchments of var-ious climate conditions (Fig. 5). Although it is difficult to predict how long each of these catchments will take to reach new chloride equilibrium, it is possible to identify the condi-tions under which a catchment has currently reached chloride equilibrium. This is the information required before applying the CMB method to estimate groundwater recharge. Correla-tion analysis between chloride O/I ratio and climate variables (e.g. precipitation), as well as other selected variables (wa-ter O/I, streamflow, catchment area, elevation, and slope), were performed to find likely relationships between them. Regression between chloride O/I and significant correlated variable(s) was performed to obtain a prediction relationship. This relationship can then be used to examine chloride equi-librium status of a catchment which experienced similar for-est clearance history.
4 Results and discussion
4.1 Catchment chloride budget
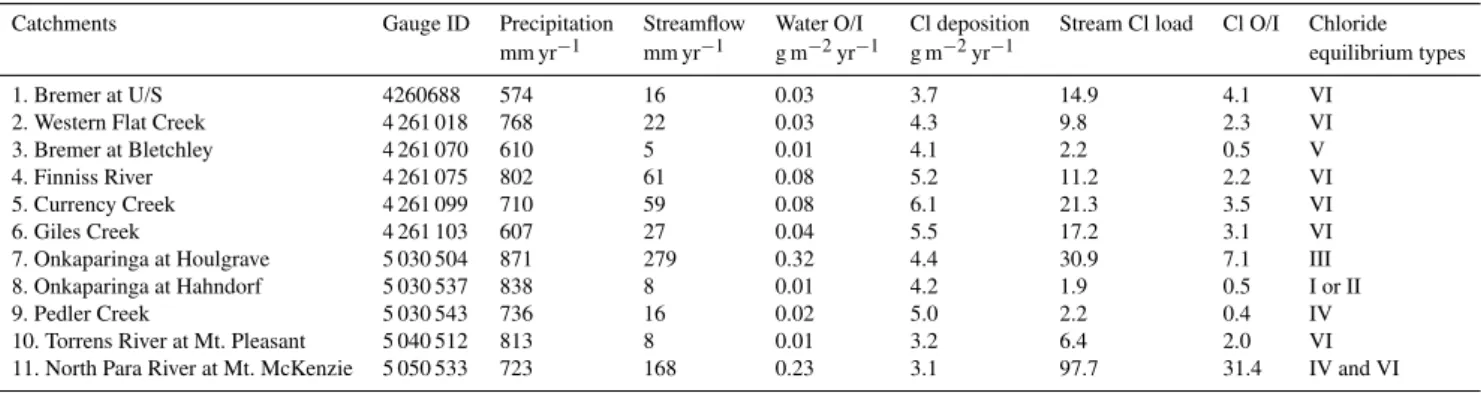
Water and chloride O/I ratios for the eleven catchments stud-ied are summarized in Table 3. Water O/I ratios are below 0.1 for 9 of the 11 catchments, with two exceptions. The ratio is 0.32 for the Onkaparinga catchment (catchment 7 in Ta-ble 3) above the stream gauge at Houlgrave. This high value is caused by the input of Murray-River water at an upstream location. The chloride O/I ratios is 7.1, indicating, based on our definitions in Fig. 2, that this is a type III catchment; further evidence is discussed later. Another exception is the North Para River catchment (11 in Table 3) with a stream gauge at Mt. McKenzie. The water O/I ratio for this catch-ment is 0.23, with an abnormally high chloride O/I ratio of 31.4. Monthly hydrograph and stream chloride concentra-tion are shown in Fig. 6a. Neither cross-catchment surface water transfers nor industrial water effluents are present. The monthly hydrograph shows peak flow occurring in rainy sea-sons, so it is likely that cross-catchment groundwater trans-fer occurs. The abnormally high chloride O/I ratio indicates a chloride disequilibrium condition, a conclusion supported by large fluctuations of stream water chloride concentrations which range from below 200 mg l−1during the event flow to about 4000 mg l−1 at the beginning of rainy seasons. This catchment is possibly a combination of types VI and IV. Ex-cept for these two, six of the remaining nine catchments (1, 2, 4, 5, 6, and 10 in Table 3) have chloride O/I ratios ranging from 2 to 4. They are most likely type VI catchments. An example of a type VI hydrograph and stream chloride con-centrations is shown in Fig. 6b for the Bremer catchment (1 in Table 3). It has a large stream water chloride concentra-tion range (from 300 to 3700 mg l−1), similar to the North Para River catchment, which is good evidence of a type VI catchment.
Table 3.Atmospheric input and streamflow output of water and chloride of the eleven catchments and their possible corresponding chloride equilibrium status (The precipitation and chloride deposition data were calculated from the long-term average distribution maps, while streamflow and its chloride load was calculated from the observation period listed in Table 2).
Catchments Gauge ID Precipitation Streamflow Water O/I Cl deposition Stream Cl load Cl O/I Chloride mm yr−1 mm yr−1 g m−2yr−1 g m−2yr−1 equilibrium types
1. Bremer at U/S 4260688 574 16 0.03 3.7 14.9 4.1 VI
2. Western Flat Creek 4 261 018 768 22 0.03 4.3 9.8 2.3 VI
3. Bremer at Bletchley 4 261 070 610 5 0.01 4.1 2.2 0.5 V
4. Finniss River 4 261 075 802 61 0.08 5.2 11.2 2.2 VI
5. Currency Creek 4 261 099 710 59 0.08 6.1 21.3 3.5 VI
6. Giles Creek 4 261 103 607 27 0.04 5.5 17.2 3.1 VI
7. Onkaparinga at Houlgrave 5 030 504 871 279 0.32 4.4 30.9 7.1 III 8. Onkaparinga at Hahndorf 5 030 537 838 8 0.01 4.2 1.9 0.5 I or II
9. Pedler Creek 5 030 543 736 16 0.02 5.0 2.2 0.4 IV
10. Torrens River at Mt. Pleasant 5 040 512 813 8 0.01 3.2 6.4 2.0 VI 11. North Para River at Mt. McKenzie 5 050 533 723 168 0.23 3.1 97.7 31.4 IV and VI
this catchment can be regarded as a type I catchment. This is supported by the low water O/I ratio (Table 3). For catch-ment 9, it is difficult to determine the chloride equilibrium condition solely from the chloride O/I ratio. The stream is ephemeral, only flowing three to four months during raining seasons. Chloride concentrations in stream water are below 400 mg l−1(not shown). The incorporation of climate condi-tions in the determination of the chloride equilibrium status of catchment 9 is discussed in the next section.
4.2 Chloride equilibrium status in relation to precipitation
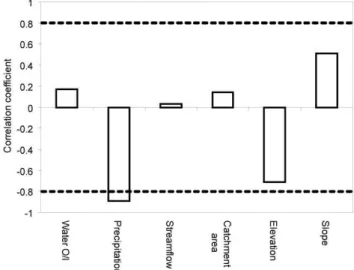
For the six type VI catchments (Table 3), correlations be-tween chloride O/I and climate (precipitation), hydrology (water O/I, streamflow), and catchment geometry (area, ele-vation, and slope) variables were determined (Fig. 7). Of the six variables, only mean annual precipitation is significantly correlated with chloride O/I ratio, with a Pearson correlation coefficient of 0.89. This correlation is statistically significant at a confidence level of 98% (pvalue = 0.017). The high cor-relation between chloride O/I and precipitation supports the assumption that aquifer properties do not account for catch-ment chloride O/I variability in the study area. Regression of chloride O/I ratios on mean annual precipitation for the six type VI catchments (Fig. 8a suggests that the chloride O/I ratio decreases with annual precipitation, which is consistent with the conceptual model shown in Fig. 5. For compari-son, plots of cumulative stream chloride load vs. cumulative streamflow (Fig. 8b) show that stream chloride concentration inferred from slopes of the curves generally decrease with annual precipitation for the six type VI catchments. If a chlo-ride O/I ratio of one approximates a new chlochlo-ride equilib-rium condition then a catchment with annual precipitation of 960 mm has by now reached a new equilibrium. As the for-est clearance occurred in the MLR area 100–150 years ago, this regression result indicates that it takes less than 100–150
years for a catchment of 960 mm annual rainfall to reach a new chloride equilibrium.
These results suggest that in the MLR area, catchments having an annual precipitation larger than 960 mm had reached a new chloride equilibrium by 2008, when stream data were collected. A catchment having annual precipitation much smaller than 960 mm is still in chloride disequilibrium, because the chloride O/I ratio predicted using the regression function in Fig. 8a is larger than one. This is consistent with earlier discussion regarding chloride equilibrium status of catchments 1 (type VI, annual precipitation 574 mm), 2 (VI, 768 mm), 3 (V, 610 mm), 4 (VI, 802 mm), 5 (VI, 710 mm), 6 (VI, 610 mm), and 10 (VI, 813 mm) (Table 3). According to this annual precipitation threshold, Pedler Creek (catchment 9, annual precipitation 736 mm) is in chloride disequilibrium and is currently a type V catchment. As the threshold of 960 mm annual precipitation was derived from type VI catch-ments, it accounts for the time required to transport historical chloride in the vadose zone and in shallow groundwater into the stream. It is likely that a catchment with an annual precip-itation slightly below 960 mm has reached a new equilibrium. The Onkaparinga at Hahndorf (catchment 8, 838 mm) is one such example. The Onkaparinga at Houlgrave (catchment 7, 871 mm) should have reached new chloride equilibrium, supporting the earlier conclusion that it is a type III catch-ment. In summary, a catchment in the MLR area having an annual precipitation around 900 mm has most likely reached new chloride equilibrium.
4.3 CMB method estimated groundwater recharge
Fig. 6. Monthly series of streamflow and water-weighted aver-age monthly chloride concentration in stream water for four se-lected catchments: (a) North Para River catchment with gauge ID 5050533, (b)Bremer catchment with gauge ID 4260688, (c)
Bremer catchment with gauge ID 4261070, and(d)Onkaparinga at Hahndorf catchment with gauge ID 5030537.
Fig. 7. Pearson correlation coefficient between chloride O/I and each of the six selected climate and catchment variables for all type VI catchments (Table 3). The dash lines are statistically significant linear correlation at 95% confidence level, showing that only pre-cipitation is significantly correlated to chloride O/I ratios.
Fig. 8. (a)Catchment chloride ratio vs. catchment average annual precipitation for all type VI catchments, indicating that a catchment of an average precipitation of 960 mm.yr−1would have now (2008)
reached the new chloride equilibrium (type II).(b)Cumulative chlo-ride load in the stream water vs. cumulative streamflow for six type VI catchments, showing that the average chloride concentration (the slope of the curve) decreases with increasing annual precipitation (the number in the legend), with two type V catchments and one chloride equilibrium catchment for comparison.
If an average chloride concentration of 85 mg l−1is used for currently recharged groundwater, the net catchment recharge is estimated to be 27 mm/year, about 3% of an-nual precipitation. The uncertainty of this estimate originates from estimates of catchment chloride deposition as well as average chloride concentration of the recent recharge. The former is estimated to be about 20% at a 90% confidence level (Guan et al., 2010). For the latter source of uncertainty, if three estimates (76, 96, and 89 mg l−1) are assumed from a normal distribution, the uncertainty from the catchment chlo-ride concentration estimates is less than 20% at a 90% confi-dence level.
Fig. 9. Three methods to estimate average chloride concentration of recent net water-table recharge for catchment 8: (a)histogram of observed groundwater chloride concentration data, (b) tritium vs. groundwater chloride concentration, and(c)the score of second principal component (PC2) of the concentration data of eight major ions, vs. sample chloride concentration. In (a), data points to the left of the mode (125 mg l−1) are selected to calculate the geometric
5 Conclusions
To examine the CMB applicability for groundwater recharge estimates in the MLR, an area having experienced widespread historical vegetation clearance, the catchment chloride budget was investigated based on a recently con-structed atmospheric chloride deposition map. Six concep-tual catchments representing various chloride equilibrium levels were defined, based on conditions that might be en-countered in the MLR region. The conceptual models were applied to eleven selected catchments of various sizes and climate conditions. The results show that six of the eleven catchments match type VI chloride equilibrium condition (chloride disequilibrium with a gaining stream), with catch-ment chloride O/I ratios ranging from 2 to 4. Two catchcatch-ments match a type V chloride equilibrium condition (chloride dise-quilibrium with a losing stream) with catchment chloride O/I ratios of about 0.5. For these catchments, the CMB method is not appropriate. The results also suggest that neither a chlo-ride O/I ratio less than one nor a low fluctuation of stream-flow chloride concentration (a factor below 4) guarantees a chloride equilibrium condition. A large chloride O/I ratio (above one) and a large fluctuation of streamflow chloride concentration fluctuation (a factor of 10 and above) generally indicate either chloride disequilibrium or cross-catchment water transfer, or both, for which CMB is not applicable. Based on the regression between chloride O/I ratios and an-nual precipitation of type VI catchments, a catchment with annual precipitation around 900 mm in the MLR has most likely reached new chloride equilibrium, for which the CMB can be applied assuming that no cross-catchment water trans-fer occurs. The CMB was applied to one catchment at chlo-ride equilibrium, resulting in an estimate of net catchment groundwater recharge of 27 mm, or about 3% of annual pre-cipitation.
Acknowledgements. Discussion with Peter Cook and Ian Jolly is appreciated. Graham Green from the Department of Water, Land and Biodiversity Conservation of South Australia provided streamflow and EC data. Peter Goonan from the Environmental Protection Authority of South Australia provided stream water chemistry data.
Edited by: J. Carrera
References
Birkeland, P. W.: Soils and Geomorphology. Oxford University Press, New York, 430 pp., 1999.
Cook, P. G., Edmunds, W. M., and Gaye, C. B.: Estimating paleo-recharge and paleoclimate from unsaturated zone profiles. Water Resour. Res., 28(10), 2721–2731, 1992.
Cook, P. G., Walker, G. R., and Jolly, I. D.: Spatial variability of groundwater recharge in a semiarid region, J. Hydrol., 111(1–4), 195–212, 1989.
Dawes, W. R., Gilfedder, M., Walker, G. R., and Evans, W. R.: Bio-physical modelling of catchment-scale surface water and ground-water response to land-use change, Math. Comput. Simul., 64(1), 3–12, 2004.
Dettinger, M. D.: Reconnaissance estimates of natural recharge to desert basins in Neveda, USA, by using chloride-balance calcu-lations, J. Hydrol., 106(1–2), 55–78, 1989.
Ding, Z., Guan, H., Hutson, J., Love, A. J., and Simmons, C. T.: Examination of forest clearance induced dynamic hydrochemi-cal response using principal component analysis, J. Hydrol., in review, 2010.
Dingman, S. L.: Physical Hydrology. Prentice-Hall, Inc., 575 pp., 1994.
Edmunds, W. M., Fellman, E., Goni, I. B., and Prudhomme, C.: Spatial and temporal distribution of groundwater recharge in northern Nigeria, Hydrogeol. J., 10(1), 205–215, 2002.
Eriksson, E. and Khunakasem, V.: Chloride concentrations in groundwater, recharge rate and rate of deposition of chloride in the Israel coastal plain, J. Hydrol., 7, 178–197, 1969.
Flint, A. L., Flint, L. E., Kwicklis, E. M., Fabryka-Martin, J. T., and Bodvarsson, G. S.: Estimating recharge at Yucca Mountain, Nevada, USA: comparison of methods, Hydrogeol. J., 10, 180– 204, 2002.
Gilfedder, M., Walker, G. R., Dawes, W. R., and Stenson, M. P.: Prioritisation approach for estimating the biophysical impacts of land-use change on stream flow and salt export at a catchment scale, Environ. Modell. Softw., 24, 262–269, 2009.
Glanznig, A.: Native vegetation clearance, habitat loss and biodi-versity decline, Australian Government Department of the Envi-ronment, Water, Heritage and the Arts, 1995.
Green, G., Banks, E., Wilson, T., and Love, A.: Groundwater recharge and flow investigations in the Western Mount Lofty Ranges, South Australia, Adelaide, 2007.
Guan, H., Simmons, C. T. and Love, A. J.: Orographic controls on rain water isotope distribution in the Mount Lofty Ranges of South Australia, J. Hydrol., 372, 255–264, doi:10.1016/j.jhydrol 2009.06.018, 2009.
Guan, H., Love, A. J., Simmons, C. T. and Kayaalp, A. S.: Factors influencing chloride deposition in a coastal hilly area and appli-cation to chloride deposition mapping, Hydrol. Earth Syst. Sci., accepted, 2010.
Jolly, I., Walker, G., Stace, P., Van der Wel, B., and Leaney, R.: As-sessing the impacts of dryland salinity on South Australia’s wa-ter resources 9/00, CSIRO Land and Wawa-ter, Adelaide, Australia, 2000.
Jolly, I. D., Williamson, D. R., Gilfedder, M., et al.: Historical stream salinity trends and catchment salt balances in the Murray-Darling Basin, Australia, Mar. Freshw. Res., 52(1), 53–63, 2001. Kayaalp, A. S.: Application of rainfall chemistry and isotope data to hydro-meteorological modelling, Ph.D. Thesis, Flinders Uni-versity, Adelaide, Australia, 273 pp., 2001.
Kayaalp, A. S. and Bye, J. A. T.: The water and salt balance of the reservoir catchments of the Mount Lofty Ranges, South Aus-tralia, Trans. R. Soc. S. Aust., 127, 15–26, 2003.
moun-tain front, J. Hydrol., 364(1–2), 128–141, 2009.
Meinzer, O. E.: Outline of ground-water hydrology with definitions. U.S. Geological Survey Water Supply Paper 494, 1923. Peck, A. J. and Hatton, T.: Salinity and the discharge of salts from
catchments in Australia, J. Hydrol., 272(1–4), 191–202, 2003. Peck, A. J. and Hurle, D. H.: Chloride balance of some farmed
and forested catchments in southwestern Australia, Water Re-sour. Res., 9(3), 648–657, 1973.
Petheram, C., Walker, G., Grayson, R., Thierfelder, T. and Zhang, L.: Towards a framework for predicting impacts of land-use on recharge: 1. A review of recharge studies in Australia. Australian Journal of Soil Research, 40(??), 397-417, 2002.
Phillips, F. M.: Environmental tracers for water movement in desert soils of the American southwest, Soil Sci. Soc. Am. J., 58(1), 15–24, 1994.
Poulsen, D. L., Simmons, C. T., La Salle, C. L., and Cox, J. W.: Assessing catchment-scale spatial and temporal patterns of groundwater and stream salinity. Hydrogeol. J., 14(7), 1339– 1359, 2006.
Preiss, W. V.: The Adelaide Geosyncline: Late proterozoic stratigraphy, sedimentation, palaeontology and tectonics, Bul-letin/Geological Survey of South Australia, 53, p. 439, 1987. Radke, B. M., Ivkovic, K. M., Watkins, K. L., Cresswell, R. G., and
Bauld, J.: A groundwater quality assessment of the upper Onka-paringa Region, Southern Mt Lofty Ranges, South Australia, 107 pp., 2000.
Scanlon, B. R. and Goldsmith, R. S.: Field study of spatial vari-ability in unsaturated flow beneath and adjacent to playas. Water Resour. Res., 33(10), 2239–2252, 1997.
Scanlon, B. R., Healy, R. W., and Cook, P. G.: Choosing appropriate techniques for quantifying groundwater recharge, Hydrogeol. J., 10(1), 18–39, 2002.
Sivapalan, M., Ruprecht, J. K. and Viney, N. R.: Water and salt balance modelling to predict the effects of land-use changes in forested catchments .1. Small catchment water balance model, Hydrol. Proc., 10(3): 393–411, 1996.
Smitt, C., Gilfedder, M., Dawes, W., Petheram, C., and Walker, G.: Modelling the Effectiveness of Recharge Reduction for Salinity Managment: Sensitivity to Catchment Characteristics, Canberra, Australia, 16 pp., 2003.
Wahi, A. K., Hogan, J. F., Ekwurzel, B., Baillie, M. N., and Eastoe, C.J.: Geochemical quantification of semiarid mountain recharge, Ground Water, 46(3), 414–425, 2008.
Walker, G. R., Jolley, I. D., and Cook, P. G.: A new chloride leach-ing approach to the estimation of diffuse recharge followleach-ing a change in land use, J. Hydrol., 128, 49–67, 1991.
White, I., Macdonald, B. C. T., Somerville, P. D., and Wasson, R.: Evaluation of salt sources and loads in the upland areas of the Murray-Darling Basin, Australia, Hydrol. Process., 23(17), 2485–2495, 2009.
Williamson, D. R., Stokes, R. A. and Ruprecht, J. K.: Response of input and output of water and chloride to clearing for agriculture, J. Hydrol., 94(1–2), 1–28, 1987.
Williamson, D. R. and van de Wel, B.: Quantification of the impact of dryland salinity on water resources in the Mt Lofty Ranges, SA, The Institution of Engineers Australia, Perth, Australia, 48– 52, 1991.
Wilson, J.L. and Guan, H.: Mountain-block hydrology and mountain-front recharge, in: Groundwater Recharge in a Desert Environment: The Southwestern United States, edited by: J. F. Hogan, Phillips, F. M., and Scanlon, B. R., Water Science and Applications Series, American Geophysical Union, Washington, DC, USA, 113–137, 2004.
Wood, W. W.: Use and misuse of the chloride-mass balance method in estimating ground water recharge, Ground Water, 37(1), 2–3, 1999.