www.hydrol-earth-syst-sci.net/21/281/2017/ doi:10.5194/hess-21-281-2017
© Author(s) 2017. CC Attribution 3.0 License.
On the non-stationarity of hydrological response in
anthropogenically unaffected catchments:
an Australian perspective
Hoori Ajami1,2, Ashish Sharma1, Lawrence E. Band3, Jason P. Evans4, Narendra K. Tuteja5, Gnanathikkam E. Amirthanathan6, and Mohammed A. Bari7
1School of Civil and Environmental Engineering, University of New South Wales, Sydney, Australia 2Department of Environmental Sciences, University of California Riverside, Riverside, CA, USA
3Department of Geography and Institute for the Environment, University of North Carolina, Chapel Hill, NC, USA 4Climate Change Research Centre, University of New South Wales, Sydney, Australia
5Environment and Research Division, Bureau of Meteorology, Canberra, Australian Capital Territory, Australia 6Environment and Research Division, Bureau of Meteorology, Melbourne, Victoria, Australia
7Environment and Research Division, Bureau of Meteorology, Perth, Western Australia, Australia
Correspondence to:Hoori Ajami ([email protected])
Received: 16 July 2016 – Published in Hydrol. Earth Syst. Sci. Discuss.: 29 July 2016 Revised: 14 December 2016 – Accepted: 16 December 2016 – Published: 12 January 2017
Abstract. Increases in greenhouse gas concentrations are expected to impact the terrestrial hydrologic cycle through changes in radiative forcings and plant physiological and structural responses. Here, we investigate the nature and fre-quency of non-stationary hydrological response as evidenced through water balance studies over 166 anthropogenically unaffected catchments in Australia. Non-stationarity of hy-drologic response is investigated through analysis of long-term trend in annual runoff ratio (1984–2005). Results indi-cate that a significant trend (p< 0.01) in runoff ratio is evi-dent in 20 catchments located in three main ecoregions of the continent. Runoff ratio decreased across the catchments with non-stationary hydrologic response with the exception of one catchment in northern Australia. Annual runoff ratio sensi-tivity to annual fractional vegetation cover was similar to or greater than sensitivity to annual precipitation in most of the catchments with non-stationary hydrologic response indicat-ing vegetation impacts on streamflow. We use precipitation– productivity relationships as the first-order control for eco-hydrologic catchment classification. A total of 12 out of 20 catchments present a positive precipitation–productivity re-lationship possibly enhanced by CO2fertilization effect. In
the remaining catchments, biogeochemical and edaphic fac-tors may be impacting productivity. Results suggest
vegeta-tion dynamics should be considered in exploring causes of non-stationary hydrologic response.
1 Introduction
Increases in atmospheric CO2 concentration are impacting
the terrestrial water cycle through changes in radiative forc-ings (affecting precipitation and temperature) as well as plant physiological and structural responses (Betts et al., 2007; Wigley and Jones, 1985). As a result, projections of future changes in water resources become complicated due to the tight coupling between the terrestrial biosphere and hydro-logic cycle (Band et al., 1996; Baron et al., 2000; Gedney et al., 2006; Ivanov et al., 2008). There is a growing body of evidence showing that increases in CO2 often lead to
com-pensated by increases in plant productivity and changes in ecosystem structure in terms of increases in LAI and changes in species composition (Kergoat et al., 2002). Due to this “compensatory response”, the impact of elevated CO2 on
catchment-scale water balance is uncertain and expected to vary from region to region (Field et al., 1995; Kergoat et al., 2002). Moreover, terrestrial vegetation productivity is often limited by availability of nutrients, mostly nitrogen and phos-phorous (Vitousek and Howarth, 1991) and light (Huxman et al., 2004; Schurr, 2003), which further increases uncer-tainty of projecting terrestrial ecosystem response to climate change (Wieder, 2014).
Understanding spatial and temporal variability of catchment-scale water yield in relation to precipitation variability and ecosystem productivity is challenging, as it requires long-term observational records from unimpaired catchments. A plethora of modeling studies have been performed to predict the climate change impacts on veg-etation productivity (Kergoat et al., 2002; Leuzinger and Körner, 2010) and global runoff (Betts et al., 2007; Piao et al., 2007). However, projections depend on the underlying model assumptions and structure, process representation and scale of application (Medlyn et al., 2011). Similarly, assessing climate elasticity of streamflow has shown that the degree of sensitivity of streamflow to various factors depends on the model structure and calibration approach (Sankarasubramanian et al., 2001).
Here, we investigate the nature and frequency of non-stationary hydrologic response as evidenced through wa-ter balance studies over 166 anthropogenically unaffected catchments in Australia. Our assessment assumes the non-stationarity to manifest itself through the annual water bal-ance, and more specifically, through the annual runoff ratio (Q / P). Our primary objective is to investigate whether there is evidence for such non-stationarity in the runoff ratio, and if there is, what could explain its existence.
Non-stationarity of runoff ratio is caused by complex in-teractions between precipitation, climate variability, plant physiological and structural responses to elevated CO2
(Leuzinger and Körner, 2010; Chiew et al., 2014) and land-scape characteristics (soil and topography) of a catchment. The question is whether patterns of similarities and differ-ences across space and time exist as a result of these in-teractions to provide a framework for hydrologic prediction (Sivapalan et al., 2011). Instead of assuming vegetation as a static component of the hydrologic system (Ivanov et al., 2008), catchment-scale vegetation dynamics will be an inte-gral component of this classification framework. Therefore, our secondary objective is to formulate a catchment classifi-cation framework based on catchment-scale ecohydrologic response. This first-order grouping of catchments helps to generalize catchment behavior in terms of changes in runoff ratio and vegetation productivity due to changes in precipi-tation. Previous catchment classification efforts have mostly considered hydrologic signatures related to precipitation,
temperature and streamflow (Sawicz et al., 2011; Wagener et al., 2007). Sawicz et al. (2014) illustrated that changes in cli-mate characteristics of catchments can mostly explain hydro-logic change which was characterized by changes in group-ings of 314 catchments in the USA. Due to the lack of in-formation, temporal changes in land use were not considered in characterizing hydrologic change in this approach. We ar-gue that, in the context of climate change and to improve hydrologic prediction under change (Sivapalan et al., 2011), developing a catchment classification framework that incor-porates the role of vegetation dynamics on catchment-scale water partitioning is required. This framework can inform fu-ture modeling experiments for determining the relative im-portance of contributing factors to non-stationary catchment response.
An assessment of the non-stationarity of the runoff ratio across 166 anthropogenically unaffected catchments in Aus-tralia is presented next using long-term ground- and satellite-based observational records.
2 Data and methods 2.1 Data
Daily stream discharge data are obtained from the Aus-tralian network of hydrologic reference stations (HRSs) that consists of 221 gauging stations (http://www.bom.gov.au/ water/hrs/). Out of 221 catchments, 166 catchments have complete daily discharge time series covering the 1979– 2010 period and these are the catchments used in the study (Fig. 1). The anthropogenically unaffected catchments cover a range of spatial scales with their areas ranging from 6.6 to 232 846 km2. Catchment-averaged daily precipitation, ac-tual and potential evapotranspiration, and temperature are obtained from the Australian Water Availability Project (AWAP) gridded time series products at 0.05◦
resolution (Raupach et al., 2009, 2012). AWAP potential evapotran-spiration is calculated based on the Priestley–Taylor equa-tion (Raupach et al., 2009). The monthly fracequa-tion of pho-tosynthetically active radiation (fPAR) absorbed by vegeta-tion is obtained from Donohue et al. (2008) at 0.08◦
res-olution for the 1984–2010 period. Total fPAR (Ftot)values
are approximately related to fractional vegetation cover and range between 0.0 (no vegetation cover) and 0.95 (maximum vegetation cover). The monthlyFtotdataset version 5 is
de-rived from the Advanced Very High Resolution Radiometer (AVHRR) sensor, andFtot values were used as a measure
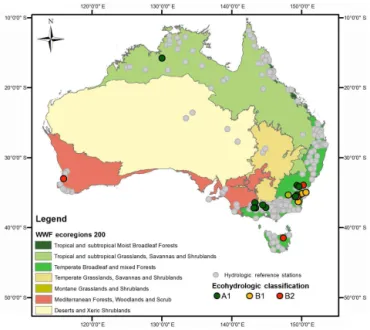
Figure 1.Distribution of hydrologic reference stations across Aus-tralia. Colored circles represent catchments with a significant trend in annual runoff ratio. Colors represent catchment grouping based on the classification framework of Fig. 6. The catchments with non-stationary hydrologic response span over three significant ecore-gions of the continent. Ecoregion boundaries are from the World Wildlife Fund (http://maps.tnc.org/gis_data.html).
2.2 Methods
We used ground- and satellite-based observations to de-tect and investigate causes of non-stationarity of runoff ra-tio across HRS catchments. Our methodology consists of (1) detecting trends in annual runoff ratio, fractional vege-tation cover, annual precipivege-tation and precipivege-tation season-ality indices at a catchment scale; (2) assessing long-term (27 years) water balance patterns across all catchments with non-stationary hydrologic response using hydrologic indices such as the Horton index (Troch et al., 2009); (3) exploring annual runoff ratio’s sensitivities to water balance compo-nents and fractional vegetation cover at an individual catch-ment scale; and (4) formulating an ecohydrologic catchcatch-ment classification framework.
2.2.1 Non-parametric trend analysis to detect non-stationarity
The modified Mann–Kendall non-parametric test (Hamed and Rao, 1998; Kendall, 1970; Mann, 1945) that accounts for serial autocorrelation in the time series is performed to detect significant trends in annual runoff ratio at a 0.01 sig-nificance level across the 166 HRS catchments. The first and last 5 years of data are removed from the record to reduce the impact of edge effect for trend analysis (1984–2005). Simi-lar trend analysis is performed for annual precipitation and average fractional vegetation cover of each catchment.
Changes in precipitation seasonality across catchments with non-stationary hydrologic response are explored by as-sessing the trends in two measures of precipitation season-ality: the seasonality index (SI) (Walsh and Lawler, 1981) and days of a year at which the 10th, 25th, 50th, 75th and 90th percentiles of annual precipitation are reached (Pryor and Schoof, 2008). The SI is calculated based on monthly precipitation values (Walsh and Lawler, 1981):
SI= 1
P
X12 n=1
Xn−
P
12
, (1)
whereP is annual precipitation andXnis monthly total pre-cipitation in monthn.
2.2.2 Hydrologic similarity across catchments with non-stationary hydrologic response
Similarity of ecohydrologic response across all catchments with non-stationary response is explored by examining the overall relationships of long-term mean (1984–2010) annual fractional vegetation cover with annual runoff ratio, precipi-tation and the Horton index (Troch et al., 2009). The Horton index, the ratio of evapotranspiration to catchment wetting, presents efficiency of catchments in using plant available wa-ter and is reflective of wawa-ter and energy availability in the catchment. The Horton index ranges between 0 and 1, and incorporates the role of soil and topography in the catchment wetting (Brooks et al., 2011; Troch et al., 2009; Voepel et al., 2011). To estimate catchment-averaged ET and wetting, the water balance equation (dS /dt=P−Q−ET) is used assuming that changes in annual storage (dS /dt) are zero:
ET=P−Q (2)
W=P−S, (3)
whereP is annual precipitation,Qis the total stream dis-charge, ET is annual actual evapotranspiration,W is catch-ment wetting andS is the quick flow component of stream discharge. A one-parameter recursive filter of Lyne and Hol-lick (1979) for baseflow separation is used to estimate quick flow and baseflow components of daily discharge:
bk=abk−1+
1−a
2 (Qk+Qk−1) (4)
S=Q−bk, (5)
2.2.3 Normalized sensitivities of annual runoff ratio to changes in water balance and vegetation
Sensitivities of annual runoff ratio to inter-annual variabil-ity of precipitation, ET and fractional vegetation cover in the 1984–2010 period are computed to identify factors that exert the largest sensitivity on annual runoff ratio. Normalized sen-sitivity of annual runoff ratio to precipitation is computed by estimating the slope of a linear regression between runoff ra-tio and precipitara-tion, and multiplying it by the rara-tio of mean precipitation to runoff ratio (Fatichi and Ivanov, 2014; Hsu et al., 2012). Similarly, normalized sensitivity of runoff ratio to water balance ET and annual fractional vegetation cover is also computed. Normalized sensitivity of annual runoff ratio is equivalent to the streamflow elasticity approach of Zheng et al. (2009) that defined streamflow elasticity as the linear regression coefficient between the proportional changes in streamflow and a climatic variable (precipitation or potential evapotranspiration). Results of these analyses are used as the basis for formulating an ecohydrologic catchment classifica-tion.
3 Results
3.1 Non-stationary hydrologic response
Results of the modified Mann–Kendall trend test across 166 catchments indicate that 20 catchments (with areas that range between 18.7 and 5158.3 km2; Table 1) have
sig-nificant decreasing trends in annual runoff ratio (p< 0.01) except for the East Baines River in northern Australia (Fig. 1). An increasing trend for runoff ratio in the East Baines River (0.009 yr−1) is consistent with annual
pre-cipitation increases (13.2 mm yr−1). Moreover, this
catch-ment has the smallest fractional vegetation cover (0.26) amongst the catchments with non-stationary hydrologic re-sponse. The North Esk catchment in Tasmania is the only catchment amongst the catchments with non-stationary re-sponse in which runoff ratio declined despite increases in annual precipitation (6.4 mm yr−1) (Table 1). In the
Tasma-nian catchment, the increasing trend in fractional vegetation cover (0.009 yr−1) is significant and results in ET increase
and subsequently lower runoff ratio during the 1984–2005 period. In the rest of the catchments with non-stationary hy-drologic response, total annual precipitation decreased be-tween −1.9 and −24.7 mm yr−1 in the 1984–2005 period,
which is consistent with the decreasing trend in annual runoff ratio (−0.0008 to−0.016 yr−1). However, most catchments
present an increasing trend in annual fractional vegetation cover, with the exception of three catchments in the eastern Australia temperate forests (410705, 410761 and 412066). Trees are the dominant vegetation cover in all the catch-ments with non-stationary hydrologic response, except for the Avoca River at Coonooer (408200) and Mollison Creek
(405238) catchments in Victoria in which grasslands are dominant (Supplement Table S1). The question is the follow-ing: what causes the increasing trends in annual fractional vegetation cover despite decreasing trends in annual precipi-tation of these catchments?
Based on the mean seasonality index using data from 1984 to 2010, only two catchments exhibit a seasonal cli-mate (0.6 < SI < 0.8) (Table S2). However, all catchments have some degree of rainfall seasonality (SI > 0.39) (Walsh and Lawler, 1981). Using the modified Mann–Kendall trend tests, no significant trends in the 1984–2005 SI values are observed in the catchments with non-stationary hydrologic response (α=0.01). Few significant trends in precipitation seasonality indices using the percentiles are observed in the catchments with non-stationary hydrologic response includ-ing catchments 410061, 410731, 405238 and 212260. In these catchments, a significant trend in the timing of the 25th percentile are detected, except for catchment 212260 where the trend was significant for the 50th percentile. The sea-sonal shifts in precipitation can impact vegetation dynamics particularly when they occur between the growing and non-growing seasons, such as in catchment 410731. This result suggests that other factors besides precipitation are contribut-ing to observed non-stationarity. Next, we explore hydrologic similarity across catchments with non-stationary hydrologic response.
3.2 Long-term patterns of hydrologic similarity across catchments with non-stationary hydrologic response
Long-term annual average dryness index (PET/ P) (1984– 2010) of the 166 study catchments illustrates presence of energy- and water-limited catchments in the region (Fig. S1 in the Supplement). The North Esk catchment in Tasmania is the only energy-limited catchment amongst the catchments with non-stationary response. Across the catchments with non-stationary hydrologic response, increases in mean an-nual precipitation (1984–2010) increase mean anan-nual frac-tional vegetation cover particularly in catchments with mean annual precipitation of less than 800 mm (Fig. 2). After that, increases inFtotreach an asymptote with mean annual
pre-cipitation greater than 800. Similarly, runoff ratio and its variability increases due to precipitation increase particu-larly across catchments with mean annual precipitation of greater than 800 mm and mean annual fractional vegetation cover of greater than 0.7. The exception is the East Baines River in northern Australia, which has the smallest fractional vegetation cover but has large variability in runoff ratio. In drier catchments, the Horton index is close to 1 and exhibits smaller variability compared to the wetter catchments.
catch-Table 1.Mean annual precipitation (P), discharge (Q), runoff ratio (Q / P) and fractional vegetation cover (Ftot)of catchments with
non-stationary hydrologic response during the 1984–2005 period. Slopes of the trend lines are obtained from a linear regression model fitted to each time series.
Station Area MeanP MeanQ MeanQ / P MeanFtot Slope of the trend (1984–2005)
(km2) (mm) (mm) (–) Q / P P Ftot
1. 212260 713 886.8 189.4 0.19 0.75 −0.013∗ −13.3∗ 0.0052∗ 2. 215002 1382.2 803.2 155.6 0.17 0.72 −0.012∗ −15.5∗ 0.0041
3. 215004 165.6 935.8 292.5 0.29 0.69 −0.011∗ −15.6 0.0049 4. 216004 95.7 1125.8 204.3 0.16 0.71 −0.010∗ −24.7∗ 0.0048
5. 218001 90.6 815.1 266.9 0.3 0.72 −0.016∗ −10 0.0008
6. 406214 237 580.3 45 0.07 0.54 −0.005∗ −6.9 0.0018
7. 408200 2677.3 508.5 6.5 0.01 0.48 −0.0008∗ −6.4 0.0014
8. 408202 82.6 605 48.1 0.07 0.7 −0.006∗ −4.9 0.005 9. 410061 146.1 1004 245.1 0.24 0.77 −0.008∗ −10.5 0.0029∗
10. 410705 508.6 744.8 65.1 0.08 0.64 −0.006∗ −11.5 −0.002 11. 410731 671.6 897.8 84.9 0.09 0.64 −0.006∗ −11.9 0.0003
12. 410734 563.7 816.4 93.6 0.1 0.67 −0.008∗ −13.2∗ 0.0018
13. 410761 5158.3 742.2 56.7 0.07 0.59 −0.005∗ −7.7 −0.0002
14. 412028 2630.7 778.6 97.2 0.11 0.69 −0.006∗ −12 0.0007
15. 412066 1629.7 785.9 100.1 0.12 0.68 −0.008∗ −12 −0.0002
16. 415207 304.5 645.7 52.2 0.07 0.66 −0.006∗ −6.4 0.0013
17. 613146 18.7 1019.4 209.6 0.2 0.69 −0.006∗ −1.9 0.0086∗ 18. G8110004 2443.1 811.7 128.1 0.15 0.26 0.009∗ 13.2 0.0015
19. 318076 379.8 1156.9 383.3 0.33 0.7 −0.005∗ 6.4 0.0090∗ 20. 405238 164.1 734.5 112 0.14 0.64 −0.008∗ −7.7 0.0035
∗The trend is significant at 0.01 significance level using the modified Mann–Kendall trend test.
ment are calculated and normalized by the total absolute dif-ference. In Fig. 3, the differences between catchments with non-stationary and stationary hydrologic response are illus-trated by presenting the mean and standard deviations of normalized cumulative differences for each group. As can be seen in Fig. 3, normalized cumulative differences in an-nual precipitation and fractional vegetation cover between the catchments with non-stationary and stationary hydrologic response are very similar. However, large differences in the normalized cumulative differences of annual runoff ratio ex-ist between these catchments. The catchment area ranges from 18.7 to 5158.3 km2 in catchments with non-stationary hydrologic response (Table 1). While increases in runoff ra-tio, P−Q and mean fractional vegetation cover with in-creases in mean catchment slope are observed in catchments with non-stationary hydrologic response, no distinct differ-ences between catchments with stationary and non-stationary hydrologic response are observed.
Although consistent patterns are observed in catchments’ ecohydrologic response due to differences in mean annual precipitation in catchments with non-stationary hydrologic response, characterizing catchment-scale terrestrial ecosys-tem response to inter-annual precipitation variability is im-portant for hydrologic predictions.
3.3 Normalized sensitivities of annual runoff ratio at a catchment scale
Normalized sensitivity of annual runoff ratio to annual fractional vegetation cover, ET and precipitation indicates greater sensitivity of runoff ratio to fractional vegetation cover than precipitation in most of the catchments with non-stationary hydrologic response (Fig. 4a). While runoff ra-tio sensitivities to precipitara-tion are positive across all catch-ments with non-stationary hydrologic response, these sensi-tivities become negative in some catchments with increases in fractional vegetation cover. These results indicate the im-portance of incorporating vegetation dynamics in examining non-stationary hydrologic response.
Figure 2. Mean and standard deviation of catchment-averaged
(a) annual fractional vegetation cover and (b) annual runoff ra-tio, against mean annual precipitation in catchments with non-stationary hydrologic response.(c)Mean and standard deviation of annual runoff ratio and(d)Horton index versus catchment-averaged annual fractional vegetation cover.
In catchments with mean annual precipitation of 800 mm or higher (aridity index < 1.5), slopes of fractional vegeta-tion cover to mean annual precipitavegeta-tion are zero or negative. A negative slope indicates increases in fractional vegetation cover despite precipitation decrease.
As vegetation productivity is controlled by plant available water (Brooks et al., 2011), fractional vegetation cover sen-sitivity to the Horton index is explored. Both positive and negative sensitivities between the fractional vegetation cover and the Horton index are observed in catchments with non-stationary hydrologic response (Fig. 4c). Positive sensitivi-ties indicate increases in fractional vegetation cover as the Horton index increases. As a higher Horton index is indica-tive of a drier condition, removal of limiting factors like nu-trient limitation is the likely cause of fractional vegetation cover increase in these catchments (Brooks et al., 2011). In a few of these catchments, light limitation may decrease frac-tional vegetation cover in wet years (positive correlations of sunshine hours with fractional vegetation cover; Table S3). In catchments with negative Horton index–fractional vege-tation cover sensitivities, in which drier conditions decrease productivity, water availability is the primary factor in con-trolling vegetation growth. The annual runoff ratio’s sensi-tivity to fractional vegetation cover was similar to the Horton index but with the opposite sign (Fig. 4d). This means that, in catchments with negative fractional vegetation cover–Horton index sensitivity, sensitivity of runoff ratio to fractional
vege-tation cover is positive, and vice versa. Across water-limited catchments (positive runoff ratio–fractional vegetation cover relationship), the runoff ratio sensitivities are smallest in catchments with the highest vegetation cover. As periods of higher productivity coincide with higher precipitation (posi-tive precipitation–fractional vegetation cover relationship) in these catchments, runoff ratio increases in years with higher precipitation. It should be noted that the percentage of tree cover in these drier catchments are more than 60 %, with a few exceptions (Table S1). Negative runoff ratio–fractional vegetation cover sensitivities become more negative in catch-ments with higher fractional vegetation cover. Overall, mean annual runoff ratio and its variability (standard deviation) are smaller in drier catchments with smaller mean fractional veg-etation cover (Fig. 2).
We used baseflow as a measure of catchment storage response to inter-annual precipitation variability. Baseflow sensitivities to mean annual aridity index are highest in drier catchments with non-stationary hydrologic response (Fig. 5a). Normalized fractional vegetation cover sensitivities to the baseflow decrease in catchments with higher annual baseflow index and even become negative at higher base-flow indices (Fig. 5b). This result suggests that, in catch-ments where groundwater constitutes significant component of streamflow, fractional vegetation cover exhibits smaller variability to changes in baseflow as vegetation roots have access to deeper water storage for transpiration and have less sensitivity to changes in baseflow.
Consistent patterns of fractional vegetation cover sensitiv-ities to precipitation, baseflow and the Horton index across catchments with non-stationary hydrologic response present two distinct catchment response behaviors. We hypothesize plausible mechanisms to describe the likely causes of frac-tional vegetation cover sensitivity to inter-annual precipi-tation variability in order to distinguish between alternate catchment ecohydrologic responses.
3.4 Formulating catchment-scale ecohydrologic response
inter-Figure 3.Mean normalized cumulative absolute differences in annual precipitation, fractional vegetation cover and runoff ratio between catchments with non-stationary (20 catchments) and stationary (146 catchments) hydrologic response. The shaded areas represent standard deviations.
Figure 4. (a)Normalized sensitivities of runoff ratio (RR) to precipitation (P), water balance ET and fractional vegetation cover (Ftot);
nor-malized sensitivities of annual(b)fractional vegetation cover to precipitation against catchments’ mean aridity index,(c)fractional vegetation cover to the Horton index (HI) against catchments’ mean Horton index and(d)runoff ratio to fractional vegetation cover against catchments’ mean fractional vegetation cover in catchments with non-stationary hydrologic response. Data labels refer to the station identification number in Table 1.
annual climate variability in water- and energy-limited envi-ronments (Fig. 6b).
In group (A) catchments, a positive relationship between vegetation productivity and precipitation increases exists and can be either caused by (1) direct CO2fertilization effect in
which increases in CO2enhance photosynthesis and increase
LAI, and cause ET to increase due to precipitation and LAI increase (Fig. 6b – class A1), or by (2) indirect CO2
fertil-ization effect in which increased CO2gradient between the
atmosphere and leaf enhances photosynthesis but LAI does not increase. Therefore, reduction in the stomatal conduc-tance reduces ET (Fig. 6b – class A2) (Ainsworth and Long, 2005). In group (A) catchments, changes in runoff ratio de-pend on the hydroclimatic condition. In years where precipi-tation increase is higher than ET, an increase in productivity is followed by increases in runoff ratio, while in drier-than-average years, increases in ET reduce the runoff ratio. It is
expected that under future warming, CO2increases will
con-tinue to increase productivity unless decreases in plant water availability limit plant growth, or changes in stomatal con-ductance, plant respiration rates (Wu et al., 2011) and nutri-ent availability impact productivity.
In group (B) catchments, vegetation productivity de-creases in response to annual precipitation inde-creases. This negative feedback is most likely due to biogeochemical con-straints such as light, nutrients, temperature and soil char-acteristics (Bai et al., 2008) despite changes in the stom-atal conductance due to CO2increases (Paruelo et al., 1999).
Figure 5. (a)Normalized baseflow (B) sensitivities to annual precipitation (P) in each catchment with non-stationary hydrologic response against its mean aridity index (1984–2010), (b)normalized annual fractional vegetation cover (Ftot)sensitivities to annual baseflow of
each catchment with non-stationary hydrologic response against its mean baseflow index (BFI) (1984–2010). Data labels refer to the station identification number in Table 1. In general, annual baseflow sensitivities to mean annual precipitation decrease in wetter catchments (smaller aridity index). Positive sensitivities of fractional vegetation cover to baseflow decrease in catchments with higher baseflow index. Negative fractional vegetation cover sensitivities to baseflow become more negative in catchments with higher baseflow index, indicating larger contribution of groundwater to streamflow.
other factors (anoxic conditions, temperature) limit produc-tivity and decline ET despite increases in precipitation. As these catchments are in the wetter regions, nutrient limita-tion might be caused by increased nutrient leaching in wet soils (Schlesinger, 1997) or increases in nutrient-use effi-ciency due to water availability, which subsequently leads to nutrient limitation (Paruelo et al., 1999). Similar to group (A), changes in runoff ratio depend on the catchment’s hy-droclimatic condition. In these catchments, future changes in vegetation productivity are likely dependent on the rate of nutrient mineralization (Brooks et al., 2011), nitrogen depo-sition and changes in disturbance regimes such as fire and drought. A flowchart illustrates how catchment classification is performed by computing Spearman rank correlations be-tween two variables at each step (Fig. 6c).
The prevalence of the four classes identified above is presented using time series of annual precipitation, water-balance-derived ET and runoff ratio as well as catchment-averaged fractional vegetation cover for the 1984–2010 pe-riod. Three constitutive relationships are established for ev-ery catchment at an annual scale between (1) precipitation, (2) runoff ratio and (3) ET versus catchment-averaged frac-tional vegetation cover. Catchment-scale transpiration data are not available for this classification. According to these relationships and Spearman rank correlations, catchments with non-stationary hydrologic response are grouped in three classes (A1, B1 and B2; Fig. 1). None of the catchments with non-stationary hydrologic response presented a relationship proposed for class A2 catchments. Figure 7 shows Spearman rank correlation values for one example catchment in each class.
As presented in Fig. 1 and Table 2, 12 catchments are clas-sified as class A1. The Spearman rank correlations between annual precipitation and fractional vegetation cover in class
A1 catchments are positive and typically larger than class B1 and B2 catchments, and in 8 out of 12 catchments the correla-tion is significant (p< 0.05). Only one catchment in class B1 (total of three) has a significant negative correlation between precipitation and fractional vegetation cover.
While data on catchment-scale nutrient availability are not available, general ET–fractional vegetation cover relation-ships in group (B) catchments can be further explained by an-nual precipitation–temperature relationships. In wetter years, despite lower vegetation cover, ET will likely increase due to higher water availability in warmer years in B1 catchments (positive precipitation–temperature correlations) (Table S3). In the B2 class with negative precipitation–temperature re-lationships, cooler temperatures and light limitation decline ET.
Groupings of all A1, B1 and B2 catchments illustrate sig-nificant correlations for all three constitutive relationships of Fig. 7 (p< 0.05; Table 2) in class A1 and group (B) catch-ments except between fractional vegetation cover and ET. Therefore, precipitation–fractional vegetation cover relation-ships present first-order groupings of the catchments. Fur-ther distinction within a group is speculative, as it depends on catchment-derived annual ET.
4 Discussions
Figure 6. (a)Global pattern of annual productivity (Ftot)and mean annual precipitation relationship. While precipitation is the primary
factor for vegetation growth in water-limited sites, productivity reaches an asymptote in humid areas or decreases (e.g., tropical forests) with increases in precipitation due to biogeochemical or edaphic constraints. The grey region corresponds to catchments in which productivity is insensitive to inter-annual precipitation variability.(b)A conceptual framework for characterizing changes in runoff ratio to changes in annual precipitation and vegetation productivity (Ftot)in relation to the catchment’s hydroclimatic condition. In group (A) catchments, a
positive relationship between annual precipitation and productivity exists and annual ET changes in relation to productivity depend on the dominance of structural control (increases in LAI, class A1) versus physiological control (decreases in stomatal conductance, class A2) in controlling productivity. In group (B) catchments, an inverse relationship between precipitation and productivity exists and productivity is likely constrained by biogeochemical factors. In B1 catchments, negative ET and productivity relation indicate productivity is likely con-trolled by nutrient availability as drier conditions induce nutrient mineralization. In B2 catchments, light availability and lower temperature reduce ET. In group (A) catchments, runoff ratio would increase as productivity increases, while in group (B), runoff ratio will likely decrease with increasing productivity (decreases in precipitation). Depending on the dominance of limiting resources, precipitation–productivity may shift between the two regimes.(c)The flowchart illustrates the classification procedure. The classification starts by assessing the correlations between annual precipitation andFtotand then annual ET andFtotin a catchment.
4.1 Did catchments with non-stationary hydrologic response experience similar changes in vegetation and water balance variables?
To explore whether HRS catchments have undergone similar changes during the period of analysis, regime curves based on daily runoff, precipitation and monthly fractional vegeta-tion cover data for each catchment are developed using data from pre-drought (1984–1996) and drought (1997–2009) pe-riods (Coopersmith et al., 2014). Regime curves are obtained by averaging daily values of precipitation or runoff for a given day over the length of the data. As daily fractional veg-etation cover data are not available, monthly values are used to develop the regime curves. To summarize the differences between the regime curves for the pre-drought and drought periods, the Nash–Sutcliffe efficiency (NSE) criterion is cal-culated. As can be seen in Fig. 8, differences in daily pre-cipitation and runoff and monthly fractional vegetation cover
regime curves are much higher (indicated by negative NSE) in catchments with non-stationary hydrologic response than the catchments that do not exhibit non-stationary behavior.
While the results of trend analysis are impacted by defin-ing the significance level, the above analysis indicates that catchments with non-stationary behavior have undergone larger changes. To further assess the impact of significance level on the results of the trend analysis, the approach of Douglas et al. (2000) for computing the field significance of regional trend tests is implemented. In this approach, time series of runoff ratio for every catchment are resampled 10 000 times using the bootstrap approach. In the next step, Kendall’sS is calculated for each bootstrap sample and the regional test statistics are calculated by averaging Kendall’s
calcu-Figure 7.Relationships between catchment-averaged annual fractional vegetation cover and annual precipitation (left), water-balance-derived annual ET (middle) and runoff ratio (right) against mean annual fractional vegetation cover (1984–2010) across three catchments represen-tative of each class in Fig. 6. The Spearman rank correlation (r) andpvalues are shown when correlation is significant.
Figure 8.Box plots of Nash–Sutcliffe efficiency (NSE) values calculated between the regime curves of pre-drought and drought periods in catchments with non-stationary (20 catchments) and stationary (146 catchments) hydrologic response, respectively. Changes in daily precipitation and runoff and monthly fractional vegetation cover were larger in catchments with non-stationary hydrologic response.
lated for each station using 0.01 significance level. Indeed, the field significance level obtained from the bootstrap sam-ples is 0.0239, which is more relaxed than the p value of 0.01 originally used. Using the new field significance level, 34 catchments are classified as non-stationary.
4.2 Is the ecohydrologic catchment classification consistent across other measures?
Positive precipitation–fractional vegetation cover relation-ships in class A1 catchments is consistent with positive nor-malized fractional vegetation cover sensitivities of individual
catchments to annual precipitation (Figs. 4b and S2) and indi-cate that water availability primarily controls fractional vege-tation cover increase in A1 catchments. A positive Spearman rank correlation between the coefficient of variation (CV) of annual fractional vegetation cover and CV of annual precip-itation (r=0.34,p=0.3) across all A1 catchments further confirms this conclusion (Yang et al., 2008).
Table 2.Catchment properties and Spearman rank correlations (r) for catchments with non-stationary hydrologic response in Australia. Data span the 1984–2010 period. Class categories refer to the catchment classification framework of Fig. 6.
Station MeanP MeanQ r1 r2 r2-AWAP r3 Class (mm) (mm)
406214 579.7 42.8 0.41∗ 0.47∗ 0.43∗ 0.21 A1
408200 501.2 5.9 0.65∗ 0.65∗ 0.47∗ 0.47∗ A1
408202 594.5 43.4 0.11 0.17 0.19 0.01 A1 410705 734.9 58.1 0.61∗ 0.63∗ 0.70∗ 0.55∗ A1 410731 882.7 75.2 0.17 0.24 0.29 0.06 A1 410761 729.6 51.0 0.45∗ 0.52∗ 0.47∗ 0.36 A1 412028 762.1 84.8 0.47∗ 0.53∗ 0.40∗ 0.29 A1
412066 774.4 88.9 0.55∗ 0.56∗ 0.41∗ 0.34 A1
415207 632.5 46.8 0.25 0.17 0.22 0.29 A1 G8110004 841.1 144.4 0.45∗ 0.23 0.41∗ 0.56∗ A1
410061 979.1 221.2 0.06 0.18 0.38 −0.09 A1 405238 723.0 100.7 0.4∗ 0.4∗ 0.46∗ 0.29 A1
215004 915.3 273.3 −0.42∗ −0.12 −0.42∗ −0.38∗ B1 216004 1099.5 179.0 −0.27 −0.01 −0.24 −0.39∗ B1
218001 807.5 246.6 −0.23 −0.07 −0.15 −0.16 B1 212260 876.8 175.3 −0.30 0.20 −0.27 −0.53∗ B2
215002 789.3 136.7 −0.01 0.29 0.06 −0.13 B2 410734 808.8 83.9 −0.03 0.17 0.2 −0.09 B2 613146 990.1 188.3 −0.23 0.22 −0.39∗ −0.65∗ B2
318076 1151.3 375.6 −0.01 0.29 −0.03 −0.46∗ B2 Class A1 0.34∗ 0.32∗ 0.41∗ 0.33∗
Class B1 −0.23∗ 0.008 −0.13 −0.28∗
Class B2 −0.09 0.11 0.14 −0.16
Group (B) −0.14∗ 0.07 0.04 −0.21∗
∗Correlation is significant (p< 0.05);r
1: correlation between mean annual fractional vegetation cover and annual
precipitation;r2: correlation between annual evapotranspiration (water balance approach) and mean annual
fractional vegetation cover;r2-AWAP: correlation between mean annual fractional vegetation cover and AWAP
annual evapotranspiration;r3: correlation between annual runoff ratio (Q / P) and mean annual fractional
vegetation cover.
(r= −0.71,p=0.06), which highlights the role of biogeo-chemical factors in controlling productivity. Small or even negative sensitivities of vegetation cover to precipitation in group (B) might be due to the presence of perennial vege-tation (shrubs and trees) as ecosystems with more perennial cover are less responsive to inter-annual precipitation vari-ability (Jin and Goulden, 2014).
Our classification framework suggests that group (A) catchments are more sensitive to increases in CO2
concen-trations than the group (B) catchments that are in the humid zone (P /PET > 0.65). This result is consistent with Ukkola et al. (2016), as they showed greater sensitivities of annual ET and normalized difference vegetation index (NDVI) to increases in CO2concentrations in sub-humid and semi-arid
catchments of Australia.
4.3 Are the inferred classification patterns artefacts of remote sensing data and catchment-scale ET? To assess whether observed precipitation–productivity rela-tionships are the artefacts of remote sensing data, two inde-pendent remote sensing vegetation products are used:
veg-etation optical depth (VOD) and enhanced vegveg-etation in-dex (EVI) (Huete et al., 2002, 2006). A global long-term (1988–2010) annual VOD dataset from passive microwave satellites with 0.25◦ resolution (Liu et al., 2011) is related
to water content of leaf and woody components of above-ground biomass (Liu et al., 2015) and is able to detect struc-tural differences in areas with near-closed canopy. Spear-man rank correlations between VOD and annual precipita-tion across group (B) catchments were negative and consis-tent with the results of AVHRR fractional vegetation cover data (Sect. S2, Table S4). Moreover, the Australia coverage of the despiked EVI dataset (2001–2010) from the Moderate Resolution Imaging Spectroradiometer (MODIS) presented high correlations with Ftot data (2001–2010). Previous
Here, we assumed that changes in catchment storage at the annual scale are zero to compute annual water balance ET. However, this assumption is likely not correct in all years. Using AWAP actual annual ET similar relationships between fractional vegetation cover and annual ET are obtained, ex-cept in three catchments in class B2 (Table 2). AWAP ET is based on daily transpiration and soil evaporation values obtained from the WaterDyn model that simulates terrestrial water balance across Australia at 5 km resolution (Raupach et al., 2009). In addition to inter-annual water storage carry-over, inter-annual non-structural carbon storage across years (a wet year can result in greater biomass/leaf area in the following year) can impact precipitation–vegetation relation-ships.
4.4 Does the precipitation–fractional vegetation cover relationship depend on the period of analysis? The period of analysis is limited to 1984–2010 in this study due to availability of AVHRR fractional vegetation cover data for Australia. To assess sensitivity of precipitation– fractional vegetation cover relationships to data length and catchment condition, these relationships are developed for two time periods: 1984–1996 and 1997–2009. It should be noted that 1997–2009 corresponds to the millennium drought in Australia (Chiew et al., 2014). Results indicate simi-lar precipitation–fractional vegetation cover relationships in 1984–2010 in class A1 as well as in group (B) with a few ex-ceptions (Fig. S2). Despite these exex-ceptions, the drier condi-tions of 1997–2009 resulted in higher mean fractional vege-tation covers in group (B) compared to the 1984–1996 period consistent with the classification framework. Results suggest that the record length is important in catchments where pro-ductivity is limited by resources besides water availability.
5 Summary and conclusions
We used precipitation–fractional vegetation cover relation-ships for first-order groupings of catchment-scale ecologic response in 20 catchments with non-stationary hydro-logic response, located in different hydroclimatic regions of Australia. Our results illustrate that fractional vegetation cover is more sensitive to increases in precipitation (stronger Spearman rank correlations) in class A1 catchments (12 catchments). This inference is consistent with the result of meta-analysis of productivity response to precipitation across the globe (Wu et al., 2011). The drawback of using pre-cipitation as the main driver of vegetation productivity is that the impact of confounding variables that covary with precipitation is ignored (Wu et al., 2011). Fractional veg-etation cover sensitivity to precipitation and Horton index provided consistent results with our catchment classifica-tion framework, except in two catchments. These catchments (408202, 410061) have smaller rank correlation between
pre-cipitation and fractional vegetation cover compared to the rest of class A1 catchments. A total of 8 out of 20 catch-ments with non-stationary hydrologic response present neg-ative precipitation–fractional vegetation cover relationships impacted by nutrient or light availability.
While determining the exact causes of non-stationarity requires detailed modeling experiments, non-stationarity of runoff ratios could be attributed to changes in precipitation amount, intensity and seasonality, increases in air tempera-ture and CO2concentrations (Chiew et al., 2014). The
pro-posed framework provides a general guideline for projecting the likely changes in catchment water balance in response to climate change and designing simulation experiments. How-ever, uncertainty still remains about the terrestrial ecosystem response as factors such as nutrients and light availability, vegetation developmental stage, space constraint and preva-lence of pests may impact productivity (Körner, 2006). In addition, it is expected that frequency and duration of ex-treme events, such as fire, drought and floods, will increase, which can further alter ecosystem response and plant water availability (Medlyn et al., 2011).
6 Data availability
The datasets used in this research are publicly available from the following websites. The daily streamflow values are obtained from the hydrologic reference stations (HRS) website (http://www.bom.gov.au/water/hrs/). Daily precipi-tation, actual and potential evapotranspiration, and temper-ature are obtained from the Australian Water Availability Project (AWAP) website (http://www.csiro.au/awap).
Remotely sensed vegetation products are avail-able for download from the following websites: (1) Australian monthly fPAR dataset version 5: (doi:10.4225/08/50FE0CBE0DD06), (2) EVI dataset (http://remote-sensing.nci.org.au/u39/public/data/modis/ evi-cube-ga/v1-201108/), and (3) annual VOD data (http://www.wenfo.org/wald/global-biomass/).
The Supplement related to this article is available online at doi:10.5194/hess-21-281-2017-supplement.
Acknowledgements. This research was funded by the Australian Research Council linkage grant (LP130100072), the Australian Bureau of Meteorology and WaterNSW. We acknowledge the Australian Bureau of Meteorology for providing the hydrologic reference station data supported by the Australian Government through the Water Information Program. We would like to ac-knowledge Yi Liu for providing the VOD data.
Edited by: A. Wei
References
Ainsworth, E. A. and Long, S. P.: What have we learned from 15 years of Free-Air CO2Enrichment (FACE)? A meta-analytic
re-view of the responses of photosynthesis, canopy properties and plant production to rising CO2, New Phytol., 165, 351–371,
doi:10.1111/j.1469-8137.2004.01224.x, 2005.
Bai, Y., Wu, J., Xing, Q., Pan, Q., Huang, J., Yang, D., and Han, X.: Primary production and rain use efficiency across a precipita-tion gradient on the Mongolia Plateau, Ecology, 89, 2140–2153, doi:10.1890/07-0992.1, 2008.
Band, L. E., Mackay, D. S., Creed, I. F., Semkin, R., and Jef-fries, D.: Ecosystem processes at the watershed scale: Sensitiv-ity to potential climate change, Limnol. Oceanogr., 41, 928–938, doi:10.4319/lo.1996.41.5.0928, 1996.
Baron, J. S., Hartman, M. D., Band, L. E., and Lammers, R. B.: Sensitivity of a high-elevation rocky mountain watershed to altered climate and CO2, Water Resour. Res., 36, 89–99,
doi:10.1029/1999WR900263, 2000.
Betts, R. A., Boucher, O., Collins, M., Cox, P. M., Falloon, P. D., Gedney, N., Hemming, D. L., Huntingford, C., Jones, C. D., Sex-ton, D. M. H., and Webb, M. J.: Projected increase in continental runoff due to plant responses to increasing carbon dioxide, Na-ture, 448, 1037–1041, doi:10.1038/nature06045, 2007.
Brooks, P. D., Troch, P. A., Durcik, M., Gallo, E., and Schlegel, M.: Quantifying regional scale ecosystem response to changes in precipitation: Not all rain is created equal, Water Resour. Res., 47, W00J08, doi:10.1029/2010WR009762, 2011.
Chiew, F. H. S., Potter, N. J., Vaze, J., Petheram, C., Zhang, L., Teng, J., and Post, D. A.: Observed hydrologic non-stationarity in far south-eastern Australia: Implications for modelling and pre-diction, Stoch. Env. Res. Risk A., 28, 3–15, doi:10.1007/s00477-013-0755-5, 2014.
Coopersmith, E. J., Minsker, B. S., and Sivapalan, M.: Pat-terns of regional hydroclimatic shifts: An analysis of chang-ing hydrologic regimes, Water Resour. Res., 50, 1960–1983, doi:10.1002/2012WR013320, 2014.
Donohue, R. J., Roderick, M. L., and McVicar, T. R.: Deriving consistent long-term vegetation information from AVHRR re-flectance data using a cover-triangle-based framework, Remote Sens. Environ., 112, 2938–2949, doi:10.1016/j.rse.2008.02.008, 2008.
Donohue, R. J., McVicar, T. R., and Roderick, M. L.: Climate-related trends in Australian vegetation cover as inferred from satellite observations, 1981–2006, Glob. Change Biol., 15, 1025– 1039, doi:10.1111/j.1365-2486.2008.01746.x, 2009.
Douglas, E. M., Vogel, R. M., and Kroll, C. N.: Trends in floods and low flows in the United States: Impact of spatial correlation, J. Hydrol., 240, 90–105, doi:10.1016/S0022-1694(00)00336-X, 2000.
Fatichi, S. and Ivanov, V. Y.: Interannual variability of evapotranspi-ration and vegetation productivity, Water Resour. Res., 50, 3275– 3294, doi:10.1002/2013WR015044, 2014.
Field, C. B., Jackson, R. B., and Mooney, H. A.: Stomatal responses to increased CO2: Implications from the plant to the global
scale, Plant Cell Environ., 18, 1214–1225, doi:10.1111/j.1365-3040.1995.tb00630.x, 1995.
Gedney, N., Cox, P. M., Betts, R. A., Boucher, O., Huntingford, C., and Stott, P. A.: Detection of a direct carbon dioxide
ef-fect in continental river runoff records, Nature, 439, 835–838, doi:10.1038/nature04504, 2006.
Hamed, K. H. and Rao, A. R.: A modified Mann-Kendall trend test for autocorrelated data, J. Hydrol., 204, 182–196, doi:10.1016/S0022-1694(97)00125-X, 1998.
Hsu, J. S., Powell, J., and Adler, P. B.: Sensitivity of mean an-nual primary production to precipitation, Glob. Change Biol., 18, 2246–2255, doi:10.1111/j.1365-2486.2012.02687.x, 2012. Huete, A., Didan K., Miura, T., Rodriguez, E. P., Gao, X., and
Fer-reira, L. G.: Overview of the radiometric and biophysical perfor-mance of the MODIS vegetation indices, Remote Sens. Environ., 83, 195–213, doi:10.1016/S0034-4257(02)00096-2, 2002. Huete, A. R., Didan, K., Shimabukuro, Y. E., Ratana, P., Saleska,
S. R., Hutyra, L. R., Yang, W., Nemani, R. R., and Myneni, R.: Amazon rainforests green-up with sunlight in dry season, Geo-phys. Res. Lett., 33, L06405, doi:10.1029/2005GL025583, 2006. Huxman, T. E., Smith, M. D., Fay, P. A., Knapp, A. K., Shaw, M. R., Loik, M. E., Smith, S. D., Tissue, D. T., Zak, J. C., Weltzin, J. F., Pockman, W. T., Sala, O. E., Haddad, B. M., Harte, J., Koch, G. W., Schwinning, S., Small, E. E., and Williams, D. G.: Con-vergence across biomes to a common rain-use efficiency, Nature, 429, 651–654, doi:10.1038/nature02561, 2004.
Ivanov, V. Y., Bras, R. L., and Vivoni, E. R.: Vegetation-hydrology dynamics in complex terrain of semiarid areas: 1. A mechanistic approach to modeling dynamic feedbacks, Water Resour. Res., 44, W03429, doi:10.1029/2006WR005588, 2008.
Jin, Y. and Goulden, M. L.: Ecological consequences of vari-ation in precipitvari-ation: Separating short-versus long-term ef-fects using satellite data, Global Ecol. Biogeogr., 23, 358–370, doi:10.1111/geb.12135, 2014.
Kendall, M. G.: Rank correlation methods, Charles Griffin, London, 1970.
Kergoat, L., Lafont, S., Douville, H., Berthelot, B., Dedieu, G., Planton, S., and Royer, J. F.: Impact of doubled CO2on
global-scale leaf area index and evapotranspiration: Conflicting stomatal conductance and LAI responses, J. Geophys. Res.-Atmos., 107, 4808, doi:10.1029/2001JD001245, 2002.
Körner, C.: Plant CO2 responses: An issue of definition,
time and resource supply, New Phytol., 172, 393–411, doi:10.1111/j.1469-8137.2006.01886.x, 2006.
Leuzinger, S. and Körner, C.: Rainfall distribution is the main driver of runoff under future CO2-concentration in a temperate decidu-ous forest, Glob. Change Biol., 16, 246–254, doi:10.1111/j.1365-2486.2009.01937.x, 2010.
Liu, Y. Y., de Jeu, R. A. M., McCabe, M. F., Evans, J. P., and van Dijk, A. I. J. M.: Global long-term passive microwave satellite-based retrievals of vegetation optical depth, Geophys. Res. Lett., 38, L18402, doi:10.1029/2011GL048684, 2011.
Liu, Y. Y., van Dijk, A. I. J. M., de Jeu, R. A. M., Canadell, J. G., McCabe, M. F., Evans, J. P., and Wang, G.: Recent rever-sal in loss of global terrestrial biomass, Nature Climate Change, 5, 470–474, doi:10.1038/nclimate2581, 2015.
Lyne, V. and Hollick, M.: Stochastic time-variable rainfall-runoff modelling, in Hydrol. and Water Resour. Symp., publ. 79/10, Inst. Eng. Austr. Natl. Conf., Perth, Australia, 89–92, 1979. Mann, H. B.: Non-parametric tests against trend, Econometrics, 13,
245–259, 1945.
S. B., Kellomäki, S., Laitat, E., Rey, A., Roberntz, P., Sigurdsson, B. D., Strassemeyer, J., Wang, K., Curtis, P. S., and Jarvis, P. G.: Stomatal conductance of forest species after long-term exposure to elevated CO2concentration: A synthesis, New Phytol., 149,
247–64, doi:10.1046/j.1469-8137.2001.00028.x, 2001.
Medlyn, B. E., Duursma, R. A., and Zeppel, M. J. B.: Forest pro-ductivity under climate change: A checklist for evaluating model studies, Wiley Interdisciplinary Reviews: Climate Change, 2, 332–355, doi:10.1002/wcc.108, 2011.
Norby, R. J., Warren, J. M., Iversen, C. M., Medlyn, B. E., and McMurtrie, R. E.: CO2enhancement of forest productivity
con-strained by limited nitrogen availability, P. Natl. Acad. Sci. USA, 107, 19368–19373, doi:10.1073/pnas.1006463107, 2010. Paruelo, J. M., Lauenroth, W. K., Burke, I. C., and Sala, O. E.:
Grassland precipitation-use efficiency varies across a resource gradient, Ecosystems, 2, 64–68, doi:10.1007/s100219900058, 1999.
Piao, S., Friedlingstein, P., Ciais, P., de Noblet-Ducoudré, N., Labat, D., and Zaehle, S.: Changes in climate and land use have a larger direct impact than rising CO2 on global river
runoff trends, P. Natl. Acad. Sci. USA, 104, 15242–15247, doi:10.1073/pnas.0707213104, 2007.
Pryor, S. C. and Schoof, J. T.: Changes in the seasonality of precip-itation over the contiguous USA, J. Geophys. Res.-Atmos., 113, D21108, doi:10.1029/2008JD010251, 2008.
Raupach, M. R., Briggs, P. R., Haverd, V., King, E. A., Paget, M., and Trudinger, C. M.: Australian Water Availability Project (AWAP): CSIRO Marine and Atmospheric Research Compo-nent: Final Report for Phase 3, CAWCR Technical Report No. 013, 67 pp., 2009.
Raupach, M. R., Briggs, P. R., Haverd, V., King, E. A., Paget, M., and Trudinger, C. M.: Australian Water Availability Project. CSIRO Marine and Atmospheric Research, Canberra, Australia, http://www.csiro.au/awap (last access: January 2016), 2012. Sankarasubramanian, A., Vogel, R. M., and Limbrunner, J. F.:
Cli-mate elasticity of streamflow in the United States, Water Resour. Res., 37, 1771–1781, doi:10.1029/2000WR900330, 2001. Sawicz, K., Wagener, T., Sivapalan, M., Troch, P. A., and Carrillo,
G.: Catchment classification: Empirical analysis of hydrologic similarity based on catchment function in the eastern USA, Hy-drol. Earth Syst. Sci., 15, 2895–2911, doi:10.5194/hess-15-2895-2011, 2011.
Sawicz, K. A., Kelleher, C., Wagener, T., Troch, P., Sivapalan, M., and Carrillo, G.: Characterizing hydrologic change through catchment classification, Hydrol. Earth Syst. Sci., 18, 273–285, doi:10.5194/hess-18-273-2014, 2014.
Schlesinger, W. H.: Biogeochemistry: An Analysis of Global Change, 2nd Edn., Academic press, San Diego, California, 1997. Schuur, E. A. G.: Productivity and global climate revis-ited: The sensitivity of tropical forest growth to pre-cipitation, Ecology, 84, 1165–1170, doi:10.1890/0012-9658(2003)084[1165:PAGCRT]2.0.CO;2, 2003.
Sivapalan, M., Thompson, S. E., Harman, C. J., Basu, N. B., and Kumar, P.: Water cycle dynamics in a changing environment: Im-proving predictability through synthesis, Water Resour. Res., 47, W00J01, doi:10.1029/2011WR011377, 2011.
Troch, P. A., Martinez, G. F., Pauwels, V. R. N., Durcik, M., Siva-palan, M., Harman, C., Brooks, P. D., Gupta, H., and Huxman, T.: Climate and vegetation water use efficiency at catchment scales, Hydrol. Process., 23, 2409–2414, doi:10.1002/hyp.7358, 2009. Ukkola, A. M., Prentice, I. C., Keenan, T. F., van Dijk, A.
I. J. M., Viney, N. R., Myneni, R. B., and Bi, J.: Re-duced streamflow in water-stressed climates consistent with CO2 effects on vegetation, Nature Climate Change, 6, 75–78,
doi:10.1038/nclimate2831, 2016.
Vitousek, P. and Howarth, R.: Nitrogen limitation on land and in the sea: How can it occur?, Biogeochemistry, 13, 87–115, doi:10.1007/BF00002772, 1991.
Voepel, H., Ruddell, B., Schumer, R., Troch, P. A., Brooks, P. D., Neal, A., Durcik, M., and Sivapalan, M.: Quantifying the role of climate and landscape characteristics on hydrologic partition-ing and vegetation response, Water Resour. Res., 47, W00J09, doi:10.1029/2010WR009944, 2011.
Wagener, T., Sivapalan, M., Troch, P. A., and Woods, R.: Catchment classification and hydrologic similarity, Geography Compass, 1, 901–931, doi:10.1111/j.1749-8198.2007.00039.x, 2007. Walsh, P. D. and Lawler, D. M.: Rainfall seasonality: Description,
spatial patterns and changes through time, Weather, 36, 201–208, doi:10.1002/j.1477-8696.1981.tb05400.x, 1981.
Wieder, W.: Soil carbon: Microbes, roots and global carbon, Na-ture Climate Change, 4, 1052–1053, doi:10.1038/nclimate2454, 2014.
Wigley, T. M. L. and Jones, P. D.: Influences of precipitation changes and direct CO2effects on streamflow, Nature, 314, 149–
152, doi:10.1038/314149a0, 1985.
Wu, Z., Dijkstra, P., Koch, G. W., Peñelas, J., and Hungate, B. A.: Responses of terrestrial ecosystems to temperature and pre-cipitation change: A meta-analysis of experimental manipu-lation, Glob. Change Biol., 17, 927–942, doi:10.1111/j.1365-2486.2010.02302.x, 2011.
Xu, X., Yang, D., and Sivapalan, M.: Assessing the impact of climate variability on catchment water balance and vegetation cover, Hydrol. Earth Syst. Sci., 16, 43–58, doi:10.5194/hess-16-43-2012, 2012.
Yang, Y., Fang, J., Ma, W., and Wang, W.: Relationship between variability in aboveground net primary production and precip-itation in global grasslands, Geophys. Res. Lett., 35, L23710, doi:10.1029/2008GL035408, 2008.