www.arch-anim-breed.net/59/351/2016/ doi:10.5194/aab-59-351-2016
© Author(s) 2016. CC Attribution 3.0 License. Archives Animal Breeding
Exploration of the exonic variations of the iPSC-related
Nanog
gene and their effects on phenotypic
traits in cattle
Meng Zhang, Chuanying Pan, Qin Lin, Shenrong Hu, Ruihua Dang, Chuzhao Lei, Hong Chen, and Xianyong Lan
College of Animal Science and Technology, Northwest A&F University, Shaanxi Key Laboratory of Molecular Biology for Agriculture, Yangling, 712100 Shaanxi, China
Correspondence to:Xianyong Lan ([email protected]) and Hong Chen ([email protected])
Received: 26 April 2016 – Revised: 19 July 2016 – Accepted: 26 July 2016 – Published: 11 August 2016
Abstract. Nanog is an important pluripotent transcription regulator transforming somatic cells to induced pluripotent stem cells (iPSCs), and its overexpression leads to a high expression of the growth and differen-tiation factor 3 (GDF3), which affects animal growth traits. Therefore, the aim of this study was to explore the genetic variations within theNanoggene and their effects on phenotypic traits in cattle. Six novel exonic single nucleotide polymorphisms (SNPs) were found in six cattle breeds. Seven haplotypes were analyzed: TCAACC (0.260), TCAATA (0.039), TCATCC (0.019), TCGACC (0.506), TCGATA (0.137), TCGTCC (0.036), and CT-GATA (0.003). There were strong linkage disequilibriums of SNP1 and SNP2 in Jiaxian cattle as well as of SNP5 and SNP6 in both Jiaxian cattle and Nanyang cattle. Moreover, SNP3, SNP4, and SNP5 were associated with phenotypes. The individuals with GG genotype at the SNP3 locus or AA genotype at the SNP4 locus showed better body slanting length and chest circumference or body height and hucklebone width in Nanyang cattle. The superiority of the SNP5-C allele regarding body height and cannon circumference was observed in Jiaxian cattle. The combination of SNP3 and SNP4 (GG–AA) had positive effects on body height, body slanting length, and chest circumference. These findings may indicate thatNanog, as a regulator of bovine growth traits, could be a candidate gene for marker-assisted selection (MAS) in breeding and genetics in cattle.
1 Introduction
Induced pluripotent stem cells (iPSCs), derived from transcription-factor reprogramming, redefine our ability to develop the protein production of livestock, to improve dis-ease resistance and production efficiencies, and to develop modeled livestock for research (Liang and Zhang, 2013; Lei el al., 2013). iPSCs are generated directly interacting with Nanog, Klf4, Oct4, Sox2, C-Myc, and other transcription factors. Among them, the iPSC-related transcription factor Klf4 is necessary for adipose differentiation and develop-ment (Cervantes-Camacho et al., 2015). Similarly,Klf7 reg-ulated energy metabolism and affected bovine growth (Ma et al., 2011). Thus, another iPSC-related transcription factor Nanogwas inferred to affect growth traits in cattle.
As a vital member of iPSC-related genes,Nanog, which
consists of four exons and three introns in different species, is conservative and blocks the differentiation of pluripo-tent stem cells (Clark et al., 2004; Sumer et al., 2011). In a comparison and analysis of human, murine, and bovine Nanogpromoter sequences, the promoters contained highly conserved regions (Rodda et al., 2005). In primordial germ cells (PGCs),Nanogwas required for germ cell development
(Yang et al., 2015). Recently, Nanog overexpression
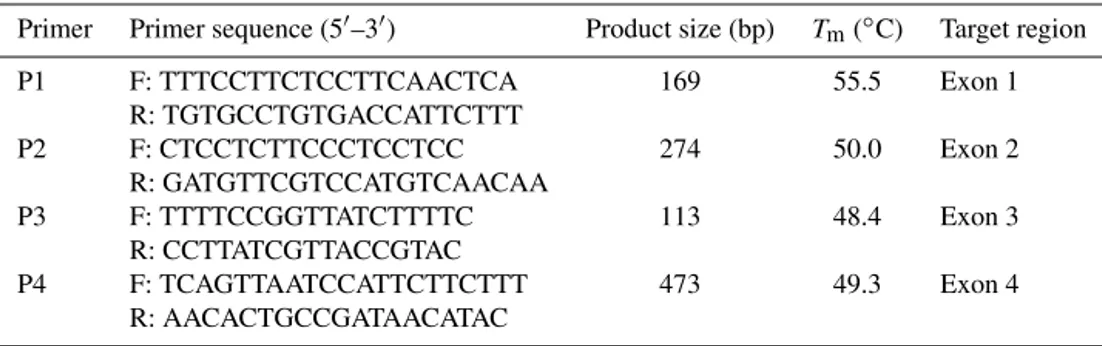
particu-Table 1.Primers used for detecting mutations ofNanoggene in cattle
Primer Primer sequence (5′–3′) Product size (bp) Tm(◦C) Target region
P1 F: TTTCCTTCTCCTTCAACTCA 169 55.5 Exon 1
R: TGTGCCTGTGACCATTCTTT
P2 F: CTCCTCTTCCCTCCTCC 274 50.0 Exon 2
R: GATGTTCGTCCATGTCAACAA
P3 F: TTTTCCGGTTATCTTTTC 113 48.4 Exon 3
R: CCTTATCGTTACCGTAC
P4 F: TCAGTTAATCCATTCTTCTTT 473 49.3 Exon 4
R: AACACTGCCGATAACATAC
larly high level of expression in white-fat tissue in mice; this was mainly induced by a high-fat diet and blocking of the fat metabolic pathway (Wang et al., 2004). The presence of Nanoginhibits the transcriptional effectors of both the bone morphogenetic protein and NF-kappa B pathways in embry-onic stem cells (ESCs) (Li et al., 2016). Moreover, GLI1 and
GLI3 bind to Nanog, but Nanoginhibits GLI transcription
and Hedgehog signaling (Li et al., 2016). These proteins and pathways influence the physiological function development of cells and organisms.
The experimental animals used in this study are excellent cattle breeds from different Chinese locations. Qinchuan cat-tle (QC), Nanyang catcat-tle (NY), Jiaxian catcat-tle (JX), and Jin-nan cattle (JN) are the major meat-producing cattle; Angus (AN) and Chinese Holstein (CH) have been introduced from abroad. Based on the previous reports, this study explored the effects of SNPs in the Nanoggene on the growth traits of these cattle, which would contribute to cattle breeding and genetics through marker-assisted selection (MAS).
2 Materials and methods
All animal experiments were implemented following rele-vant laws and institutional guidelines and were approved by the Northwest A&F University Institutional Animal Care and Use Committee.
2.1 DNA samples
A total of 796 cattle belonging to six Chinese breeds were
used for this experiment, including Nanyang (n=247),
Qinchuan (n=144), Jiaxian (n=269), Jinnan (n=28), An-gus (n=47), and Chinese Holstein (n=61). All selected individuals were healthy and unrelated. Records of growth traits and body sizes for different growth periods (postnatal and 6, 12, 18, and 24 months old) were collected for statis-tical analysis (Pan et al., 2008). Ear tissue and blood sam-ples of individuals were obtained and stored at −80◦C for DNA isolation. Genomic DNA was isolated from ear tissue and leukocytes from blood samples according to the proce-dure described by Sambrook and Russell (2001) and stored at−20◦C.
2.2 PCR conditions and genotyping
Four pairs of primer were designed for theNanoggene by
the Primer Premier 5.0 program (Table 1), covering exons
1–4 based on the available sequence of the bovineNanog
gene (GeneBank accession No. AC_000162.1). PCR (poly-merase chain reaction) was performed in a 25 µL reaction
volume, containing 50 ng genomic DNA, 0.5 µmol L−1 of
each primer, 1× buffer (including 1.5 mmol L−1 MgCl2), 200 µmol L−1dNTPs, and 0.625 unit of TaqDNA polymerase (MBI, Vilnius, Lithuania). The PCR amplification conditions were as follows: initial denaturing at 95◦C for 5 min
fol-lowed by 36 cycles of 95◦C for 30 s, annealing 30 s, and
extending at 72◦C for 30 s, with a final extension at 72◦C
for 10 min (Lan et al., 2007).
Aliquots of 5 µL PCR products from different individuals were mixed with 5 µL denaturing solution (95 % formamide, 25 mM EDTA, 0.025 % Xylene cyanole, and 0.025 % bro-mophenol blue), heated for 10 min at 98◦C, and chilled on ice. Denatured DNA was subjected to PAGE (polyacrylamide gel electrophoresis) (80×73×0.75 mm) in 1×TBE buffer at constant voltage (200 V) for 2.5–3.0 h. The gel was stained with 0.1 % silver nitrate (Lan et al., 2007). The bands of prod-ucts on PAGE gels were distinguished and selected for pu-rification and sequencing. Comparing sequencings, we con-firmed that two polymorphisms existed in the first exon, one polymorphism in the second exon, and three polymorphisms
in the fourth exon in the Nanog gene (Fig. 1). To check
the result of SSCP (single-stranded conformational polymor-phism), we carried out PCR-RFLP (polymerase chain reac-tion restricreac-tion fragment length polymorphism) on SNP1 and SNP5. Aliquots of 20 µL PCR products of the first exon in the Nanoggene were digested with 10 UMvaI at 37◦C for 6–8 h. The digested products were detected by 2.5–3.5 % agarose gel (Lan et al., 2007). Meanwhile, aliquots of 20 µL PCR
products of exon 4 in the Nanoggene were digested with
T>C C>T G>A A>T T>C C>A
5’-UTR 3’-UTR
R3 F4
R4
F1 F2
R2 F3
R1
Exon 1 Exon 2 Exon 3 Exon 4
SNP1 SNP2 SNP3 SNP4 SNP5 SNP6
Figure 1.Sequencing of six SNPs and electrophoretograms of SNP1 and SNP5. Note: electrophoresis images show PCR-RFLP on SNP1 and SNP5. At SNP1, TT had 169 bp and TC had 169 bp and 109 bp. At SNP5, CC had 278+164 bp and TC had 278+195+164 bp; total length of the fourth exon: 473 bp.
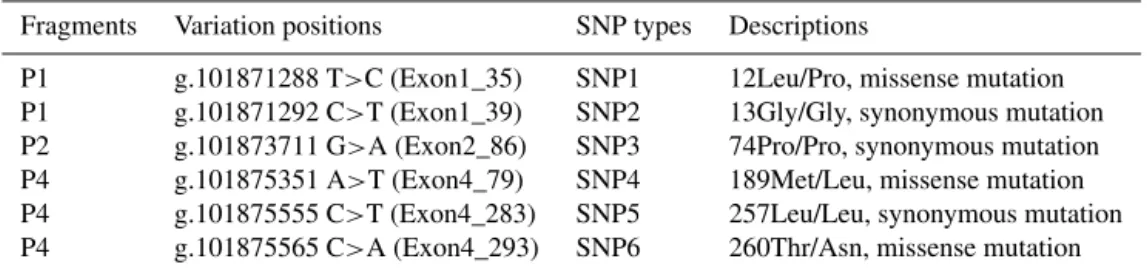
Table 2.Genotypes of different mutations corresponding to PCR-SSCP types in cattle
Fragments Variation positions SNP types Descriptions
P1 g.101871288 T>C (Exon1_35) SNP1 12Leu/Pro, missense mutation P1 g.101871292 C>T (Exon1_39) SNP2 13Gly/Gly, synonymous mutation P2 g.101873711 G>A (Exon2_86) SNP3 74Pro/Pro, synonymous mutation P4 g.101875351 A>T (Exon4_79) SNP4 189Met/Leu, missense mutation P4 g.101875555 C>T (Exon4_283) SNP5 257Leu/Leu, synonymous mutation P4 g.101875565 C>A (Exon4_293) SNP6 260Thr/Asn, missense mutation
Table 3.Genotypic frequencies, allelic frequencies, HWE, and population parameters of theNanoggene in Chinese cattle.
Loci Breeds N TT TC CC T C P Ho He Ne PIC
SNP1 NY 247 0.996 0.004 0 0.998 0.002 P >0.05 0.996 0.004 1.004 0.004 QC 144 1.000 0 0 1.000 0 P >0.05 1.000 0 1.000 0 JX 269 0.970 0.030 0 0.985 0.015 P >0.05 0.971 0.029 1.030 0.029 JN 28 1.000 0 0 1.000 0 P >0.05 1.000 0 1.000 0 Angus 47 1.000 0 0 1.000 0 P >0.05 1.000 0 1.000 0 Holstein 61 1.000 0 0 1.000 0 P >0.05 1.000 0 1.000 0
Loci Breeds N CC CT TT C T P Ho He Ne PIC
SNP2 NY 247 0.996 0.004 0 0.998 0.002 P >0.05 0.996 0.004 1.004 0.004 QC 144 1.000 0 0 1.000 0 P >0.05 1.000 0 1.000 0 JX 269 0.970 0.030 0 0.985 0.015 P >0.05 0.971 0.029 1.030 0.029 JN 28 1.000 0 0 1.000 0 P >0.05 1.000 0 1.000 0 Angus 47 1.000 0 0 1.000 0 P >0.05 1.000 0 1.000 0 Holstein 61 1.000 0 0 1.000 0 P >0.05 1.000 0 1.000 0
Loci Breeds N GG GA AA G A P Ho He Ne PIC
SNP3 NY 151 0.616 0 0.384 0.616 0.384 P <0.01 0.527 0.473 1.898 0.361
QC – – – – – – – – – – –
JX 74 0.689 0.311 0 0.845 0.155 P <0.05 0.737 0.263 1.356 0.228
JN – – – – – – – – – – –
Angus – – – – – – – – – – –
Holstein 61 1.000 0 0 1.000 0 P >0.05 1.000 0 1.000 0.000
Loci Breeds N AA AT TT A T P Ho He Ne PIC
SNP4 NY 101 0.792 0.208 0 0.896 0.104 P >0.05 0.814 0.186 1.229 0.169 QC 140 0.564 0.436 0 0.782 0.218 P <0.01 0.659 0.341 1.517 0.283 JX 116 0.940 0.060 0 0.970 0.030 P >0.05 0.941 0.059 1.062 0.057
JN – – – – – – – – – – –
Angus – – – – – – – – – – –
Holstein – – – – – – – – – – –
Loci Breeds N CC CT TT C T P Ho He Ne PIC
SNP5 NY 101 0.941 0.059 0 0.970 0.030 P >0.05 0.942 0.058 1.061 0.056 QC 140 0.450 0.550 0 0.725 0.275 P <0.01 0.601 0.399 1.663 0.319 JX 116 0.276 0.724 0 0.638 0.362 P <0.01 0.538 0.462 1.859 0.355
JN – – – – – – – – – – –
Angus – – – – – – – – – – –
Holstein – – – – – – – – – – –
Loci Breeds N CC CA AA C A P Ho He Ne PIC
SNP6 NY 101 0.941 0.059 0 0.970 0.030 P >0.05 0.942 0.058 1.061 0.056 QC 140 0.421 0.550 0.029 0.696 0.304 P <0.01 0.577 0.423 1.733 0.333 JX 116 0.267 0.724 0.009 0.629 0.371 P <0.01 0.533 0.467 1.875 0.358
JN – – – – – – – – – – –
Angus – – – – – – – – – – –
Holstein – – – – – – – – – – –
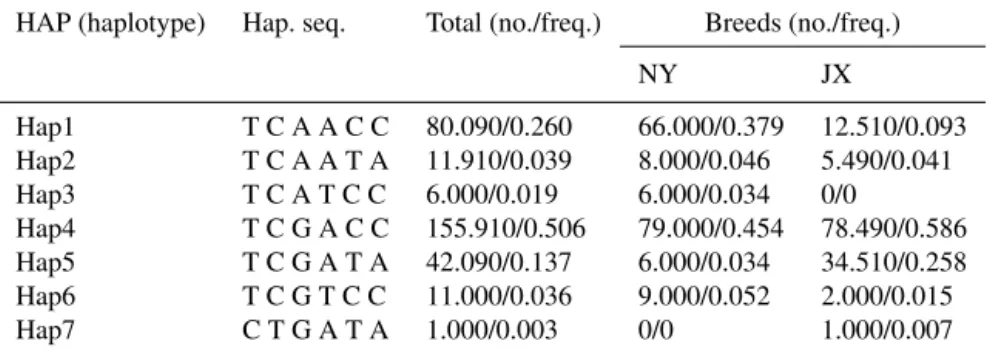
Table 4.Haplotypes and their frequencies of six SNPs in Nanyang cattle and Jiaxian cattle.
HAP (haplotype) Hap. seq. Total (no./freq.) Breeds (no./freq.)
NY JX
Hap1 T C A A C C 80.090/0.260 66.000/0.379 12.510/0.093 Hap2 T C A A T A 11.910/0.039 8.000/0.046 5.490/0.041 Hap3 T C A T C C 6.000/0.019 6.000/0.034 0/0
Hap4 T C G A C C 155.910/0.506 79.000/0.454 78.490/0.586 Hap5 T C G A T A 42.090/0.137 6.000/0.034 34.510/0.258 Hap6 T C G T C C 11.000/0.036 9.000/0.052 2.000/0.015 Hap7 C T G A T A 1.000/0.003 0/0 1.000/0.007
2.3 Statistical analysis
Genotypic and allelic frequencies were calculated by Pop-Gene version 3.2 (Yeh et al., 2000). The Hardy–Weinberg equilibrium (HWE) was analyzed based on a predetermined value of the test statistic (Emigh, 1980). Linkage disequi-librium was performed by the SHEsis online platform (http: //analysis.bio-x.cn) (Shi et al., 2005; Li et al., 2009). Popu-lation parameters, including gene heterozygosity (He), gene homozygosity (Ho), effective allele numbers (Ne), and poly-morphism information content (PIC), were calculated ac-cording to Nei’s method (Nei and Roychoudhury, 1974). Dis-tribution differences for genotypic and allelic frequencies among different breeds were analyzed using theχ2test. The associations between genotypes and growth traits of cattle were analyzed using the statistical software SPSS (Version 22.0, International Business Machines (IBM) Corporation, New York, USA; Pan et al., 2013). The linear model was as follow:Yij k=µ+Ai+Gj+eij k, whereYij k represents
the observation of the body measurement traits,µthe overall mean of each trait,Aithe fixed effect of age,Gj the fixed
ef-fect of genotype or combined genotype, andeij kthe random
residual error (Chen et al., 2016; Zhang et al., 2015). The effect of genotype was a significant variation source, when
the P value for the difference was less than 0.05 between
the least squares means for each genotype (Lan et al., 2013; Zhao et al., 2013).
3 Results
3.1 Genetic variant identification of theNanoggene Through the experiment, we found two mutations in exon1 (AC_000162.1: g.101871288T>C, g.101871292C>T), one
mutation in exon2 (AC_000162.1: g.101873711G>A), and
three mutations in exon4 (AC_000162.1: g.101875351A>T, g.101875555C>T, and g.101875565C>A) in the Nanog gene by DNA sequencing and PCR-SSCP, named SNP1–6, respectively (Fig. 1). SNP1, SNP4, and SNP6 were missense mutations corresponding to 12Leu>Pro, 189Met>Leu, and 260Thr>Asn, respectively (Table 2). We performed
PCR-RFLP on SNP1 and SNP5 using MvaI and MboI,
respec-tively, and did DNA sequencing on other SNPs (Fig. 1). Fre-quencies of alleles and genotypes, He, Ho, Ne, and PIC in six cattle breeds are listed in Table 3. The minor allelic frequen-cies among six breeds of SNP1 and SNP2 ranged from 0.002 to 0.015; those of SNP3 ranged from 0.000 to 0.384, those of SNP4 from 0.030 to 0.218, those of SNP5 from 0.030
to 0.362, and those of SNP6 from 0.030 to 0.371. Theχ2
test showed that SNP1 and SNP2 of all cattle breeds were in Hardy–Weinberg equilibrium (HWE), yet other polymor-phisms in several cattle breeds were not in HWE and are shown in Table 3.
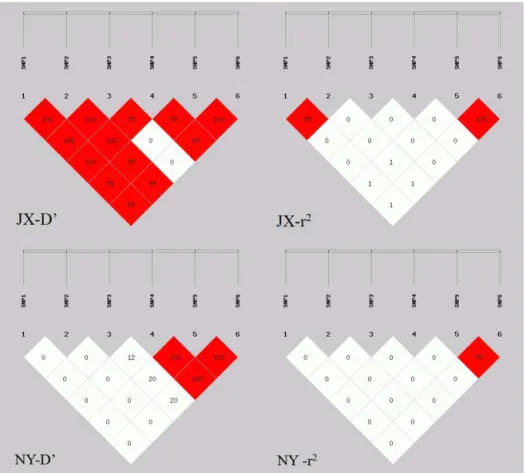
3.2 Haplotype analysis and linkage disequilibrium Seven haplotypes were analyzed in NY and JX cattle breeds, namely Hap1 (TCAACC), Hap2 (TCAATA), Hap3 (TCATCC), Hap4 (TCGACC), Hap5 (TCGATA), Hap6 (TCGTCC), and Hap7 (CTGATA). Frequencies of seven haplotypes of NY were 0.379 (Hap1), 0.046 (Hap2), 0.034 (Hap3), 0.454 (Hap4), 0.034 (Hap5), 0.052 (Hap6), and 0 (Hap7). Haplotype frequencies among JX were 0.093 (Hap1), 0.041 (Hap2), 0 (Hap3), 0.586 (Hap4), 0.258 (Hap5), 0.015 (Hap6), and 0.007 (Hap7). Among them, the frequency of Hap4 was the highest in JX and NY (Table 4). Viewing the linkage disequilibrium of six SNPs (Table 5, Fig. 2), SNP5 and SNP6 had strong linkage (r2>0.33) in both NY and JX, and an LD (linkage disequilibrium) between SNP1 and SNP2 was detected in JX.
3.3 Association analysis
Figure 2.Linkage disequilibrium ofNanoggene polymorphisms in Jiaxian and Nanyang cattle. White squares show weak linkage and red squares show strong linkage.
Table 5.Linkage disequilibrium tests for Nanyang cattle and Jiax-ian cattle.
NY breed: D′andr2: SNP1/SNP2/SNP3/SNP4/SNP5/SNP6
– SNP1 SNP2 SNP3 SNP4 SNP5 SNP6 D′
SNP6 – 0.000 0.000 0.000 0.000 0.000 SNP1
SNP5 1.000 – 0.000 0.000 0.000 0.000 SNP2
SNP4 0.008 0.008 – 0.130 0.207 0.207 SNP3
SNP3 0.004 0.004 0.001 – 1.000 1.000 SNP4
SNP2 0.000 0.000 0.000 0.000 – 1.000 SNP5
SNP1 0.000 0.000 0.000 0.000 0.000 – SNP6
r2 SNP6 SNP5 SNP4 SNP3 SNP2 SNP1 – JX breed: D′andr2: SNP1/SNP2/SNP3/SNP4/SNP5/SNP6
– SNP1 SNP2 SNP3 SNP4 SNP5 SNP6 D′
SNP6 – 1.000 1.000 1.000 0.996 0.996 SNP1
SNP5 1.000 – 1.000 1.000 0.996 0.996 SNP2
SNP4 0.007 0.007 – 1.000 0.002 0.002 SNP3
SNP3 0.000 0.000 0.002 – 1.000 1.000 SNP4
SNP2 0.017 0.017 0.000 0.001 – 1.000 SNP5
SNP1 0.017 0.017 0.000 0.001 1.000 – SNP6
r2 SNP6 SNP5 SNP4 SNP3 SNP2 SNP1 – Note: values of upper triangular show D’ and values of lower triangular representr2.
Table 6.The characteristics of three mutations in theNanoggene in cattle. The numbers in the “traits” column indicate age in months.
Traits (NY) Genotypes (SNP3 G>A) P
GG AA
BSL-6 (cm) 106.79±0.81a 103.25±1.39b 0.022 CC-6 (cm) 130.81±1.17a 126.38±1.62b 0.028
Traits (NY) Genotypes (SNP4 A>T) P
AA AT
BH-6 (cm) 106.29±0.75a 102.30±1.58b 0.031 HW-18 (cm) 23.30±0.27a 21.95±0.36b 0.035
Traits (JX) Genotypes (SNP5 C>T) P
CC CT
BH (cm) 126.69±0.75a 124.31±0.60b 0.028 CaC (cm) 17.71±0.15A 16.98±0.13B 0.002
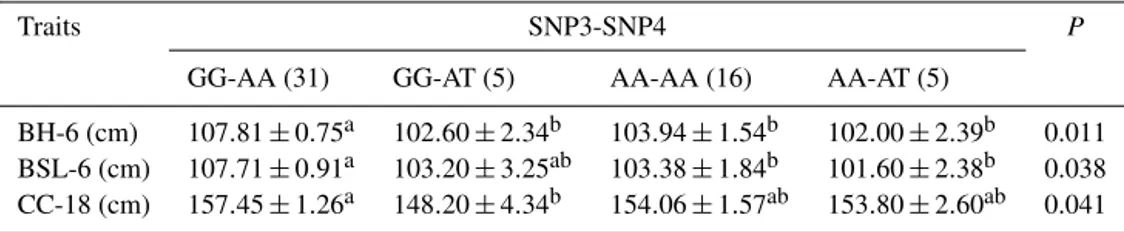
Table 7.Relationship between the combined genotypes of two loci and phenotypes in Nanyang cattle. The numbers in the “traits” column indicate age in months.
Traits SNP3-SNP4 P
GG-AA (31) GG-AT (5) AA-AA (16) AA-AT (5)
BH-6 (cm) 107.81±0.75a 102.60±2.34b 103.94±1.54b 102.00±2.39b 0.011 BSL-6 (cm) 107.71±0.91a 103.20±3.25ab 103.38±1.84b 101.60±2.38b 0.038 CC-18 (cm) 157.45±1.26a 148.20±4.34b 154.06±1.57ab 153.80±2.60ab 0.041
Note: means±standard errors of measurement traits of Nanyang cattle with combined genotype (SNP3–SNP4).a, bValues with different superscripts in the same row differ significantly atP <0.05. BH – body height; BSL – body slanting length; CC – chest circumference.
SNP3-GG and SNP4-AA was found to have a positive effect on body height and body slanting length in 6-month-old NY. Moreover, the combined genotype GG-AA had better chest circumference in 18-month-old NY (Table 7).
4 Discussion
The familiar function of Nanog is that it regulates the
pluripotency of ESCs and induces pluripotent stem cell for-mation (Komatsu et al., 2015). Previous reports showed that iPSC-related Klf4affected adipogenesis through interacting with other genes. Equally,Klf7also affected bovine growth traits and the quality of milk (Ma et al., 2011). The examples
above were evidence to suppose that iPSC-related Nanog
may influence the phenotypes. Therefore, we checked the
ef-fects of six SNPs in theNanoggene on body measurement
traits in cattle in this study.
We found six novel exonic SNPs in four exons of the Nanog gene. Through the χ2 test, SNP1 and SNP2 in all cattle breeds were in HWE; SNP1 and SNP2 did not af-fect growth traits, and artificial selection was not performed among all breeds. SNP3, SNP4, SNP5, and SNP6 were not in HWE in different cattle breeds. The explanation was that artificial selection was performed to acquire better character-istics, and the genetic backgrounds of breeds were different. Although SNP6 was not associated with growth traits, SNP5 and SNP6 were in a strong LD, leading to both of them be-ing selected in artificial selection. The common Hap4 had the highest frequency in both NY and JX, perhaps because Hap4 was present in these breeds for a long time (Zhang et al., 2015). The frequencies of other haplotypes were differ-ent, which may be due to variety distinctiveness (Zhang et al., 2015). SNP5 and SNP6 were in a strong LD in NY and JX, and SNP1 and SNP2 showed strong linkage only in JX. NY and JX belong to special Chinese breeds, but they were raised in different environments, which caused their different genetic backgrounds and heritability. SNP4 caused 189Met to be changed into 189Leu so as to affect measurement traits in NY. SNP3 and SNP5 were synonymous mutations, not changing the sequence of amino acids. However, the growth traits of individuals with SNP3 or SNP5 were better than
those of the wild type (Table 2). Studies have reported that synonymous codon influenced nucleic acid stability, protein levels, structure, and function without altering the amino acid sequence (Bali and Bebok, 2015). The combined genotype of SNP3-GG and SNP4-AA had a positive effect on body height, body slanting length, and chest circumference. Prob-ably, 6-month-old NY with SNP3-GG and SNP4-AA could be selected to obtain better body height and body slanting length; 18-month-old NY could be selected for better chest circumference. Both SNP3 and SNP4 affected the growth traits in this research.
The association testing showed that theNanoggene had
a remarkable effect on growth traits. As far as we know, we are the first to research the relationship between theNanog gene and growth characteristics. For a better comprehension of this study, the possible explanations are listed as follows:
1. The SNP4 was a missense mutation: 189Met>Leu.
The missense mutation with the amino acid change could affect protein structure, resulting in a loss of nor-mal function.
2. Nanogcombines with the binding site of the GDF3 pro-moter and activates the expression of GDF3 in humans, which belongs to TGF-β family and controls the bone morphogenic protein (McPherron and Lee, 1993; Park et al., 2012). GDF3 is also expressed in spleen, thymus, fat, and bone marrow (Hexige et al., 2005) and increases the adipose accumulation in a high-fat diet in mice, via the receptor ALK7 and ALK4 expressing in adipose tis-sue (Andersson et al., 2008). We speculated that the mu-tations of theNanoggene in the coding with a protein structure change possibly regulated GDF3 expression, further impacting growth traits in cattle.
4. GLI1 and GLI3 were able to bind toNanog. The pres-ence ofNanoginhibited GLI transcription, therefore in-hibiting Hedgehog signaling that regulated the home-ostasis of several types of adult tissue (Li et al., 2016).
Possibly, Nanogwas also changed or reduced and
re-moved the inhibition of GLI1.
MAS would develop and improve cattle products. Analyz-ing novel nucleotide variations of the candidate genes and detecting their associations with economic traits are signif-icant for cattle breeding and genetics (Zhang et al., 2015).
Novel SNPs ofNanoghave benefits for implementing MAS
in genetics and the breeding of cattle. The material mecha-nisms ofNanogacting on genes and signal paths are unclear and need to be explored further.
5 Conclusions
To summarize, six novel genetic variations (SNP1–6) were found in this study. Among these, SNP3, SNP4, and SNP5 were associated with growth traits in NY and JX which were beneficial to cattle breeding and genetics through MAS.
6 Data availability
Appendix A: Abbreviations
GDF3 growth and differentiation factor 3
Klf4 Krüppel-like factor 4
TGF-β transforming growth factorβ
iPSCs induced pluripotent stem cells
SNP single nucleotide polymorphism
MAS marker-assisted selection
bp base pair
SPSS statistical product and service solutions
PCR polymerase chain reaction
SSCP single-stranded conformational polymorphism
PCR-RFLP polymerase chain reaction–restriction fragment length polymorphism
HWE Hardy–Weinberg equilibrium
Ho homozygosity
He heterozygosity
Ne effective allele numbers
PIC polymorphism information content
LD linkage disequilibrium
QC Qinchuan cattle
NY Nanyang cattle
JN Jinnan cattle
JX Jiaxian cattle
BH body height
BSL body slanting length
CC chest circumference
HW hucklebone width
Conflict of interest
All authors have no conflict of interest with any finan-cial organization regarding the material discussed in the manuscript.
Author contributions. Meng Zhang conceived the study and wrote the paper. Chuanying Pan performed the experiments. Qin Lin and Shenrong Hu analyzed the data; Ruihua Dang did statis-tical analysis; Chuzhao Lei and Hong Chen collected the samples; Xianyong Lan edited and reviewed the manuscript.
Acknowledgements. This work was supported by the Sci-ence and Technology Overall Project of Shaanxi Province (No.2014KTZB02-02-02-02), Bio-breeding Capacity-building and Industry Specific Projects from the National Development and Reform Commission (2014-2573), the Specific Projects of Science and Technology in Henan Province (141100110200), and the Program of National Beef Cattle and Yak Industrial Technology System (CARS-38).
Edited by: S. Maak
Reviewed by: S. Mekchay and three anonymous referees
References
Andersson, O., Korach-Andre, M., Reissmann, E., Ibáñez, C. F., and Bertolino, P.: Growth/differentiation factor 3 signals through ALK7 and regulates accumulation of adipose tissue and diet-induced obesity, P. Natl. Acad. Sci. USA, 105, 7252–7256, 2008. Bali, V. and Bebok, Z.: Decoding mechanisms by which silent codon changes influence protein biogenesis and function, Int. J. Biochem. Cell B., 64, 58–74, 2015.
Cervantes-Camacho, C., Beltrán-Langarica, A., Ochoa-Uribe, A. K., Marsch-Moreno, M., Ayala-Sumuano, J. T., Velez-delValle, C., and Kuri-Harcuch, W.: The transient expression of Klf4 and Klf5 during adipogenesis depends on GSK3β activity, Adipocyte, 4, 248–255, 2015.
Chen, R., Yu, S., Ren, F., Lv, X. Y., and Pan, C. Y.: Detection of one large insertion/deletion (indel) and two novel SNPs within the
SPEF2 gene and their associations with male piglet
reproduc-tion traits, Arch. Anim. Breed., 59, 275–283, doi:10.5194/aab-59-275-2016, 2016.
Clark, A. T., Rodriguez, R. T., Bodnar, M. S., Abeyta, M. J., Cedars, M. I., Turek, P. J., Firpo, M. T., and Reijo Pera, R. A.: Human STELLAR, NANOG, and GDF3 genes are expressed in pluripo-tent cells and map to chromosome 12p13, a hotspot for teratocar-cinoma, Stem Cells, 22, 169–179, 2004.
Emigh, T. H.: A Comparison of Tests for Hardy–Weinberg Equilib-rium, Biometrics, 36, 627–642, 1980.
Hexige, S., Guo, J. H., Ma, L. X., Sun, Y., Liu, X. H., Ma, L. J., Yan, X. M., Li, Z. J., and Yu, L.: Expression pattern of growth/differentiation factor 3 in human and murine cerebral cor-tex, hippocampus as well as cerebellum, Neurosci. Lett., 389, 83-87, 2005.
Komatsu, K. and Fujimori, T.: Multiple phases in regulation of Nanog expression during pre-implantation development, Dev. Growth Differ., 57, 648–656, 2015.
Lan, X. Y., Pan, C. Y., Chen, H., Zhang, C. L., Li, J. Y., Zhao, M., Lei, C. Z., Zhang, A. L., and Zhang, L.: An AluI PCR-RFLP detecting a silent allele at the goat POU1F1 locus and its asso-ciation with production traits, Small Ruminant Res., 73, 8–12, 2007.
Lan, X. Y., Zhao, H. Y., Li, Z. J., Zhou, R., Jiang, X. W., Han, C. S., Pan, C. Y., Lei, C. Z., and Chen, H.: Exploring novel genetic variant of PITX1 gene and its effect on milk performance in dairy goats, J. Integr. Agricult., 12, 118–126, 2013.
Lei, L., Li, L., Du, F. L., Chen, C. H., Wang, H. Y., and Keefer, C. L.: Monitoring bovine fetal fibroblast reprogramming utilizing a bovine NANOG promoter-driven EGFP reporter system, Mol. Reprod. Dev., 80, 193–203, 2013.
Li, Q., Lex, R. K., Chung, H. W., Giovanetti, S. M., Ji, Z. C., Ji, H. C., Person, M. D., Kim, J., and Vokes, S. A.: NANOG binds to GLI proteins and represses Hedgehog-mediated transcription, J. Biol. Chem., 291, 7171–7182, 2016.
Li, Z. Q., Zhang, Z., He, Z. D., Tang, W., Li, T., Zeng, Z., He, L., and Shi, Y. Y.: A partition-ligation-combination-subdivision EM algorithm for haplotype inference with multiallelic markers: up-date of the SHEsis (http://analysis.bio-x.cn), Cell Res., 19, 519– 523, 2009.
Liang, G. Y. and Zhang, Y.: Genetic and epigenetic variations in iP-SCs: potential causes and implications for application, Cell Stem Cell, 13, 149–159, 2013.
Ma, L., Qu, Y. J., Huai, Y. T., Li, Z. J., Wang, J., Lan, X. Y., Zhang, C. L., Wang, J. Q., and Chen, H.: Polymorphisms identification and associations of KLF7 gene with cattle growth traits, Livest. Sci., 135, 1–7, 2011.
McPherron, A. C. and Lee, S. J.: GDF-3 and GDF-9: two new mem-bers of the transforming growth factor-beta superfamily contain-ing a novel pattern of cysteines, J. Biol. Chem., 268, 3444–3449, 1993.
Nei, M. and Roychoudhury, A. K.: Sampling variances of heterozy-gosity and genetic distance, Genetics, 76, 379–390, 1974. Pan, C. Y., Lan, X. Y., Chen, H., Yang, D. Y., Hua, L. S., Yang, X.
B., Lei, C. Z., Guo, Y. K., Zhang, B., Zhang, C. L., Kang, X. T., and Wang, X. Z.: A DdeI PCR-RFLP detecting a novel missense mutation of POU1F1 gene showed no effects on growth traits in cattle, Czech J. Anim. Sci., 53, 523–527, 2008.
Pan, C. Y., Wu, C. Y., Jia, W. C., Xu, Y., Hu, S. R., Lei, C. Z., Lan, X. Y., and Chen, H.: A critical functional missense mutation (H173R) in the bovine PROP1 gene significantly affects growth traits in cattle, Gene, 531, 398–402, 2013.
Park, S. W., Lim, H. Y., Do, H. J., Sung, B., Huh, S. H., Uhmc, S. J., Song, H., Chung, H. J., Kim, J. H., Kim, N. H., and Kim, J. H.: Regulation of human growth and differentiation factor 3 gene expression by NANOG in human embryonic carcinoma NCCIT cells, FEBS Lett., 586, 3529–3535, 2012.
Rodda, D. J., Chew, J. L., Lim, L. H., Loh, Y. H., Wang, B., and Ng, H. H.: Transcriptional regulation of nanog by OCT4 and SOX2, J. Biol. Chem., 280, 24731–24737, 2005.
Shi, T., Peng, W., Yan, J., Cai, H., Lan, X., Lei, C., Bai, Y., and Chen, H.: A novel 17 bp indel in the SMAD3 gene alters tran-scription level, contributing to phenotypic traits in Chinese cat-tle, Arch. Anim. Breed., 59, 151–157, doi:10.5194/aab-59-151-2016, 2016.
Shi, Y. Y. and He, L.: SHEsis, a powerful software platform for analyses of linkage disequilibrium, haplotype construction, and genetic association at polymorphism loci, Cell Res., 15, 97–98, 2005.
Sumer, H., Liu, J., Malaver-Ortega, L. F., Lim, M. L., Khodadadi, K., and Verma, P. J.: NANOG is a key factor for induction of pluripotency in bovine adult fibroblasts, J. Anim. Sci., 89, 2708– 2716, 2011.
Wang, W., Yang, Y., Meng, Y., and Shi, Y. G.: GDF-3 is an adi-pogenic cytokine under high fat dietary condition, Biochem. Bioph. Res. Co., 321, 1024–1031, 2004.
Yang, F., Zhang, J. L., Liu, Y. J., Cheng, D., and Wang, H. Y.: Structure and functional evaluation of porcine NANOG that is a single-exon gene and has two pseudogenes, Int. J. Biochem. Cell B., 59, 142–152, 2015.
Yeh, F. C., Yang, R., and Boyle, T.: POPGENE Version 3.1, Mi-crosoft Window-based Freeware for Population Genetic Analy-sis, Edmonton, AB, Canada, University of Alberta, 1999. Zhang, X. Y., Wu, X. F., Jia, W. C., Pan, C. Y., Li, X. C., Lei, C.
Z., Chen, H., and Lan, X. Y.: Novel Nucleotide variations, haplo-types structure and associations with growth related traits of goat AT motif-binding factor (ATBF1) gene, Asian Austral. J. Anim., 10, 1394–1406, 2015.