www.atmos-chem-phys.net/7/453/2007/ © Author(s) 2007. This work is licensed under a Creative Commons License.
Chemistry
and Physics
Classification of aerosol properties derived from AERONET direct
sun data
G. P. Gobbi1, Y. J. Kaufman2, I. Koren3, and T. F. Eck4,*
1Inst. Scienze dell’ Atmosfera e del Clima, CNR, Rome, Italy
2NASA/Goddard Space Flight Center, 613.2, Greenbelt MD 20771, USA 3Dep. of Environ. Sciences Weizmann Institute, Rehovot 76100, Israel 4GEST, University of Maryland, Baltimore, MD, USA
*also at: NASA/GSFC, 614.4, Greenbelt MD 20771, USA
Received: 25 July 2006 – Published in Atmos. Chem. Phys. Discuss.: 14 September 2006 Revised: 14 December 2006 – Accepted: 27 December 2006 – Published: 25 January 2007
Abstract. Aerosol spectral measurements by
sunphotome-ters can be characterized by three independent pieces of in-formation: 1) the optical thickness (AOT), a measure of the column aerosol concentration, 2) the optical thickness aver-age spectral dependence, given by the Angstrom exponent (α), and 3) the spectral curvature ofα(δα). We propose a simple graphical method to visually convert (α, δα)to the contribution of fine aerosol to the AOT and the size of the fine aerosols. This information can be used to track mixtures of pollution aerosol with dust, to distinguish aerosol growth from cloud contamination and to observe aerosol humidifi-cation. The graphical method is applied to the analysis of yearly records at 8 sites in 3 continents, characterized by dif-ferent levels of pollution, biomass burning and mineral dust concentrations. Results depict the dominance of fine mode aerosols in driving the AOT at polluted sites. In stable me-teorological conditions, we see an increase in the size of the fine aerosol as the pollution stagnates and increases in op-tical thickness. Coexistence of coarse and fine particles is evidenced at the polluted sites downwind of arid regions.
1 Introduction
The aerosol optical thickness at wavelengthλ(AOT(λ)≡τλ) is a standard parameter measured by sunphotometers like the ones operating in the AERONET (Holben et al., 1998, http://aeronet.gsfc.nasa.gov). τλrepresents the extinction of radiation of wavelengthλthat results from the presence of atmospheric aerosols. The Angstr¨om exponentαrepresents
Correspondence to:G. P. Gobbi
the slope of the wavelength dependence of the AOT in loga-rithmic coordinates (Angstrom, 1929):
α(λ1, λ2)= −ln(τλ2/τλ1)/ln(λ2/λ1) (1) In the solar spectrum,αis a good indicator of the size of the atmospheric particles determining the AOT:α>1 are mainly determined by fine mode, submicron aerosols, while α<1 are largely determined by coarse, supermicron particles (e.g., Kaufman et al., 1994). The Angstrom parameter is com-monly employed in operational sunphotometry. However,α
alone does not provide unambiguous information on the rela-tive weight of coarse and fine modes in determining the AOT. Large fine mode particles can have the sameαas mixtures of coarse mode and small fine mode ones. We shall demonstrate this with examples in the next section.
Several authors have discussed how the spectral varia-tion of the Angstrom exponent can provide further informa-tion about the aerosol size distribuinforma-tion (King et al., 1978; Nakajima et al., 1986; Kaufman, 1993; Eck et al., 1999; O’Neill et al., 2001a, b, 2003; Schuster et al., 2006). Kauf-man (1993) pointed-out that negative values of the difference
δα=α(440,613)−α(440,1003) indicate the dominance of fine mode aerosols, while positive differences indicate the effect of two separate particle modes. Eck et al. (1999) have shown how in the wavelength range 380–870 nm, α
-1 -0.5 0 0.5 1
0 0.5 1 1.5 2
Aerosol growth 0.15µm, 70% Aerosol Growth 0.10 µm, 50% Cloud contamination 0.1 µm, 90% Cloud contamination 0.15 µm, 70%
Ångström exponent
Ångström difference
0.05 µm
0.10 µm
0.15 µm 0.2 µm
0.3 µm 0.4 µm 0.5 µm
1%
10%
30% 50%
70%
90%
99%
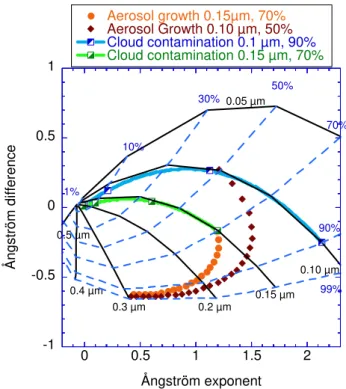
Fig. 1.Simulations of the classification of the aerosol properties as a function of the Angstr¨om exponentα(440, 870) and the differ-enceδα=α(440,675)−α(675,870), for bimodal, lognormal size distributions with refractive indexm=1.4–0.001i. The black solid lines are each for a fixed size of the fine modeRf and the dashed blue lines for a fixed fraction contributionηof the fine mode to the AOT at 675 nm. Split squares represent the effects of a cloud con-tamination of 0, 50, 90 and 99% in the AOT of two grid points: 1)η=70%,Rf=0.15 (bright green line) and 2)η=90%, Rf=0.1 (turquoise line). This contamination results in a departure from the original grid points along the constantRf lines and towards the origin. Conversely, hydration of the aerosol fine mode (two starting conditions simulated: 1)η=50%,Rf=0.1 (brown diamonds), and 2) η=70%,Rf=0.15 (orange circles)) is accompanied by a movement towards the origin along the opposite direction, with concurrent in-crease inRf andη.
Here we build upon the concept of Kaufman (1993) to pro-pose a new, straight-forward graphical framework that, on the basis of three spectral AOT observations, allows to: 1) infer aerosol fine mode size (Rf) and fractional contribution to to-tal AOT (η), and 2) separate AOT increases due to aerosol humidification from AOT increases due to the addition of coarse particles as in the case of cloud contamination. To this end, we classify the aerosols in a new space, AOT vs.δα
vs.α. This space is invariant to the bulk AOT namely, the space is invariant to changes in AOT for a given size distri-bution. Any AOT will be in the same point if the fine and coarse modes stays the same. This space is sensitive to the balance between the fine and coarse modes and therefore is ideal to separate processes related to aerosol fine size from extinction fraction. Cloud contamination will enhance the weight of the coarse mode while humidification will increase
the fine mode. Overall, this method provides an additional tool to interpret in terms of size-dependent properties, direct-sun observations of aerosol spectral extinction.
2 Aerosol classification
Unsupervised classification of aerosol using numerous mea-surements of the spectral optical thickness can supplement aerosol properties derived from less frequent multi-angle sky radiance inversions (e.g., Dubovik and King, 2000; Dubovik et al., 2002). We define the Angstr¨om exponent difference
δα=α(440,675)−α(675,870)as a measure of the Angstr¨om exponent curvaturedα/dλ. Choice of the 440–870 nm wave-length range relies on the fact that these are highly accu-rate channels (dτλ∼0.01) of the AERONET sunphotome-ters (Eck et al., 1999; Holben et al., 1998) and these chan-nels are available in all AERONET instruments. The δα
vs. α(440, 870) space (also addressed here as AdA coor-dinates) will be our framework for analyzing aerosol proper-ties. In these coordinates, we further classify aerosols by rep-resenting their AOT by different colors. Since bothα(440, 870) andδαare derived fromτλ, propagation of errors indi-cates the relevant indetermination to be1α/α∼21τλ/τλand
1δα/δα∼51τλ/τλ, respectively. This converts to errors of
≥20% and≥50% inαandδαforτλ≤0.10. To avoid errors larger than ∼30%, this work employs only observations of AOT>0.15.
The classification framework is explained with the help of Fig. 1. To interpret data in these coordinates, we deter-mine reference points corresponding to bimodal size distri-butions characterized by a variety of fine mode (Rf) and coarse mode (Rc)modal radii combined to lead to prescribed fractions (η)of the fine mode to total AOT (at 675 nm). To this end, we performed Mie calculations of the aerosol spec-tral extinction forRf values of 0.05, 0.1, 0.15, 0.2, 0.3 and 0.5µm, forRcvalues of 0.75, 1, 2, and 4µm, and combined them to provideηfractions of 1, 10, 30, 50, 70, 90 and 99%. Each of the two modes (i) is assumed to have a log-normal size distribution:
dNi/dlnr= [Nci/((2π )
1 2lnσi)]
a single (η,Rf)combination. Therefore, each (η,Rf)grid point plotted in our figures represents the average of the rel-evant coarse modes results. Following the climatology of Dubovik et al. (2002), computations were made for refrac-tive index typical of urban/industrial (m=1.40–0.001i) and mineral dust aerosols (m=1.53–0.003i), plus water droplets (m=1.33–0.000i).
Possible non-sphericity of particles is not expected to im-pact significantly on these results. Generally speaking, non-spherical aerosols introduce an AOT change smaller than 15% with respect to spherical ones (e.g., Mishchenko et al., 1997). In particular, supermicron non-spherical particles tend to generate similar extinction as spherical ones, with AOT differences between the three wavelengths (namely, 440, 670 and 870 nm) of less than 5%, rapidly decreasing to 0% for increasing sizes.(e.g., Figs. 4, 5 and 6 in Mishchenko et al., 1997). Conversely, fine mode non-spherical particles are characterized by similar losses in extinction (with respect to spherical ones) at all the three wavelengths. (e.g., Figs. 4, 5 and 6 in Mishchenko et al., 1997), then leading to a mi-nor impact on the Angstrom coefficients. On these basis, we expect this approach not to be significantly affected by the aerosol shape.
Grid points relevant to Mie calculations form=1.4–0.001i, plotted in the AdA coordinates (Fig. 1 and Table 1) show there is close to orthogonality of the aerosol fine sizeRf and extinction fractionη, i.e., we have good conditions for infer-ence of these two parameters. Cloud contamination cases are computed by adding to the original size distributions a 10µm mode (m=1.33–0.0i) generating 50, 90 and 99% of the con-taminated optical thickness, respectively. Figure 1 shows the effects of such contamination for two cases starting at: 1)
η=70%,Rf=0.15 (bright green line) and 2)η=90%,Rf=0.1 (turquoise line), respectively. The three levels of contami-nation are represented by the split square symbols moving towards the origin along the colored, constantRf lines. That is, only a cloud contamination of the AOT larger than 90% will be located atα∼δα∼0. Cloud contamination or increase in coarse aerosols have similar effects in the AdA coordi-nates. It is a goal of the cloud screening process (e.g, Kauf-man et al., 2006) to exclude cloud-affected observations from the database in order to analyze aerosol data alone.
Aerosol hydration has been simulated by incremental growth of the fine modeRf (dRf steps=0.01µm) accom-panied by dilution of the refractive index. In Fig. 1, two cases are shown to represent the patterns of hydration in the AdA coordinates for distributions withm=1.4–0.001i start-ing from, (η=50%, Rf=0.1) and from (η=70%, Rf=0.15), respectively. As expected, hydration leads to a growth in both
Rf andη. In the AdA coordinates this results in a movement in the opposite direction with respect to cloud contamina-tion. This implies that even though aging and humidification of pollution aerosol and cloud contamination both decrease
α, they behave quite differently in the AdA coordinates, thus allowing for easy identification.
-1 -0.5 0 0.5 1
0 0.5 1 1.5 2
Ångström difference
Ångström exponent 50%
70% 30%
10%
1%
90%
99%
0.05 µm
0.10 µm
0.15 µm 0.20 µm
0.3 µm 0.4 µm
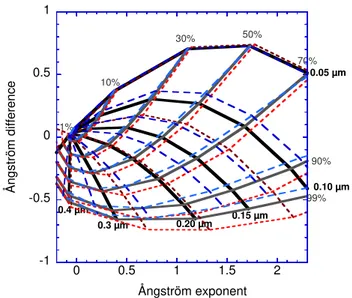
Fig. 2. Comparison of the m=1.40–0.001i grid (black/gray lines) with grids obtained for refractive indices m=1.33–0.000i (blue/pale-blue dashes), andm=1.53–0.003i(brown/red dashes).
Figure 2 illustrates the sensitivity of the classification scheme to refractive index. Computations indicate some clockwise rotation about the origin of the constant radius curves for increasing refractive index. The effect is much weaker in the case of theηcurves. For a given point (α,δα)
maximumRf indetermination is of the order of±25% for refractive index varying betweenm=1.33–0.0iandm=1.53– 0.003i. At the same time, the fine mode extinction fraction,
ηspans a range of the order of±10%. Within this level of indetermination, the scheme is robust enough to provide an operational classification of the aerosol properties. Indeed, other grids can be computed by varying aerosol properties (e.g., modal radii and refractive index) or size distribution parameters. However, the simulations presented in Fig. 2 ad-dress most common aerosol typologies (e.g., Dubovik et al., 2002) and are intended to demonstrate the capability of this graphical approach at evaluating the climatology of aerosol size-related properties on the basis of standard photometric observations.
3 Application to AERONET data
-1 -0.5 0 0.5 1
Ångström difference
Beijing, 2003
0.05 µm
0.10 µm
0.15 µm 0.2 µm 0.3 µm
0.4 µm 0.5 µm
1% 10%
30% 50%
70%
90%
99%
-1 -0.5 0 0.5 1
Ångström difference
Kanpur, 2001
0.05 µm
0.10 µm
0.15 µm 0.2 µm 0.3 µm
0.4 µm 0.5 µm
1% 10%
30% 50%
70%
90%
99%
0.3>AOT>0.15 0.4>AOT>0.3
0.7>AOT>0.4
1.0>AOT>0.7
1.5>AOT>1.0 2>AOT>1.5 3>AOT>2 AOT>3 Rome, 2003
0.05 µm
0.10 µm
0.15 µm 0.2 µm 0.3 µm
0.4 µm 0.5 µm
1% 10%
30%
50%
70%
90%
99%
Ispra 2002
0.05 µm
0.10 µm
0.15 µm 0.2 µm 0.3 µm
0.4 µm 0.5 µm
1% 10%
30% 50%
70%
90%
99%
-1 -0.5 0 0.5 1
Ångström difference
Mexico 2004
0.05 µm
0.10 µm
0.15 µm 0.2 µm 0.3 µm
0.4 µm 0.5 µm
1% 10%
30% 50%
70%
90%
99%
0 0.5 1 1.5 2
-1 -0.5 0 0.5 1
Ångström exponent Mongu, 2003
Ångström difference
0.05 µm
0.10 µm
0.15 µm 0.2 µm 0.3 µm
0.4 µm 0.5 µm
1% 10%
30% 50%
70%
90%
99%
GSFC 2004
0.05 µm
0.10 µm
0.15 µm 0.2 µm 0.3 µm
0.4 µm 0.5 µm
1% 10%
30% 50%
70%
90%
99%
0 0.5 1 1.5 2
Ångström exponent Alta Floresta, 2001
0.05 µm
0.10 µm
0.15 µm 0.2 µm 0.3 µm
0.4 µm 0.5 µm
1% 10%
30% 50%
70%
90%
99%
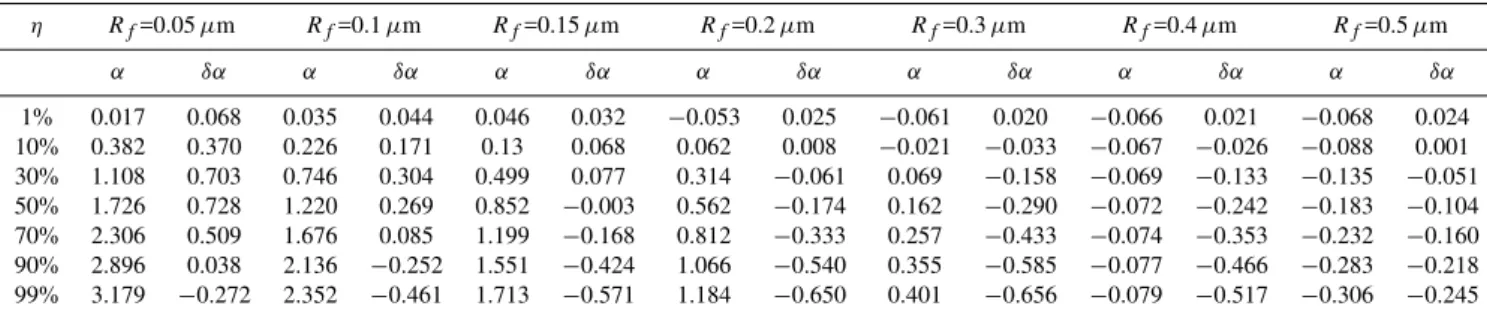
Table 1.Computedαandδαgrid points as a function ofRf andηvalues for refractive indexm=1.4–0.001i.
η Rf=0.05µm Rf=0.1µm Rf=0.15µm Rf=0.2µm Rf=0.3µm Rf=0.4µm Rf=0.5µm
α δα α δα α δα α δα α δα α δα α δα
1% 0.017 0.068 0.035 0.044 0.046 0.032 −0.053 0.025 −0.061 0.020 −0.066 0.021 −0.068 0.024 10% 0.382 0.370 0.226 0.171 0.13 0.068 0.062 0.008 −0.021 −0.033 −0.067 −0.026 −0.088 0.001 30% 1.108 0.703 0.746 0.304 0.499 0.077 0.314 −0.061 0.069 −0.158 −0.069 −0.133 −0.135 −0.051 50% 1.726 0.728 1.220 0.269 0.852 −0.003 0.562 −0.174 0.162 −0.290 −0.072 −0.242 −0.183 −0.104 70% 2.306 0.509 1.676 0.085 1.199 −0.168 0.812 −0.333 0.257 −0.433 −0.074 −0.353 −0.232 −0.160 90% 2.896 0.038 2.136 −0.252 1.551 −0.424 1.066 −0.540 0.355 −0.585 −0.077 −0.466 −0.283 −0.218 99% 3.179 −0.272 2.352 −0.461 1.713 −0.571 1.184 −0.650 0.401 −0.656 −0.079 −0.517 −0.306 −0.245
screening of this dataset has been applied according to Kauf-man et al. (2006) for α>0.3, and as AERONET level 1.5 for α<0.3. To both provide a common reference and ad-dress the relative changes at each location (fine mode growth or coarse particle contamination) we employed them=1.4– 0.001i grid for all cases. The Beijing data show very high AOTs. (>2), mainly clustering in the fine mode growth wing (α<1.3,δα<0). This wing is present at various levels also in Kanpur, Ispra, GSFC and Mexico City, locations character-ized by rather heavy pollution but lower AOT than Beijing. High extinctions at these sites are then linked in many cases to a hygroscopic and/or coagulation growth from aging of the fine mode aerosols. At the same time coarse particles, likely mineral dust, superimpose their signal onto the pollution sig-nature in Beijing and Kanpur.
For Beijing we have “typical pollution” with AOT>0.7 andα∼1.4 (dark green concentration) that corresponds to a fine fraction of∼75% andRf∼0.14µm. As shown in Fig. 1, to take this aerosol and to contaminate it with clouds means to move along a line parallel to the black line of 0.15µm, with an increasing apparent AOT. This is not what we see in Fig. 3. The extension of the Beijing pollution to higher AOTs happens perpendicularly to the black line, into larger size of the fine mode and fine fraction mainly between 70 and 90%. Even in the presence of the coarse (likely dust) parti-cles, AOT growth in many cases remains associated to fine mode growth. Such a coexistence of mineral dust and high pollution levels in Beijing is confirmed by the yearly particle analysis of Zheng et al. (2005). Similar conditions are also reported for Kanpur by Chinnam et al. (2006).
Alta Floresta, a site characterized by high biomass burn-ing, provides a nice example of cloud contamination: the whole dataset shows a very coherent fine mode of 0.10– 0.13µm with concurrent increase in AOT and coarse mode fraction taking place exactly along the constantRf curves. In fact, both Alta Floresta and Mongu (the other biomass-burning location) are sites with cloud contamination well hidden in the data, therefore difficult to remove even by wavelength dependent cloud screening (Kaufman et al., 2006). Overall, the two AdA plots of Mongu and Alta Floresta show smaller Rf values at Mongu and also show
greaterδα values at Mongu that result in part from greater aerosol absorption (higher black carbon fraction) at this lo-cation (Eck et al., 2001).
In terms of coarse mode effects, Rome presents similar-ities with Beijing and Kanpur (e.g., Fig. 3). However, the fine mode is never observed to grow as in Beijing, and AOT mostly remains a factor of 2–4 times lower than in these two cities. The Rome AERONET station is located at the outskirts of the city, in a region where Saharan dust advec-tion is recorded∼20–30% of the time (Barnaba and Gobbi, 2004). Measurements clustering at higher Angstrom coeffi-cients than in Beijing also denote a smaller size of the fine aerosols and less a persistent coarse mode. As expected from the MODIS observations (Barnaba and Gobbi, 2004), in spite of being only 400 km North of Rome, Ispra shows almost no sign of dust impact on its record. Conversely, fine mode growth is more evident at this site in part due to air stagna-tion in a mountain-surrounded valley (the Po valley is one of Europe’s most polluted regions, e.g., Melin and Zibordi, 2005). In fact, high-pollution locations such as Ispra, Mex-ico City and GSFC have their measurements clustering in the
α∼1.5,δα∼−0.5 region, with growing AOT linked to both coagulation-aging and hydration-type increase in Rf. It is then reasonable to associate to aged pollution haze formation the branching of data along constantηlines.
4 Conclusions
iden-tify various aerosol properties peculiar to these locations. Data from Beijing (China) and Kanpur (India) confirmed these locations to be affected by superposition of dust, and high pollution conditions. At both sites it is pollution haze (fine mode aerosols) that generates the largest aerosol loads, reaching AOT levels >2 in Beijing. The method allowed for easy identification of the mineral dust fingerprint in the Rome (Italy) data, while confirming the absence of a signifi-cant contribution of dust at the Ispra site, located just 400 km North. Growing haze appears in this framework as a branch-ing along higher fine mode radius and extinction fraction. Conversely, locations where biomass burning represents the main source of aerosols showed limited hygroscopic growth of fine mode particles, and a rather focused range of fine mode size (dRf∼0.05µm). In these cases, some cloud con-tamination was observed at the two sites of Alta Floresta (Brazil) and Mongu (Zambia). Overall, the analysis scheme provides an additional, versatile tool to characterize aerosol properties and to explore the important aerosol-cloud border region by means of easily accessible, direct sun photometric observations.
Acknowledgements. This work was initiated while Yoram Kauf-man was visiting ISAC Rome in the Autumn of 2005. Yoram passed away on May 31, 2006. Here we wish to acknowledge Yoram’s intuition, curiosity, generosity and creative energy. This paper in large part is the fruit of his many talents. Special thanks to the AERONET groups who kindly provided their data. Part of this research was supported by the EU ACCENT Network. I.K. is incumbent of the Benjamin H. Swig and Jack D. Weiler career development.
Edited by: T. Wagner
References
Angstrom, A.: On the atmospheric transmission of sun radiation and on dust in the air, Geogr. Ann., 11, 156–166, 1929. Barnaba, F. and Gobbi, G. P.: Aerosol seasonal variability over the
Mediterranean region and relative impact of maritime, continen-tal and Saharan dust particles over the basin from MODIS data in the year 2001, Atmos. Chem. Phys., 4, 2367–2391, 2004, http://www.atmos-chem-phys.net/4/2367/2004/.
Chinnam, N., Dey, S., Tripathi, S. N., and Sharma, M.: Dust events in Kanpur, northern India: Chemical evidence for source and im-plications to radiative forcing, Geophys. Res. Lett., 33, L08803, doi:10.1029/2005GL025278, 2006.
Dubovik, O. and King, M. D.: A flexible inversion algorithm for retrieval of aerosol optical properties from Sun and sky radiance measurements, J. Geophys. Res., 105, 20 673–20 696, 2000. Dubovik, O., Holben, B. N., Eck, T. F., Smirnov, A., Kaufman, Y.
J., King, M. D., Tanre, D., and Slutsker, I.: Variability of ab-sorption and optical properties of key aerosol types observed in worldwide locations, J. Atmos. Sci., 59, 590–608, 2002.
Eck, T. F., Holben, B. N., Reid, J. S., Dubovik, O., Smirnov, A., O’Neill, N. T., Slutsker, I., and Kinne, S.: Wavelength depen-dence of the optical depth of biomass burning, urban, and desert dust aerosols, J. Geophys. Res., 104, 31 333–31 349, 1999. Eck, T. F., Holben, B. N., Ward, D. E., Dubovik, O., Reid, J. S.,
Smirnov, A., Mukelabai, M. M., Hsu, N. C., O’Neill, N. T., and Slutsker, I.: Characterization of the optical properties of biomass burning aerosols in Zambia during the 1997 ZIBBEE field cam-paign, J. Geophys. Res., 106, 3425–3448, 2001.
Holben, B. N., Eck, T. F., Slutsker, I., Tanre, D., Buis, J. P., Set-zer, A., Vermote, E., Reagan, J. A., Kaufman, Y. J., Nakajima, T., Lavenu, F., Jankowiak, I., and Smirnov, A.: AERONET – A federated instrument network and data archive for aerosol char-acterization, Rem. Sens. Environ., 66, 1–16, 1998.
Kaufman, Y. J.: Aerosol optical thickness and atmospheric path ra-diance, J. Geophys. Res., 98(D2), 2677–2692, 1993.
Kaufman, Y. J., Gobbi, G. P., and Koren, I.: Aerosol cli-matology using a tunable spectral variability cloud screen-ing of AERONET data, Geophys. Res. Lett., 33, L07817, doi:10.1029/2005GL025478, 2006.
King, M. D., Byrne, D. M., Herman, B. M.: Aerosol size distri-bution obtained by inversion of spectral optical depth measure-ments, J. Atmos. Sci., 35, 2153–2167, 1978.
M´elin F. and Zibordi, G.: Aerosol variability in the Po Valley an-alyzed from automated optical measurements, Geophys. Res. Lett., 32, L03810, doi:10.1029/2004GL021787, 2005.
Mishchenko, M. I, Travis, L. D., Kahn, R. A., and West, R. A.: Modeling Phase Functions for dustlike tropospheric aerosols us-ing a shape mixture of randomly oriented polydisperse spheroids, J. Geophys. Res., 102(D14), 16 831–16 847, 1997.
Nakajima, T., Takamura, T., Yamano, M.: Consistency of aerosol size distributions inferred from measurements of solar radiation and aerosols, J. Met. Soc. Jap., 64, 765–776, 1986.
Nakajima, T. and King, M. D.: Determination of the optical thick-ness and effective particle radius of clouds from reflected solar radiation measurements. Part I: Theory, J. Atmos. Sci., 47, 1878– 1893 1990.
O’Neill, N. T., Dubovik, O., and Eck, T. F.: A modified Angstrom coefficient for the characterization of sub-micron aerosols, Appl. Opt., 40, 2368–2375, 2001a.
O’Neill, N. T., Eck, T. F., Holben, B. N., Smirnov, A., and Dubovick, O.: Bimodal size distribution influences on the varia-tion of Angstrom derivatives in spectral and optical depth space, J. Geophys. Res., 106(D9), 9787–9806, 2001b.
O’Neill, N. T., Eck, T. F., Smirnov, A., Holben, B. N., and Thulasiraman, S.: Spectral discrimination of coarse and fine mode optical depth, J. Geophys. Res., 108(D17), 4559, doi:10.1029/2002JD002975, 2003.
O’Neill, N. T., Thulasiraman, S., Eck, T. F., and Reid, J.S.: Robust optical features of fine mode size distributions: Application to the Quebec smoke event of 2002, J. Geophys. Res., 110, D11207, doi:10.1029/2004JD005157, 2005.
Schuster, G. L., Dubovick, O., and Holben, B. N.: Angstrom ex-ponent and bimodal aerosol size distributions, J. Geophys. Res., 111, D07207, doi:10.1029/2005/JD006328, 2006.