Impacts of Risk Factors in Complex Data: Understanding
Health and Socioeconomic Inequalities in Childhood
Educational Attainments
Shang-Ming Zhou1*", Ronan A. Lyons1
, Owen G. Bodger1, Ann John1, Huw Brunt2, Kerina Jones1, Mike B. Gravenor1", Sinead Brophy1"
1Institute of Life Science, College of Medicine, Swansea University, Swansea, United Kingdom,2Public Health Wales, Temple of Peace and Health, Cathays Park, Cardiff, United Kingdom
Abstract
Although inequalities in health and socioeconomic status have an important influence on childhood educational performance, the interactions between these multiple factors relating to variation in educational outcomes atmicro-levelis unknown, and how to evaluate the many possible interactions of these factors is not well established. This paper aims to examine multi-dimensional deprivation factors and their impact on childhood educational outcomes at micro-level, focusing on geographic areas having widely different disparity patterns, in which each area is characterised by six deprivation domains (Income,Health,Geographical Access to Services,Housing,Physical Environment, andCommunity Safety). Traditional health statistical studies tend to use one global model to describe the whole population formacro-analysis. In this paper, we combine linked educational and deprivation data across small areas (median population of 1500), then use a local modellingtechnique, the Takagi-Sugeno fuzzy system, to predict area educational outcomes at ages 7 and 11. We define two new metrics, ‘‘Micro-impact of Domain’’ and ‘‘Contribution of Domain’’, to quantify the variations of local impacts of multidimensional factors on educational outcomes across small areas. The two metrics highlight differing priorities. Our study reveals complex multi-way interactions between the deprivation domains, which could not be provided by traditional health statistical methods based on single global model. We demonstrate that althoughIncomehas an expected central role, all domains contribute, and in some areasHealth,Environment,Access to Services,HousingandCommunity Safetyeach could be the dominant factor. Thus the relative importance of health and socioeconomic factors varies considerably for different areas, depending on the levels of each of the other factors, and therefore each component of deprivation must be considered as part of a wider system. Childhood educational achievement could benefit from policies and intervention strategies that are tailored to the local geographic areas’ profiles.
Citation:Zhou S-M, Lyons RA, Bodger OG, John A, Brunt H, et al. (2014) Local Modelling Techniques for Assessing Micro-Level Impacts of Risk Factors in Complex Data: Understanding Health and Socioeconomic Inequalities in Childhood Educational Attainments. PLoS ONE 9(11): e113592. doi:10.1371/journal.pone.0113592
Editor:David O. Carpenter, Institute for Health & the Environment, United States of America ReceivedJanuary 17, 2014;AcceptedOctober 29, 2014;PublishedNovember 19, 2014
Copyright:ß2014 Zhou et al. This is an open-access article distributed under the terms of the Creative Commons Attribution License, which permits unrestricted use, distribution, and reproduction in any medium, provided the original author and source are credited.
Funding:The work was undertaken with the support of The Centre for the Development and Evaluation of Complex Interventions for Public Health Improvement (DECIPHer), a UKCRC Public Health Research Centre of Excellence. Joint funding (MR/KO232331/1) from the British Heart Foundation, Cancer Research UK, Economic and Social Research Council, Medical Research Council, the Welsh Government and the Wellcome Trust, under the auspices of the UK Clinical Research Collaboration, is gratefully acknowledged. This research was also supported by the Farr Institute of Health Informatics Research. The Farr Institute is funded by a consortium of ten UK research organizations (MR/K006525/1): Arthritis Research UK, the British Heart Foundation, Cancer Research UK, the Economic and Social Research Council, the Engineering and Physical Sciences Research Council, the Medical Research Council, the National Institute of Health Research, the National Institute for Social Care and Health Research (Welsh Government), and the Chief Scientist Office (Scottish Government Health Directorates). The funders had no role in study design, data collection and analysis, decision to publish, or preparation of the manuscript.
Competing Interests:The authors have declared that no competing interests exist. * Email: [email protected]
"SMZ, MBG, and SB are joint lead authors on this work.
Introduction
Increasing evidence shows that childhood health and socioeco-nomic inequalities have strong impact on educational attainments [1]–[7]. It is often the case, however, that existing studies focus on
the impact ofeither healthorsocioeconomic status, and research
results are often obtained at a macro-level, whereas the subtle
analysis of risk factor interactions at amicro-levelacross different
subgroups is much less understood in epidemiological and public health studies. Such considerations might reveal more complex relationships and provide important insights for targeted policy
development and intervention. However, currently few statistical analytics methods and modelling techniques can fulfil the tasks of
conducting subtle analysis of risk factor interactions at the
many areas [9]–[11], but few studies have examined the roles of TS fuzzy models in characterising subtle relationships between inputs and output across local data regions. There are a number of challenges in applying TS fuzzy models to local characterisation of data space. First, the number of TS fuzzy rules (corresponding to local linear models) increases exponentially along with the growth
of the number of independent variables (thecurse of
dimension-ality). In order to tackle this challenge, Zhou et al proposed a method of constructing compact TS model [12], in which the redundant local linear models (LLMs) are removed, and only important ones are used in the final model. Second, currently there are no effective analytic tools for TS fuzzy models to quantitatively assess the impacts of input variables on output across different local data regions. To this end, this paper proposes
two new metrics: One is called ‘‘Micro-impact of Domain’’ (MiD)
to assess the expected impact of changes in an input variable on outcome at a micro-level by fusing the coefficients of dominated LLM and all other LLMs in a given data sub-region. We further
propose a second metric: ‘‘Contribution of Domain’’ (CoD) to
assess the gross contribution of each domain at the corresponding sub-region.
Using the two new metrics we aim to provide new insights into the complex relationships between health and socioeconomic status, and educational attainments at the small area level based on data linked across routine databases. The significance of research on area-based effects lies in the need to focus public health and socioeconomic promotion initiatives on the broader characteristics of places where disadvantaged people live [13]–[20]. Understand-ing how drivers such as poor health, poor housUnderstand-ing, poor local environment, unstable communities and poor public service support, interact to create a cycle of decline and underachieve-ment is vital to identify the most appropriate policy responses.
Materials and Methods
Indices of childhood deprivation
We performed a cross-sectional study linking routine data from the Welsh Child Index for Multiple Deprivation (WCIMD) [21] with data from the UK National Pupil Database (NPD) [22]. In the UK, a considerable amount of data is produced at the so-called Lower Super Output Area (LSOA) level. LSOAs have a median population of approximately 1500 people, and were created by the UK Office for National Statistics as permanent census geogra-phies, taking into account population size, proximity, and social homogeneity [23].
A variety of indices of area level deprivation have been created for LSOAs, by governments in different parts of the UK. The WCIMD was designed specifically for childhood policy develop-ment as part of the Neighbourhood Statistics programme in England and Wales, UK [21]. The WCIMD is based on seven
separate domains of deprivation: Income, Health, Access
(Geo-graphic) to Services,Housing,Physical Environment,Community SafetyandEducation(including skills and training) at the LSOA level [21]. The indicators for each domain are based on comprehensive and robust criteria, and are regularly updated. The 2008 recently revised version of WCIMD [24][25] is calculated for each of the 1896 LSOAs across Wales. Each domain of the index is scored on a scale of 0 to 100 (highest level of deprivation) and is itself a composite variable. For example:
Income captures the proportion of children living in households with income below a defined threshold or claiming benefits
relating to low incomes. Health measures the degree to which
children are deprived of good health, as determined by the area prevalence of limiting long-term illness and low birth weight.
Housingcaptures deprivation though lack of central heating and
indicators of overcrowding. Environment represents physical
environmental risk factors that may impact quality of life, including air quality, air emissions, flood risk and proximity to
waste disposal and industrial sites.Access represents deprivation
resulting from difficulties in accessing a range of necessary services (average travel time to primary care centres, schools, libraries,
leisure facilities). Community represents safety, based on police
recorded crime, numbers of youth and adult offenders and incidents of fire. Since our target outcome variable is educational achievement, which is itself a component of the seventh WCIMD
domain, we excluded theEducationcomponent of WCIMD from
our analysis.
Simple investigation of the data may reveal that some of the
domains (e.g.AccessandEnvironment) are not strongly associated
with educational attainment. However, in practice, the indicators used to define the two deprivation indices can potentially have direct or indirect impact on educational performances. For example, long distances to schools and transport nodes could worsen educational performances for children from poor family
backgrounds. TheEnvironmentindicators, such as air quality, can
significantly affect child’s health, then impact educational perfor-mance indirectly. This is particularly true for children with existing poor health conditions. Substantial evidence has shown the adverse effects of exposure to ambient air pollutants on the development of lung function, and aggravation of asthma [26]. These effects may only be apparent at certain local regions, and also in combination (interaction) with other deprivation domains. Such subtle local effects, that are missed at the global level and that may exist across and between all deprivation domains, are the motivation and target of our study.
Educational under-attainment rates
The UK NPD [22] matches information from the Pupil Level Annual School Census (PLASC) with records on key stage (KS) educational attainment. We focused on educational attainment at KS1 (age 6–7) and KS2 (age 10–11). Categorisation is based on whether a pupil attains an expected level of attainment for all three
core subjects: Mathematics, Science, and English or Welsh
(depending on first language). Here, we defined the overall
education under-attainment rate(EUR) at the LSOA level as a proportion, being the total number of children achieving lower than expected levels (KS1 and KS2) divided by the total number of child assessments made during the same period represented by the WCIMD indices. Education data at the LSOA level was collected from anonymised individual records, and linked to deprivation
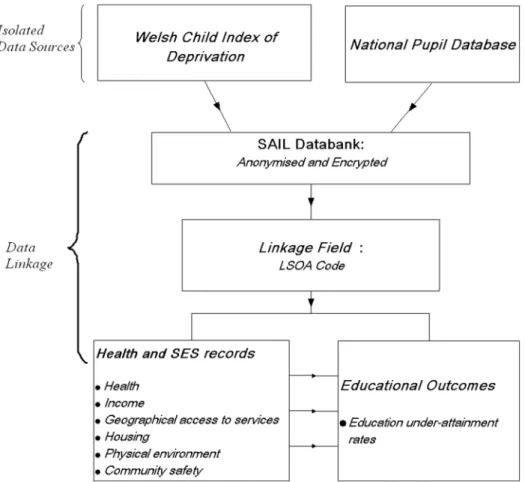
indices, using theSAIL (Secure Anonymised Information Linkage)
databank [27][28] (Figure 1).
TS fuzzy modelling framework
This study is based on a local modelling technique, the TS fuzzy rule system [8] and a recently developed tool suited for detection of complex interactions in epidemiological data [12].
Different from the traditional health statistics for macro analyses, the TS fuzzy system decomposes the whole data space into individual regions, a local linear model (LLM) is fitted in every region, with the overall system output given as a global model which is obtained by fusing the submodels. Specifically, a TS fuzzy model is expressed as follows:
Rulei: Ifx1is Ai,1and xpis Ai,p
where,i~1, ,L,yiis the output variable of theith rule,Ai,jis
a fuzzy set of thejth domain in theith rule, anda0i, ,api are
consequent coefficients of the ith rule. An overall output y is
produced by fusing together theseLLMsyias
y~X L
i~1 ti(x)yi
~X
L
i~1
ti(x)(a0iza1ix1z zapixp)
ð2Þ
where
ti(x)~ri(x) ,
XL
i~1
ri(x) ð3Þ
is the normalized firing strength of the ith rule, andri is usually
defined by
ri(x)~
P
j Ai,j(xj) ð4Þ
in which theAi,j(xj)is the membership function of the fuzzy set
Ai,j. The overall fused system model (2) is also called the global
model. The coefficients determine the size and direction of the effects in the local fuzzy region. For example, for the 6 deprivation
domains, if each is categorized into regions ‘‘high’’ and ‘‘low’’,
there would be 64 ( = 26) sub-regions representing all combinations
of each domain. The overall system output is obtained by fusing the outputs of all these submodels. The output is a predicted (fitted) education under-attainment rate for each LSOA (geo-graphic area).
In essence, we might say ‘‘if all deprivation levels are ‘low’, then
use Rule (LLM) 1’’. But in practice we wish to utilise our continuous data for deprivation, and might not be able to confidently classify each deprivation level as ‘low’. Therefore the
specific LSOA prediction is obtained as a weighted average ofall
LLMs with the weights determined by how closely the specific LSOA fits into each sub-region characterised by fuzzy sets. The complexity of the model is reduced, by fitting local simple models
to partitions of the data space, amicro characterizations of input
space[29][30]. In practice, one may tend to find a dominant rule for each sub-region. In this manner, TS rule modelling technique offers a novel way of revealing the subtle relationships between independent variables (inputs, the domains of deprivation) and dependent variable (output, the education under attainment rate) across very many small geographic regions.
Although the method is appealing, a cost is the ‘‘curse of dimensionality’’ whereby for many variables or sub-regions, there may be a large number of LLMs, which can lead to over-fitting and poor out-of-sample performance. Zhou et al have developed a method to identify a parsimonious set of rules that capture the key interactions between the variables whilst avoiding such over-fitting [12].
Figure 1. Linkage of data from Welsh Child Index of Multiple Deprivation with educational outcomes (under-attainment rate) at Lower Super Output Area level via Secure Anonymised Information Linkage (SAIL) databank.
Output metrics for the TS model
In this paper we propose two new metrics to quantitatively assess how the impacts of domain factors on outcome vary across these local regions at micro-level.
1. MiD: micro-impact of domain. First note that in a TS
fuzzy system, each LLM describes the relationship between domain factors and outcome in a certain data sub-region. The coefficients of these LLMs represent, for each deprivation domain,
Table 1.Core cut-off points for fuzzy sets to characterise ‘‘non-deprived’’ and ‘‘highly deprived’’ scores.
Input variables Non-deprived core scores Highly deprived core scores
Income [0, 11.71] [36.56, 100]
Health [0, 13.14] [35.2, 100]
Access [0, 14.66] [26.05, 100]
Housing [0, 14.77] [31.77, 100]
Environment [0, 18.80] [25.91, 100]
Community [0, 12.24] [36.63, 100]
doi:10.1371/journal.pone.0113592.t001
the rates and directions of expected change of the conditional mean of the outcome (e.g. education under-attainment rate) with respect to each deprivation domain. To make a prediction for a specific LSOA, the coefficients across all LLM are fused with the weights determined by how well the LSOA fits to each LLM data space region. These averaged coefficients are unique to each LSOA and give an indication of how the educational achievement would be expected to change given changes in deprivation scores.
We denote this metric by the term ‘‘Micro-impact of Domain’’
(MiD) at the given sample point.
Specifically, given an LLM yi~a0iza1ix1z zapixp, the
slope coefficient vectorE= (a1i, ,api)Tis be normalized into a
unitary vector:
eji~ aji E
k k ð5Þ
Then given an input (e.g. vector of WCIMD deprivation scores)
x
_
~ _x
1, ,x_p
T
, the overall influence of the jth domain on
output at the point_x
is defined as
MiDjð Þbxx ~ XL
i~1
tið Þbxx eji ð6Þ
Hence theMiDdefinesthe overall expected change in the output
(e.g. education under-attainment rate),on average,for a one-unit change in the jthdomain at the point_x, while holding all the other
domains fixed. It gives the size and direction of the effect that the
jthdomain is having on the output at the point _x
. Note thatx
represents a general variable, whilex_
denotes the values ofxat a
specific point.
2. CoD: contribution of domain. The MiD coefficient
represents the slope of the relationship between deprivation and education, hence a standardised effect size for a given change in deprivation. In practice, domain scores for certain LSOAs may differ widely in magnitude, and potential changes in deprivation score via policy intervention may also differ widely, hence the absolute change in educational score needs to take this into
account. The ‘‘Contribution of Domain’’ (CoD) is defined as the
product of the MiD and the actual domain value.
Specifically, given an input sample, x_
~ x_
1, ,x_p
T
, the
overall influence of thejthdomain onx_
is defined as
CoDjð Þbxx~bxxj XL
i~1
tið Þbxx eji ð7Þ
Fitting the TS model
First, given the 1896 LSOA samples across Wales, a 9-fold cross validation scheme was used to evaluate the performance of the TS model. In each data partition, 1400 samples were used for training, 200 samples for validation, and 296 samples for testing. The 1400 training samples were used to fit the initial TS model
with inputs representing the various indices of deprivation:income
(x1), health (x2), access to services (x3), housing (x4), physical
environment(x5),community safety(x6) and one output:education
educational under-attainment rate(y). In this study, each of the
deprivation domains was characterised into ‘low’ non-deprived
scores and ‘high’highly deprivedcategories. Since such
classifica-tion has uncertainty associated with it, fuzzy sets were used to characterise these linguistic terms. First, the fuzzy c-means unsupervised clustering algorithm [31] was used to partition input space. By projecting the multi-dimensional prototypes on the input variable space [32], the membership functions of fuzzy sets were generated with the core cut-off points shown in the Table 1. In this way, this initial TS model consists of 64 rules representing all combinations of each domain in partitioning the input space. Then the validation data set was used to select the important rules and remove the redundant ones in the interest of constructing
compact model using thev-index of TS fuzzy rules proposed in
[12]. The generalisation performance of the constructed compact TS model was evaluated by applying to the testing data set. Then the most compact TS model with good global prediction performance was used to analyse the micro-impacts of deprivation domains on educational under-attainment rate across different data sub-regions. All models were implemented in Matlab, and code is available upon request from the corresponding author.
Ethics
The data used in this study was collected via national databases
held in the SAIL (Secure Anonymised Information Linkage)
databank [27][28]. No ethical review was required because the SAIL databank holds the data which has been anonymised and granted with the permission of relevant Caldicott Guardian/Data Protection Officer [33], however, approval to proceed with the
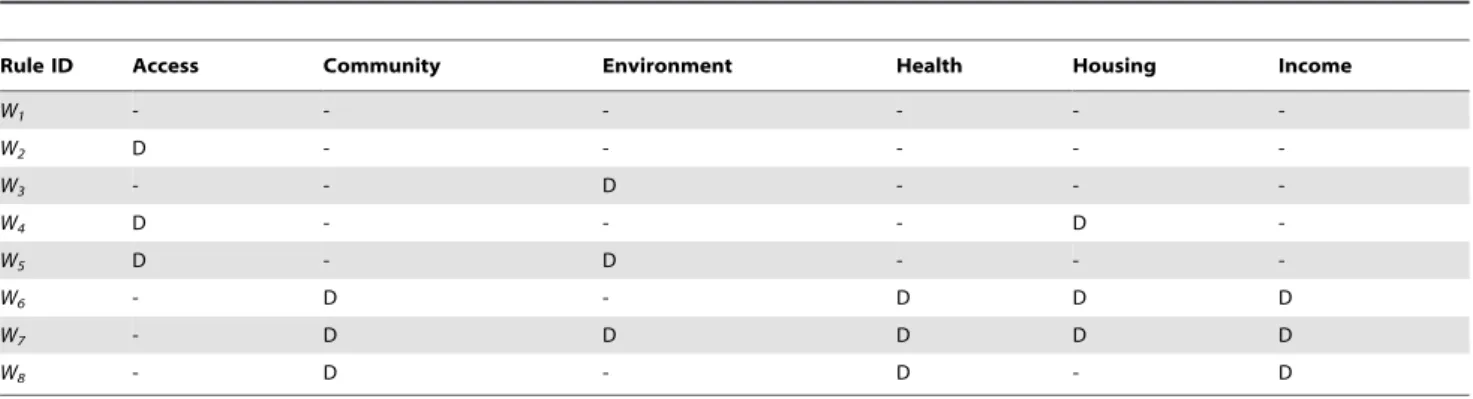
Table 2.The eight most important ‘‘if-then’’ input components of the rules (W1,W8) for the final TS fuzzy model.
Rule ID Access Community Environment Health Housing Income
W1 - - -
-W2 D - - - -
-W3 - - D - -
-W4 D - - - D
-W5 D - D - -
-W6 - D - D D D
W7 - D D D D D
W8 - D - D - D
study was given by the Information Governance Review Panel [28].
Results
There were 196,770 KS1 and KS2 childhood records for Wales during the relevant WCIMD period. The number of children with KS 1 or KS2 records in this study between 2005 and 2007 can be found in Table S1 of Data Supplement. Figure 2 depicts the educational under-attainment rate (EUR) across each of the 1896 LSOAs in Wales. The overall percentage failing to achieve the education target was 22.7%, with considerable geographical heterogeneity. The pair-wise linear correlation coefficients for all
domains: Income, Health, Access, Housing, Environment and
Community, can be found in Table S2 of Data Supplement. Fuzzy sets with the core cut-off points shown in the Table 1 were used to
characterise the ‘low’ non-deprived scores and ‘high’ highly
deprived categories. Uncertainty emerges for the areas whose deprivation scores lie between the cut-offs. For example, an LSOA
with income deprivation score below 11.71 should belong, with
high certainty, to thenon-deprivedcategory onIncome, and one
with deprivation score above 36.56 to thehighly deprivedcategory.
In contrast an LSOA with income deprivation scores of 30 would
have the membership of the non-deprived category with a
‘‘degree’’ (representing uncertainty) of 0.29 and at the same time,
a degree of 0.84 belonging to thehighly-deprivedcategory. So in
decision making about such areas, both high and low deprivation on Income (with their associated ‘‘if-then’’ rules) will contribute
significantly, with theweightsof each calculated from the degree of
membership.
Using sub-regions of the data space based on the two sets of each of the 6 deprivation domains results in 64 rules (LLMs), and a risk of redundancy and over fitting of the data. Application of our recently developed algorithm [12] resulted in a compact, and parsimonious TS model. The 9 fold cross validation scheme showed an overall root-mean-squared-error (RMSE) of 0.0888 (95% confidence interval: [0.0845, 0.0931]). The best compact TS model had only 8 important rules (note that this is fewer than
Figure 3. The coefficients of the eight local linear models in the parsimonious constructed compact TS system model.The rules are coded asW1toW8(see Table 2). Note that individual LSOAs have predicted values that are weighted averages of these 8 models, with the weights determined by the uncertainty of membership of the sub-regions.
found in [12] as we are now using an updated version of the WIMCS data set). Taken together, these were sufficient to provide an accurate prediction of the education under-attainment rate in all LSOAs (generalization performance on testing data set with RMSE of 0.0842, see Figure S1 of Data Supplement). This means that the whole population of children attending the KS1 and KS2 across Wales can be grouped into 8 different clusters with similar characteristics in each cluster according to their combinations of deprivation domains of the WCIMD, and each cluster is dominated by an LLM.
The input conditions for each rule are outlined in Table 2, and the coefficients of each of the 8 local linear models are given in Figure 3, while Figure 4 depicts the 95% confidence intervals (CIs)
of these coefficients. The colours in Figure 3 are used to differentiate these LLMs and the corresponding clusters of LSOAs revealed in Figure 5. It can be seen that based on the given WCIMD training dataset, some coefficients of the LLMs have the negative values. These negative values represent the ‘‘unexpected’’
conclusion that education scores tend toimprovewith increased
deprivation of corresponding domain, and tend to have wide confidence intervals associated with them. Hence although these trends are present in certain sub-regions of the data, evidence for such an effect is not very strong. The 95% CIs in Figure 4 show the range of plausible values that can act as estimates for the
coefficients of each deprivation score in each LLM. Income
domain in the LLMsW1andW6is clearly statistically significantly
Figure 4. Properties of the coefficients of the eight selected ‘‘parsimonious’’ local linear models (LLMs).Green square represents point estimate, and ‘‘x’’ marks upper and lower 95% confidence intervals. (IN- Income; HE- Health; AC- Access to Services; HO – Housing; EN – Physical Environment; CO- Community Safety).
different from zero. The CIs for the domains of Access inW2,
EnvironmentinW3, HealthinW6, andHousing inW7 all also indicate statistical significance. We note that even small coeffi-cients can make considerable contributions to the predicted education failure rate in local areas of high deprivation. This is because the expected education failure rate is obtained from the product of the coefficient and the deprivation score. This is part of the rationale for the choice of the CoD metric as a key output.
As indicated above, each data sub-region has one dominating LLM while the rest of other LLMs play minor roles in prediction for the samples in this sub-region. Summarising the LLMs in the whole data space, Table 3 shows the values of mean, minimum and maximum of the LLMs’ coefficients and corresponding 95%
CIs. The Table 3 indicated that in overall, the Income and
Housingdomains are statistically significant, as might be expected,
Incomewas the most influential domain.
To further interpret these LLMs, the input conditions from
Table 2 (the ‘‘if’’ component of the rules) can be combined with
the coefficients from Figure 3 (the ‘‘then’’ component of the rules)
to illustrate the extremely complicated interactions that emerge from the data mining. The effects of all individual deprivation domains were strongly dependent on the categories of all other
domains in determining educational outcomes. This means that generalisations about the effect of any deprivation index to a local level could have poor performance if the other factors are not properly taken into account.
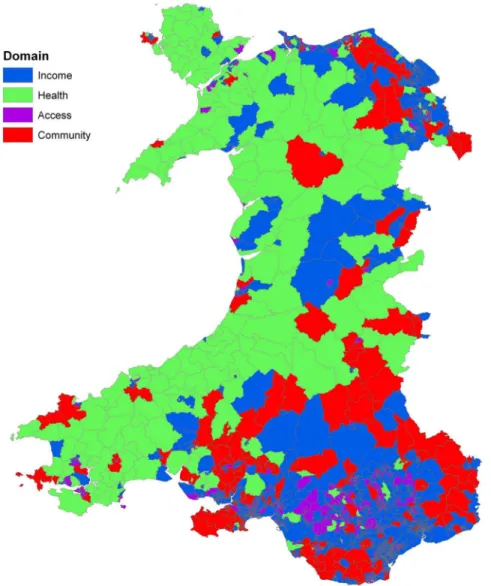
There are several outputs from the model that are of interest. First, a simple indicator that can be used to classify each LSOA is the ‘‘dominant rule’’. Figure 5 shows the distribution of these 8 types of relationship across Wales revealed by the 8 LLMs in Figure 3 (colours used in these two Figures to represent the LLMs and corresponding LSOAs are consistent). Several interesting patterns emerge. The urban and rural areas of Wales are naturally marked by the size of the LSOA, with very small LSOAs found in the north and south coastal cities, as well as the South Wales industrial valleys. If we concentrate instead on the remaining rural areas, there remains a general north-west (NW) to south-east (SE) divide, with the NW characterised by rule 4 (green) in which the relationship between education under attainment and deprivation
is strongly influenced by Health, with a contribution from
Environmentbut a surprisingly small role for Income. While in
the SE rule 2 dominates (red) in whichIncomeplays a much more
central role, along withCommunityand, to a lesser extent,Health.
Figure 5. Map of Wales showing Lower Super Output Areas (LSOAs) coded according to the dominant rule at each LSOA that represents the relationship between deprivation domains and education under-attainment rate.
Recall however, that the fitted value for each LSOA is a weighted average of all 8 rules (LLMs). Hence the need for the proposed metrics to reveal the unique local picture. The MiD values across all LSOAs are illustrated in Figure 6, in which a positive MiD indicates higher levels of deprivation are associated with higher education failure rates. Figure 7 shows the domain factor for each LSOA that has the strongest MiD across Wales. Moreover, Figure 8 illustrates the geographical trends of the CoD for each LSOA. The number of observations here are large. Based on our knowledge concerning specific LSOAs, we provide some case studies highlighting the insights from the new model and metrics.
Case Study 1:Affluent area, with only poor access to services.
For this region, the dominant rule isW2, which suggests that in
terms of the MiD metric the domain factors -Community,Income
and Health have strong associations with educational outcomes (highest coefficients in Figure 3). However, for this area, all these domains are already at extremely low deprivation levels, making them unlikely targets for improvement. In contrast, the CoD
metric shows thatAccessis overall the most important determinant
of under-attainment performance (.33% contribution to the predicted educational under-attainment score), and should be the key target. This case study represents a ‘‘straightforward’’ situation, in which the most important target domain is simply the standout value from the WCIMD data. Here, all deprivation
scores are very low, apart fromAccess. Despite the obvious main
conclusion, the MiD values highlight higher than expected roles
for certain domains (Income,CommunityandHealth, reflected in
high MiD coefficients, and moderate CoD scores).
Case Study 2:Area with poor access to services, and moderate levels of deprivation for other domains. This is another area for
which the dominant rule isW2, and might be expected to have
similar problems to the Case Study 1. It is in fact the next most
deprived area in their region forAccess(98thpercentile). However,
despiteAccessbeing the standout value in the raw WCIMD data,
this time a simple interpretation does not hold. Since there are
moderate deprivation levels forHealth(37thpercentile), and MiD
coefficients show that the effect of Health in this region to be
highest, then Health is classified as by far the most important
target in the area.
Case Study 3: Deprived area, with especially poor income, health and community safety domains (but good access to
services). The dominant rule isW6(also with significant weighting
fromW7), which implies an expected impact (according to MiD) from Access, Income and Health. However, due to the great
disparity between high deprivation on theIncome(94thpercentile)
and good Access (39th percentile), then in the CoD metric the
Incomedomain (and to a lesser extent Health) dominates and is highlighted as the key priority.
Case Study 4:Area of moderate deprivation across all domains.
Here, the dominant local model isW1(although with significant
contribution from several other models). According to the MiD
metric,Income,CommunityandHousingare expected to have the
strongest relationship with educational outcome. Both metrics
suggests that Income is the target domain, having the strongest
coefficient (MiD) value and with a CoD value contributing 67% to the expected under-attainment rate.
The last two Case Studies focus onHousingandEnvironment.
Although these factors tend to have a smaller role than the other domains, it is not difficult to identify cases in which they play
important roles.Case Study 5represents an LSOA with generally
very low deprivation (Income, Health, Community), but with
roughly average levels ofHousing,EnvironmentandAccess. This
area is dominated by ruleW3 (though with significant
tions from the other rules). In terms of MiD coefficient,Income
appears to have the strongest correlation with educational performance. However, due to the very low WCIMD values for
Income, the largest component of under-attainment, CoD value, is
Housing.
Case Study 6represents a set of rural areas, which are very
affluent, yet have high deprivation scores at theEnvironmentand
Access domains. They are described predominately by ruleW4,
which suggests a strongest coefficient (MiD) forHealth. However,
the CoD value shows that the greatest deprivation contribution to
under-attainment comes from theEnvironmentdomain.
We note that these examples are not easily generalized. There is
a role for all aspects of deprivation, including Environment,
Housing, Access and Community, in addition to the factors of
IncomeandHealththat are usually focused on. The importance in a given region is not simply revealed by the deprivation scores alone, and consequently there are very many different spatial patterns that can be found in the data, and contrasting effects
found across areas that initially appear quite similar. A need for area-based interpretation is clear.
Our investigations so far suggest that, although in our modelling each LSOA is considered as independent one from another, regional characteristics (urban, rural, industrial areas, etc.) can play important roles in explaining the variations of spatial patterns. For rural areas with scattered population, such as those dominated
by rule W2, Access to Services emerges as a key domain for
improving educational performance. Areas, such as the ex-coalfields in South Wales Valleys, have the key priority in the
domains ofIncomeand Health. An extension of the approach to
formally include spatial statistics would be a potential area of future research.
Discussion
On first encounter, the algorithm for fitting the TS model can appear complicated. However it is little more than a trick for finding sub-regions of the multidimensional data space that are
Figure 6. Variations in Micro-impact of Domain (MiD).Overall rates and directions of expected changes in education under attainment rate, for unit change in domain deprivation score.
doi:10.1371/journal.pone.0113592.g006
distinct, and can then be well described by a small set of simple models (LLMs). Then for a specific area, one uses an average of these models that reflects how well the area ‘belongs’ to the sub region of the data. Using if-then rules and local modelling technique, we suggest that the TS model offers greater transpar-ency than fitting interactions and complex non-linear terms in, for example, regression models, because we are always dealing with a simple model in a relevant data space, rather than a complex model that tries to capture all the subtleties at once.
A statistical interaction can be defined as a relationship in which the influence of a variable on an outcome measure is dependent on the value of other (interacting) variables. In the fitting of a TS system, if there is a requirement for several LLMs this, by definition, represents interaction (or non-linearity) in the data. It means that the coefficients for a certain variable will be different (specified by a different LLM) across different regions of the data space. Hence, this approach is natural for revealing complex interactions between variables, while remaining fairly easy to interpret at the local level, where the effects are approximately linear.
As a comparison to our data mining approach, a standard linear
regression analysis finds that Access and Community are not
statistically significantly associated (at the 5% level) with educa-tional attainment (in univariate analysis) and the majority of two-way interactions were not significant (see Table S3 and Table S4 of Data Supplement). Some of the complexity of the data can indeed be recovered from the presence of several significant multi-way interactions, however we argue that these models are much
more difficult to interpret than the straightforward ‘‘if-then’’ linear
models presented here. Nevertheless, this study has some potential limitations. First our data mining approach adopted in this study involves higher computing overhead for the purpose of construct-ing a parsimonious model. Moreover designconstruct-ing the fuzzy sets for linguistic terms needs skills and additional efforts for appropriate generation of hyper-parameter values via a trial-and-error approach.
To put some of these findings in context, the World Health Organization (WHO) has promoted the importance of early area-based interventions in health and educational attainment world-wide [34], leading to community-based initiatives to improve developmental outcomes among socio-economically disadvan-taged children [35]–[37]. These initiatives reflect the WHO’s principles of the Health for All (HFA) [34]. For example, the Best Start project in Australia aims to improve the overall health, development, learning and wellbeing of Victoria’s young children and their families in some of the most socially disadvantaged communities through local partnerships and improved service co-ordination [38]. After several years, the findings suggest that improvements in access to services in disadvantaged areas can be achieved by area-based interventions, such as optimising the use of existing resources, and that the potential health benefits of area-based interventions might be better assessed by examining steps along the pathway between intervention and outcome [35][39]. In the UK, improving education and skills is one of the five priority goals of the National Strategy for Neighbourhood Renewal and the New Deals for Communities Programme. This area-based approach has led to initiatives such as Sure Start, Excellence in Cities, Education Action Zones and Aim Higher which target
education. The New Deals for Communities is unique in relation to previous initiatives by addressing not only education but the
other factors that might impede progress in educational perfor-mance [37]. More specifically, it picks highly deprived neighbour-hoods to tackle place based issues (crime, community, housing, physical environment) in order to address people based outcomes (education, health and worklessness) using school and community interventions. The findings of our study offer data mining evidence suggesting that a combined approach of tackling place based issues and educational attainment may be more effective than simply focusing on education alone.
In intervention evaluation, a general theme is that rigorous program evaluation is needed to determine which interventions will work most effectively and to spend scarce resources wisely [40]. However, evaluation of complex intervention is often difficult. For example, a review looking at housing improvements and health effects [41] found a large number of methodological difficulties in the before and after comparisons, especially in the response and follow-up rates among deprived communities and there is a lack of evidence on health gains that result in investment in housing. Thus, while this study suggests that tackling place and income barriers will improve children’s education, there is currently a lack of evidence from intervention studies to confirm this. The scope of future evaluations must be carefully tailored and techniques must be properly selected to generate accurate information for policy makers.
Conclusions
Complex interactions are notoriously difficult to detect and interpret within a standard statistical regression framework. This paper provided a local modelling method that relies on sets of
simple linear models, and proposed two new metrics,MiD and
CoD, to quantify the variations of local level impacts of
multidimensional factors on educational outcomes. This study revealed some intriguing findings to bolster the scanty evidence base around the complex inter-relationship between different domains of health and socio-economic status and educational achievement. The results are consistent with a growing literature on the importance of place characteristics on individual outcomes. The findings imply that a broad range of policies may have influence in reducing inequalities in educational achievement and that interventions tailored to fit in with local characteristic would help to increase their effectiveness. It is now important to exploit the opportunities posed by natural experiments where substantial changes are made to the distribution of deprivation domains as a result of planned or serendipitous circumstances. Such longitudi-nal effects would serve to validate predictions of the data mining models, and aid in the assessment of causality.
Supporting Information
Figure S1 The prediction by the constructed TS model
(circles) vs observed child educational under-attainment rates (points) at testing LSOAs. A random sample of 50 LSOAs from the testing sample are shown here, to aid in clarity. (DOCX)
Figure 8. Variations in Contribution of Domain (CoD).These values represent a product of the observed WCIMD deprivation scores, and the domain coefficient scores (MiD values) in each LSOA, and represents the contribution of each type of deprivation domain to the expected education under-attainment rate in each LSOA.
Table S1 Number of children with Key Stage 1 or 2 records in study, between 2005 and 2007.
(DOCX)
Table S2 Pair-wise linear correlation coefficients for all
domains.Note that negative association is common, and few of the domain scores are highly correlated.
(DOCX)
Table S3 Results of linear regression applied to the
same dataset.
(DOCX)
Table S4 Linear regression with all pairwise
interac-tions.
(DOCX)
Author Contributions
Conceived and designed the experiments: SMZ SB MBG. Performed the experiments: SMZ MBG. Analyzed the data: SMZ MBG OGB RAL SB AJ HB KJ. Contributed reagents/materials/analysis tools: RAL SMZ MBG SB. Wrote the paper: SMZ MBG SB.
References
1. Webber R, Butler T (2005) Classifying pupils by where they live: how well do these predict variations in their GCSE results? CASA Working Paper No. 99. London: UCL.
2. Brownell M, Roos N, Fransoo R, Roos LL, Guevremont A, et al. (2006) Is the class half empty? A population-based perspective on socioeconomic status and educational outcomes. IRPP Choices 12:1–30.
3. Currie J (2007) Healthy, wealthy, and wise: is there a causal relationship between child health and human capital development. Workshop on The Long-run Impact of Early Life Events, December 13–14, Ford School of Public Policy, Weill Hall, Ann Arbor, MI, USA.
4. Black SE, Devereux PJ, Salvanes KG (2007) From the cradle to the labor market? The effect of birth weight on adult outcomes. Quarterly Journal of Economics 122: 409–439.
5. Malacova E, Li J, Blair E, Leonard H, de Klerk N, et al. (2008) Association of birth outcomes and maternal, school, and neighborhood characteristics with subsequent numeracy achievement. American Journal of Epidemiology 168: 21– 29.
6. Schools Analysis and Research Division (2009) Deprivation and Education: The evidence on pupils in England, foundation stage to Key Stage 4. March 2009, Department for Children, Schools and Families, http://www.education.gov.uk/ publications/eOrderingDownload/DCSF-RTP-09-01.pdf (accessed 29 Feb 2012).
7. Acheson D (Chairman) Independent Inquiry into Inequalities in Health Report. The Stationery Office, UK. http://www.archive.official-documents.co.uk/ document/doh/ih/ih.htm (Accessed date: 9 April 2011)
8. Takagi T, Sugeno M (1985) Fuzzy identification of systems and its applications to modeling and control. IEEE Transactions on System, Man and Cybernetics 15: 116–132.
9. Chadli M, Borne P (2012) Multiple models approach in automation: Takagi-Sugeno fuzzy systems, Wiley.
10. Juang CF, Chen GC (2012) A TS fuzzy system learned through a support vector machine in principal component space for real- time object detection. IEEE Transactions on Industrial Electronics 59: 3309–3320.
11. Precup RE, Hellendoorn H (2011) A survey on industrial applications of fuzzy control. Computers in Industry 62: 213–226
12. Zhou SM, Lyons RA, Brophy S, Gravenor MB (2012) Constructing compact Takagi-Sugeno rule systems: identification of complex interactions in epidemi-ological data. PLoS ONE 7: e51468.
13. Popham F, Dibben C, Bambra C (2013) Are health inequalities really not the smallest in the Nordic welfare states? A comparison of mortality inequality in 37 countries. Journal of Epidemiology & Community Health 67:412–418 14. Dibben C, Popham F (2013) Are health inequalities evident at all ages? An
ecological study of English mortality records. European Journal of Public Health 23:39–45
15. Ngo N, Paquet C, Howard NJ, Coffee NT, Adams RA, et al. (2014). Area-Level Socioeconomic Characteristics, Prevalence and Trajectories of Cardiometabolic Risk. International Journal of Environmental Research and Public Health 11: 830–848.
16. Ngo AD, Paquet C, Howard NJ, Coffee NT, Adams R, et al. (2013). Area-level Socioeconomic Characteristics and Incidence of Metabolic Syndrome: A Prospective Cohort Study. BMC Public Health. 13:681, Accessed at: biomedcentral.com/1471-2458/13/681.
17. Davey SG, Hart CL, Watt G, Hole DJ, Hawthorne VM (1998) Individual social class, area-based deprivation, cardiovascular disease risk factors, and mortality: the Renfrew and Paisley Study. Journal of Epidemiology and Community Health 52:399–405
18. Picciotto S, Forastiere F, Stafoggia M, D’Ippoliti D, Ancona C, et al. (2006) Associations of area based deprivation status and individual educational attainment with incidence, treatment, and prognosis of first coronary event in Rome, Italy, J Epidemiol Community Health 60:37–43.
19. Steenland K, Henley J, Calle E, Thun M (2004) Individual- and area-level socioeconomic status variables as predictors of mortality in a cohort of 179,383 persons. American Journal of Epidemiology 159:1047–1056.
20. Blanc PD, Yen IH, Chen H, Katz PP, Earnest G, et al. (2006) Area-level socio-economic status and health status among adults with asthma and rhinitis, Eur Respir J 27: 85–94.
21. Welsh Statistical Directorate. Welsh Index of Multiple Deprivation 2008, Technical Report, Welsh Assembly Government.
22. Administrative Data Liaison Service. National Pupil Database (NPD), http:// www.adls.ac.uk/department-for-education/dcsf-npd/?detail (accessed 10 Sept 2010).
23. UK Office for National Statistics. Super Output Areas, http://www.ons.gov.uk/ ons/guide-method/geography/beginner-s-guide/census/super-output-areas-soas-/index.html (accessed 10 Sept 2010).
24. Welsh Assembly Government. Welsh Index of Multiple Deprivation 2008, Summary Report (http://wales.gov.uk/docs/statistics/2011/111220wimd summaryreviseden.pdf) (accessed 29 Feb 2012).
25. Welsh Assembly Government. Analysis of the correction to the Welsh Index of Multiple Deprivation 2008 (http://wales.gov.uk/docs/statistics/2012/ 120628wimdincomeanalysisen.pdf) (accessed 16 November 2012).
26. Schwartz J (2004) Air Pollution and Children’s Health. Pediatrics 13: 1037–1043 27. Lyons RA, Jones KH, John G, Brooks CJ, Verplancke JP, et al. (2009) The SAIL databank: linking multiple health and social care datasets. BMC Medical Informatics and Decision Making 9 (doi:10.1186/1472-6947-9-3)
28. Ford DV, Jones KH, Verplancke JP, John G, Brown G, et al. (2009) The SAIL databank: building a national architecture for e-health research and evaluation. BMC Health Services Research 9 (doi: 10.1186/1472-6963-9-157).
29. Zhou SM, Gan JQ (2008) Low-level interpretability and high-level interpret-ability: a unified view of interpretable fuzzy system modelling from data. Fuzzy Sets and Systems 159:3091–3131.
30. Zhou SM, Gan JQ (2009) Extracting Takagi-Sugeno fuzzy rules with interpretable submodels via regularization of linguistic modifiers. IEEE Transactions on Knowledge and Data Engineering 21: 1191–1204. 31. Bezdek JC (1981) Pattern Recognition with Fuzzy Objective Function
Algorithms. Plenum Press.
32. Zhou SM, Gan JQ (2006) Constructing accurate and parsimonious fuzzy models with distinguishable fuzzy sets based on an entropy measure. Fuzzy Sets and Systems 157: 1057–1074.
33. Ford DV, Jones KH, Verplancke JP, et al., Data Anonymisation Policy and Process (DAPP). HIRU project document, Swansea University.
34. World Health Organisation (1998) Health21- Health for All in the 21st Century. Geneva: World Health Organisation; 1998.
35. Kelaher M, Dunt D, Feldman P, Nolan A, Raban B (2009) The effects of an area-based intervention on the uptake of maternal and child health assessments in Australia: A community trial. BMC Health Serv Res. 9: 53.
36. Abbema EA, van Assema P, Kok GJ, De Leeuw E, De Vries NK (2004) Effect evaluation of a comprehensive community intervention aimed at reducing socioeconomic health inequalities in the Netherlands. Health Promot Int 19: 141–156.
37. Whitworth A, Wilkinson K, McLennan D, Noble M, Anttila C. Raising educational attainment in deprived areas: the challenges of geography and residential mobility for area-based initiatives. Evidence from the New Deal for Communities Programme. Department for Communities and Local Govern-ment 2009.
38. Best Start atlas-children 0–8 year in Victoria: http://www.education.vic.gov.au/ ecsmanagement/beststart/#eval (accessed 29 Feb 2012).
39. Victorian Auditor-general (2007) Giving Victorian children the best start in life. Melbourne: Victorian Government Printer 2007.
40. Wynn BO, Dutta A, Nelson MI (2005) Challenges in program evaluation of health interventions in developing countries, Report, RAND Center for Domestic and International Health Security.