Better Informing Decision Making with
Multiple Outcomes Cost-Effectiveness
Analysis under Uncertainty in Cost-Disutility
Space
Nikki McCaffrey1,5
*, Meera Agar2,5, Janeane Harlum3, Jonathon Karnon4, David Currow5,
Simon Eckermann6
1Flinders Clinical Effectiveness, Flinders University, Bedford Park, South Australia, Australia 5041,
2Department of Palliative Care, Braeside Hospital, Prairiewood, New South Wales, Australia,3South Western Sydney Local Health District, Liverpool, New South Wales, Australia,4School of Population Health and Clinical Practice, University of Adelaide, Adelaide, South Australia, Australia,5Palliative and Supportive Services, Flinders University, Bedford Park, South Australia, Australia,6Centre for Health Service
Development, Australian Health Services Research Institute, University of Wollongong, Wollongong, New South Wales, Australia
Abstract
Introduction
Comparing multiple, diverse outcomes with cost-effectiveness analysis (CEA) is important, yet challenging in areas like palliative care where domains are unamenable to integration with survival. Generic multi-attribute utility values exclude important domains and non-health outcomes, while partial analyses—where outcomes are considered separately, with their joint relationship under uncertainty ignored—lead to incorrect inference regarding preferred strategies.
Objective
The objective of this paper is to consider whether such decision making can be better in-formed with alternative presentation and summary measures, extending methods previous-ly shown to have advantages in multiple strategy comparison.
Methods
Multiple outcomes CEA of a home-based palliative care model (PEACH) relative to usual care is undertaken in cost disutility (CDU) space and compared with analysis on the cost-effectiveness plane. Summary measures developed for comparing strategies across potential threshold values for multiple outcomes include: expected net loss (ENL) planes quantifying differences in expected net benefit; the ENL contour identifying preferred strate-gies minimising ENL and their expected value of perfect information; and cost-effectiveness acceptability planes showing probability of strategies minimising ENL.
a11111
OPEN ACCESS
Citation:McCaffrey N, Agar M, Harlum J, Karnon J, Currow D, Eckermann S (2015) Better Informing Decision Making with Multiple Outcomes Effectiveness Analysis under Uncertainty in Cost-Disutility Space. PLoS ONE 10(3): e0115544. doi:10.1371/journal.pone.0115544
Academic Editor:Talitha L Feenstra, National Institute for Public Health and the Environment, NETHERLANDS
Received:March 24, 2014
Accepted:November 25, 2014
Published:March 9, 2015
Copyright:© 2015 McCaffrey et al. This is an open access article distributed under the terms of the Creative Commons Attribution License, which permits unrestricted use, distribution, and reproduction in any medium, provided the original author and source are credited.
Data Availability Statement:All relevant data are within the paper and its Supporting Information files.
Funding:This study was funded by the Australian Government’s Department of Health under the National Palliative Care Strategy. The funding agency has no control over study design, analysis, reporting nor dissemination.
Results
Conventional analysis suggests PEACH is cost-effective when the threshold value per addi-tional day at home ( 1) exceeds $1,068 or dominated by usual care when only the
propor-tion of home deaths is considered. In contrast, neither alternative dominate in CDU space where cost and outcomes are jointly considered, with the optimal strategy depending on threshold values. For example, PEACH minimises ENL when 1=$2,000 and 2=$2,000
(threshold value for dying at home), with a 51.6% chance of PEACH being cost-effective.
Conclusion
Comparison in CDU space and associated summary measures have distinct advantages to multiple domain comparisons, aiding transparent and robust joint comparison of costs and multiple effects under uncertainty across potential threshold values for effect, better inform-ing net benefit assessment and related reimbursement and research decisions.
Introduction
Conventional cost-effectiveness analysis (CEA) is limited to consideration of one measure of
effect such as life years gained [1]. However, when multiple outcome domains are important
such single outcome comparison can lead to conflicting conclusions concerning preferred
strategies [2,3]. Consequently, decisions about the costs and benefits of funding allocations
can be misinformed and lead to inefficient distribution of finite health care resources [2,4].
The widely applied quality-adjusted life year (QALY) measure overcomes this limitation to
the extent that impacts on multiple domains of health can be integrated with survival [1].
How-ever, QALYs calculated using generic multi-attribute utility instruments (MAUIs) such as the
EQ-5D [5] focus upon health alone as the sole indicator of value. Empirical studies have shown
that individuals may also gain utility from factors relating to the provision of health care [6–8].
Economic analyses focusing on health alone do not enable robust coverage of the impacts of in-terventions in complex disease areas where multiple, diverse domains of effect are important. For example, in palliative care, many patients obtain value from receiving home-based rather
than hospital care [9].
In palliative care, the use of the QALY measure is also limited by the:
1. omission of important patient-valued domains from generic MAUIs, such as preparation
for death and existential issues [10,11];
2. changes in patient and clinical perspective due to the proximity of death when valuing utility;
3. dearth of palliative care specific utility instruments incorporating the key domains
impor-tant to patients receiving palliative care [12];
4. limited availability of suitable palliative care quality of life (QOL) measurement tools to
‘map’to common MAUIs; and
5. the inability to integrate the impacts on carers’utility, survival and willingness to care
One option might be to develop a condition-specific MAUI to incorporate palliative care-related effects of interest. Naturally, this would require identifying salient health and non-health related QOL domains and items for inclusion within each domain. Furthermore, confirmation of the content and construct validity and responsiveness of the condition-specific
MAUI would be necessary [15]. However, such research would be expected to take years to
complete and still faces issues of how to weight or combine effects to inform societal decision making with the objective of maximising budget constrained net benefit (NB) across research,
reimbursement and regulation decisions [16]. Alternatively, cost-consequences analysis (CCA)
[1] with disaggregated mean costs and multiple outcomes explicitly presented has been
advo-cated as a preferred method in these situations [17,18]. However, in CCA, cost and multiple
outcomes are treated separately without consideration of their interaction or joint uncertainty.
As Briggs et. al. argue in seminal papers on the death of cost-minimisation [19], and cost
ef-fectiveness under uncertainty [20], separate and sequential hypothesis tests on differences in
outcomes and costs lead to fallacious inferences. It is important that CEA represents joint un-certainty associated with cost and outcomes so that funders and policy makers can make valid inferences and optimise across joint research, reimbursement, regulation and pricing decisions
[16,21,22]. Jointly evaluating costs with multiple effects and their potential values under
un-certainty would enable robust and transparent trade offs between impacts of strategies and the NB of strategies under uncertainty and hence aid consideration of the consequences of reim-bursement decisions. Further, if summary measures representing the expected value of perfect information were developed, these measures could start to address decisions related to the value of conducting future research relative to the cost of obtaining the additional information
[16,21,23]. Ultimately, economic evaluations can easily misrepresent the relative NB of
pallia-tive and end-of-life care without simultaneous consideration of costs and multiple outcome do-mains under uncertainty. Accessible, robust and generalisable methods for jointly comparing cost and multiple outcomes under uncertainty consistent with budget constrained maximisa-tion of NB are needed to better inform funding decisions in such settings.
For multiple strategy comparisons Eckermann et al. [24–26] demonstrate distinct decision
making advantages of: (i) presenting costs and effects on the cost-disutility (CDU) plane, with effects framed from a utility reducing perspective, e.g. mortality, morbidity or reduction in QALYs, and flexible axes where costs and effects are measured relative to the least costly and most effective strategies respectively; and (ii) simply calculated expected net loss (ENL) curves and frontiers for each strategy which identify both the optimal strategy in minimising ENL at any threshold value and their expected value of perfect information (EVPI). This paper extends these methods to consider multiple outcomes under uncertainty and whether and how such comparison can be used to better inform societal decision making when optimising budget constrained NB.
The next section summarises conventional CCA and CEA applied to compare multiple out-comes with alternative palliative care models. The new methodology, multiple outout-comes com-parison in CDU space, and associated summary measures are then introduced and illustrated. The relative merits of these alternative methods for multiple outcomes CEA are discussed in palliative care settings and more generally with multi-criteria decision analysis (MCDA) and fi-nally conclusions and implications are drawn.
Methods
details of the economic evaluation are presented elsewhere [27]. Ethics approval for the pilot study was granted by Sydney South West Area Health Service Human Research Ethics Com-mittees. Written informed consent was obtained from the pilot study participants.
Cost-consequences and cost-effectiveness analyses
Mean incremental per patient effects and net costs were calculated for PEACH relative to usual care including: days at home; place of death; PEACH intervention costs; costs of specialist palli-ative care service use; and costs of acute hospital and pallipalli-ative care unit inpatient stays and
outpatient visits. Net benefit (Equation 1) was calculated to address analytical and inferential
shortcomings of the incremental cost-effectiveness ratio (ICER), while retaining the same
un-derlying cost effectiveness objective [20,28–31]. Under the NB approach, an intervention is
considered cost- effective if, at specified decision-maker threshold values, the monetary value of the incremental effects is greater than the incremental costs i.e., incremental net benefit
(INB) is positive (seeEquation 2) [24]. The intervention with the greatest INB is considered
the most cost-effective in multiple intervention comparison. In budget constrained health sys-tems, threshold values for effects should be the health shadow price for a unit gain of effect re-flecting opportunity cost and maximisation of health system outcomes, i.e. represent the best
alternative way of achieving the same effects [22,32–34].
NB1 ¼ E1 C1 Equation 1
ðE1 E0Þ ðC1 C0Þ>0 Equation 2
where, 1 = evaluated intervention, 0 = comparator,C= cost,E= effectiveness andk= the
threshold value.
INB and cost-effectiveness acceptability curves (CEACs) were estimated at potential
thresh-old values for one extra day at home, the primary outcome [31,35]. Uncertainty for costs,
ef-fects and cost effectiveness were estimated bootstrapping on participants’costs and effects
pairs across 10,000 replicates.
Comparison on the cost-disutility plane
Net benefit correspondence theorem (NBCT). Eckermann [36] and Eckermann, Briggs
and Willan [24] demonstrated a one to one correspondence between (i) maximising NB and
(ii) minimising costs and the decision maker’s value of events from a utility-reducing
perspec-tive. Applying this approach, the equation for INB (Equation 2) [28] is transformed into the
following,
INBi¼ ð DUiþCiÞ ð DUþCÞ Equation 3
whereDUare effects framed from a disutility perspective,Crepresents costs,irepresents the
strategy under consideration andis the optimal strategy at threshold value for a unit of effect.
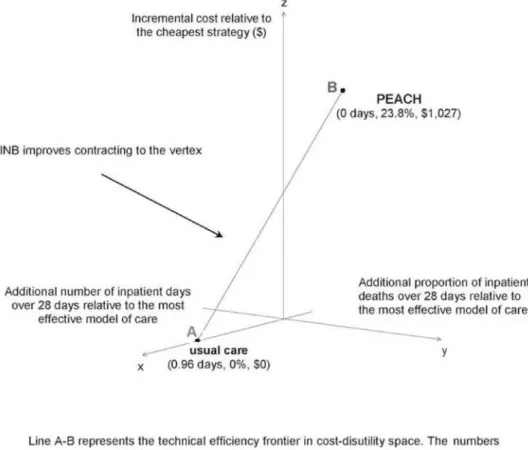
Radial efficiency measures on the CDU plane. Reframing effects from a utility-reducing perspective and comparing strategies on the CDU plane allows NB improvement with contrac-tion to the vertex; that is performance improves with equi-proporcontrac-tionally contraccontrac-tion of costs and effects to the origin. Importantly, these radial properties enable efficiency measures
invari-ant to scale of axes, unlike non-radial efficiency measures [37] and allow conventional
econom-ic, technical and allocative efficiency measures [22–24,29] to be calculated using standard
reflecting combinations of multiple inputs that cannot be proportionally contracted with the
feasible set (convex combination of other strategies) [38].
Farrell [37], in 1957, also showed radial properties enable economic efficiency to be
express-ed as the product of technical and allocative efficiency [37]. Hence when factor prices are
ap-plied [38] efficiency can be calculated [24,26,36] and decomposed into technical and
allocative efficiency components. InFig. 1, BB’represents possible combinations of inputs for a
given cost. S’represents an allocatively efficient point because this lies on the production
possi-bilities frontier with minimal cost given factor prices, i.e. is using the appropriate mix of inputs
given input prices to produce the given output. Allocativeinefficiencyat point T is represented
by RS/0S. That is, the amount by which production costs can be reduced if the ratio of inputs
used by the firm at point T were identical to those used by the firm at point S’, the technically
and allocatively efficient firm [37].
Traditionally results presented graphically on the cost-effectiveness plane use a fixed com-parator with improved performance indicated by south-east movement. Further, with multiple
strategy comparison, the point of reference changes along the efficiency frontier [24]. The use
of standard frontier estimation methods are prevented on the cost-effectiveness plane by the absence of radial properties.
For multiple strategies with asingleeffect, Eckermann et al [24,25] show that comparison
at potential threshold value for effects on the CDU plane naturally leads to considering the net loss (NL) statistic for strategies, the expected net loss (ENL) relative to the strategy maximising NB, ENL curves for each strategy and the ENL frontier as the lower bound of ENL curves.
In this paper use of DEA in CDU space is also shown to facilitate explicit and robust
consid-eration of the interaction of uncertainty between costs andmultipleoutcomes and lead to
use-ful summary measures including:
1. Threshold regions, combinations of threshold values for joint outcomes where alternative
service models maximise NB [38].
2. ENL planes which quantify differences in ENL [28] across threshold values for multiple
out-comes, (i) time at homeand(ii) death at home rather than in an inpatient setting;
3. The ENL contour which identifies the service model that minimises ENL across bootstrapped
replicates for combinations of threshold values across multiple outcomes [24,25]; and
Fig 1. Farrell’s production possibilities frontier for two inputs and one output (adapted from Coelli [41].
4. Cost-effectiveness acceptability planes which show the probability of each service model minimising ENL at given combinations of value of effects for multiple outcomes.
Comparison in cost-disutility space
Technical efficiency frontier. The technical efficiency frontier was constructed using DEA with a Farrell input-orientated technical efficiency model run under constant returns to
scale [39]. Mean incremental cost relative to the cheapest model of care and mean incremental
effects relative to the most effective model of care framed from a disutility perspective were in-cluded as strongly disposable inputs. The resulting frontier identifies service models that
mini-mise cost for given effects framed from a disutility perspective [24–25,36]. A technical
efficiency score of one indicates that service models form part of the technical efficiency fron-tier and minimise costs for given effect rates at some combination of threshold values. Techni-cal efficiency scores less than one indicate the model of care is dominated or extended
dominated by the other strategies and does not form part of the frontier, i.e. is technically inef-ficient. In other words, both cost and disutility of effects can be equi-proportionally reduced relative to a given strategy or convex combinations of other strategies.
Deterministic cost effectiveness analyses. To determine threshold regions where alterna-tive models of care are preferred, NL is first calculated from incremental analysis in CDU
space. Applying the net benefit correspondence theorem [24], the objective of maximising NB
is equivalent to minimising NL. The NL of any given model of care (i) is the loss in NB from
choosingirather than the optimal model of care () at given threshold valuekfor one effect
and can be found as follows:
NLi ¼ ð DUiþCiÞ ð DUþCÞ Equation 4
whereDUis the outcome framed from a utility-reducing perspective andCrepresents costs.
This relationship can be extended to include multiple outcomes [38]. For example, for two
outcomes and two strategies,iandj:
NLi¼ ðð 1DUi1Þ þ ð 2DUi2Þ þCiÞ ðð 1DU1Þ þ ð 2DU2Þ þC Equation 5
NLj¼ ðð 1DUj1Þ þ ð 2DUj2Þ þCiÞ ðð 1DU1Þ þ ð 2DU2Þ þC Equation 6
With deterministic analysis the preferred model of care is the model which minimises mean
NL at any given combination of threshold values, i.e.C + DU1 1+DU2 2is minimised.
There-fore, strategyiis preferred to strategyjwhen the mean NL ofiis lower than the mean NL ofj,
and vice versa. Tofind the regions where alternative models of care are preferred, the boundary
of the regions isfirst determined by equating the NL expressions for adjacent compared
strate-gies on the frontier in CDU space, and solving for 1and 2, i.e.
Ciþ ð 1DUi1Þ þ ð 2DUi2Þ ¼Cjþ ð 1DUj1Þ þ ð 2DUj2Þ Equation 7
Values either side of the boundary readily identify the combinations of potential threshold values where each model minimises the mean NL.
Stochastic cost-effectiveness analyses (accounting for joint uncertainty). Bootstrapping methods allow modelling of uncertainty across the joint distribution of incremental costs and multiple incremental outcomes from the participant-level data, allowing for covariance
be-tween costs and effects [40]. The following measures are calculated using the bootstrap
Choosing a strategy that does not minimise the NL incurs an incremental NL relative to the optimal strategy. For each service model, at a given set of threshold values the NL relative to the NB maximising strategy in each replicate is calculated and averaged across 10,000 replicates
to estimate ENL [24]. An expected loss arises for the proportion of replicates in which the
ser-vice model does not maximise the NB at the specified threshold values, reflecting decision un-certainty given current trial evidence.
As in the case of ENL curves for a single effect [22], ENL planes quantify differences in ENL
across models of care for different combinations of values for effects. ENL planes are formed by varying the threshold values for the multiple effects and re-calculating the average ENL across replicates for each model of care. The distance between planes represents the difference
in ENL between models of care at any set of threshold values for effects under uncertainty [24].
The contour is formed by the lower bound of the ENL planes across models of care, i.e. the lowest ENL values at combinations of threshold values are determined from consideration of
both planes, analogous to the ENL frontier as the lower bound of ENL curves [16,24]. The
con-tour readily identifies the service model that minimises ENL for any set of values [22] for 1
and 2in the case of the PEACH study.
The expected value of perfect information (EVPI) is the loss from a bad decision that could
be avoided with perfect, rather than current information [21]. As with the ENL frontier, the
ENL contour naturally represents the EVPI per patient associated with choosing the strategy
minimising ENL [16,24] given current uncertainty, but as a function of threshold values for
multiple rather than single effects.
Cost-effectiveness acceptability planes (CEAPs) show the probability that each model of care minimises ENL conditional on threshold values for multiple effects. For each model of care, the CEAP is formed by determining the proportion of replicates that minimise ENL for different combinations of threshold values for effects.
Results
Cost-consequences and cost-effectiveness analyses
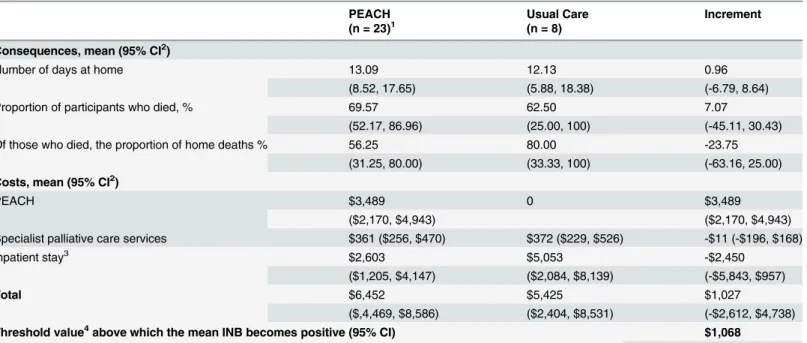
A summary of the trial-based incremental costs and consequences framed from a utility
per-spective are presented inTable 1. INB curves and CEACs are presented in McCaffrey et al [27].
PEACH is the preferred service model when the threshold value for one extra day at home ( 1)
exceeds $1,068 as the value of expected incremental benefits exceeds expected incremental costs. However, the CCA suggests PEACH is dominated by usual care when the proportion of home deaths is considered.
Analysis in cost-disutility space
A summary of the trial-based incremental costs and consequences framed from a
utility-reduc-ing perspective are presented inTable 2. The mean incremental cost relative to the cheapest
model of care and mean incremental effects framed from a disutility perspective relative to the most effective model of care are calculated for each service model. For example, when consider-ing incremental inpatient days, the mean incremental effect for PEACH is zero because
PEACH is the most effective model of care (14.9–14.9). Similarly, as usual care is the cheapest
model of care, the mean incremental cost for usual care is zero ($5,425—$5,425).
Technical efficiency frontier. Both models of care are part of the technical efficiency
fron-tier in CDU space where costs and multiple outcomes are considered (Fig. 2), i.e. both models
of care minimise NL for some set of threshold values for time spent at home and place of
combinations of service models closest to the origin, i.e. those minimising ENL at different combinations of threshold values for effects.
Threshold regions. Following the incremental analysis in CDU space (Table 2), the mean
NL for each model of care can be expressed as follows (seeEquation 7):
Table 1. Summary of incremental costs and outcomes framed from a utility perspective at 28 days for PEACH versus usual care.
PEACH Usual Care Increment
(n = 23)1 (n = 8)
Consequences, mean (95% CI2)
Number of days at home 13.09 12.13 0.96
(8.52, 17.65) (5.88, 18.38) (-6.79, 8.64)
Proportion of participants who died, % 69.57 62.50 7.07
(52.17, 86.96) (25.00, 100) (-45.11, 30.43)
Of those who died, the proportion of home deaths % 56.25 80.00 -23.75
(31.25, 80.00) (33.33, 100) (-63.16, 25.00)
Costs, mean (95% CI2)
PEACH $3,489 0 $3,489
($2,170, $4,943) ($2,170, $4,943)
Specialist palliative care services $361 ($256, $470) $372 ($229, $526) -$11 (-$196, $168)
Inpatient stay3 $2,603 $5,053 -$2,450
($1,205, $4,147) ($2,084, $8,139) (-$5,843, $957)
Total $6,452 $5,425 $1,027
($,4,469, $8,586) ($2,404, $8,531) (-$2,612, $4,738)
Threshold value4above which the mean INB becomes positive (95% CI) $1,068
(-$6,627, $6,578) 1one participant in the PEACH arm was excluded from the analysis due to incomplete cost data;
2calculated with bootstrap analysis; 3hospital or palliative care unit; 4for one extra day at home
doi:10.1371/journal.pone.0115544.t001
Table 2. Summary of incremental costs and outcomes framed from a disutility perspective at 28 days for PEACH versus usual care.
Model of care Increment
PEACH Usual Care PEACH Usual Care
(n = 23)1 (n = 8)
Consequences, mean (95% CI2)
Number of inpatient days 14.91 15.88 03 0.963
(10.35, 19.48) (9.63, 22.13) (0, 6.78) (0, 8.64)
Of those who died, the proportion of inpatient deaths, % 43.75 20.00 23.753 03
(20.00, 68.75) (0, 66.67) (0, 63.16) (0, 25.00)
Costs, mean (95% CI2) $6,452 $5,425 $1,0274 $04
($4,469, $8,586) ($2,404, $8,531) (0, $4,738) (0, $2,612) 1one participant in the PEACH arm was excluded from the analysis due to incomplete cost data;
2calculated with bootstrap analysis;
3relative to the most effective model of care (DU 1i-DU1*);
i. Usual care,NL= $0 + 0.96 1+ 0 2= 0.96 1; and
ii. PEACH,NL= $1,027 + 0 1+ 0.24 2= $1,027 + 0.24 2
Where 1is the threshold value for one extra day at home over 28 days and 2is the threshold
value for one extra home death over 28 days.
Equating the NL expressions determines the boundary between regions of threshold value
combinations where each model of care is preferred, represented by the line inFig. 3.
PEACH is preferred to usual care when the mean NL of PEACH is lower than the mean NL
of usual care, i.e. $1,027 + 0.24 2<0.96 1, simply rearranged to 1>0.25 2+ $1,068. Hence,
for example when threshold values for both an extra day at home ( 1) and home deaths ( 2)
are $2,000, PEACH minimises NL and is the preferred model of care; point A inFig. 3.
Con-versely, when 1= $2,000 and 2= $4,000, usual care is preferred (point B,Fig. 3). This
high-lights that neither alternative dominated the other in CDU space when incremental cost, days
at homeandthe proportion of home deaths are jointly considered.
Expected net loss planes. Fig. 4shows a two dimensional representation of the ENL planes for PEACH and usual care. The threshold value per extra day at home is represented
Fig 2. Technical efficiency frontier in cost-disutility space for PEACH and usual care.
along the x-axis and the mean ENL per patient on the y-axis. Using the previous example,
when 1= $2,000 and 2= $2,000, PEACH minimises the ENL with an average loss in
ex-pected NB of $3,004 per participant. This loss arises as there are a proportion of replicates (4,838/10,000) in which PEACH does not maximise the NB at these threshold values. At these
same values the ENL per patient if usual care is adopted is $3,354. If 1= $2,000 and
2= $4,000 the ENL per patient increases to $3,301 for PEACH and reduces to $3,172 for
usual care. The distance between planes represents the difference in per patient ENL between
models of care at any set of threshold values for effects under uncertainty [24]. For example,
Fig 3. Threshold regions over which each service model is preferred.
doi:10.1371/journal.pone.0115544.g003
Fig 4. Expected net loss planes (two dimensional representation).
when 1= $2,000 and 2= $2,000 the mean ENL per patient if PEACH is adopted is $3,004
and $3,354 if usual care is chosen, with a difference in ENL of $350 per patient.
Expected net loss contour. Fig. 5is a two dimensional representation of the ENL contour
which is formed by the lower bound of the ENL planes across models of care (see Figs.4and5)
[16,24]. The dotted line indicates the combinations of 1and 2, where usual care minimises
the ENL, whereas the solid line illustrates combinations of 1and 2where PEACH minimises
the ENL. Using the previous example, if 1= $2,000 and 2= $2,000, PEACH minimises the
ENL at $3,004 per participant across 10,000 replicates. When 1= $2,000 and 2= $4,000,
usual care minimises the ENL. Furthermore, in the latter scenario choosing usual care mini-mizes ENL at $3,172 but given current uncertainty, PEACH minimini-mizes ENL in 4,905/10,000 replicates. This loss of $3,172 per participant from choosing usual care would be avoided with perfect information as the decision-maker would be able to pick the service model minimizing ENL in each realisation.
Cost-effectiveness acceptability planes. Fig. 6shows the CEAPs which represents the probability that the strategy under consideration minimizes ENL at given combinations of
value of effects for multiple outcomes. For example, when 1= $2,000 and 2= $4,000 there is
a 49.05% chance that PEACH is the preferred option because PEACH minimizes ENL in 4,905/10,000 replicates.
Discussion
When assessing the cost effectiveness of interventions with multiple outcomes, presentation in CDU space and use of ENL planes and contours to summarise cost effectiveness has been illus-trated to overcome limitations of conventional CEA and CCA analysis. Partial analysis, where individual outcomes and costs are considered separately, suggested PEACH is associated with higher costs and increased benefits over 28 days relative to usual care when time spent at home was the sole measure considered. However, PEACH was dominated by usual care when the proportion of home deaths alone was considered. These results illustrate that choice of effect where analysis is restricted to single effect substantially alters cost-effectiveness inferences. In
Fig 5. Expected net loss contour (two dimensional representation).
comparison, neither service model dominated in CDU space, when incremental cost and mul-tiple outcomes were jointly considered. Compared with CCA the proposed approach has dis-tinct advantages in allowing for joint uncertainty of incremental cost and outcomes, and cost
effectiveness. If societal decision making asymptotes to risk neutrality [26,41] then findings
suggest PEACH maximises expected NB when 1>0.25 2+ $1,068. If preferences are
some-what risk-averse, trade-offs may also arise between minimising ENL and maximising the prob-ability of minimising ENL across compared strategies for discrete regions of threshold values.
This paper extends previous work showing advantages of the CDU plane for comparing multiple strategies. Cost and multiple effects of alternative models of care are clearly presented in CDU space, facilitating identification, presentation and exploration of trade-offs between ef-fects. Collectively, the new summary measures compared expected NB between strategies across any set of feasible threshold values for multiple effects and the impact of joint uncertain-ty. Threshold regions display the combinations of values over which alternative models of care minimise mean NL or equivalently maximise NB. ENL planes present differences in ENL be-tween alternatives, while the ENL contour simultaneously establishes: (i) the intervention that minimises ENL; and (ii) EVPI with current evidence. Finally, CEAPs estimate the probability that interventions minimise ENL. This may be of particular interest across discrete threshold regions where the model of care with the lowest ENL does not have the greatest probability of
minimising ENL if societal decision making remains somewhat risk averse [41]. However, it
should be stressed that CEAPs, like CEACs, do not directly identify the strategy that minimises
ENL [25], unlike ENL planes and contours. The summary measures presented in this paper
allow decision-makers to explicitly trade off expected return on investment with the risk of re-turn at different relative and absolute threshold values for multiple outcomes.
Table 3contrasts and summarises suggested graphical representation and summary mea-sures for informing societal decision making when comparing two strategies and multiple strategies with single and multiple effects.
Fig 6. Cost-effectiveness acceptability planes (two dimensional representation).
Contemporary economic evaluation methods are limited when comparing interventions with multiple outcomes. Although CCA explicitly presents multiple outcomes and costs, they are considered independently rather than jointly when allowing for uncertainty. Also, this ap-proach does not allow for differences in ENB. Multiple outcomes comparison in CDU space re-tains advantages of CCA in comparing multiple outcomes while additionally allowing rigorous assessment of joint uncertainty across multiple outcomes and estimation of differences in ENL. Furthermore, the ability of the methods developed to allow for different relative preferences
[42] is also valuable for informing individual patient and population level decisions
under uncertainty.
Cost-benefit analysis could include multiple effects. However, this approach is limited by the difficulties of valuing health outcomes in monetary terms and the influence of ability to pay
on willingness to pay [43,44]. Multiple outcomes comparison in CDU space allows explicit
Table 3. Best presentation and summary measures for informing risk-neutral and somewhat risk averse decision making [25].
Risk preferences
Scenario Risk-neutral# Somewhat risk averse^
Two strategies & one effect
CE plane CE plane INB curve INB curves & CI ENL curves &
frontier
CEA curve
ENL curves & frontier Two strategies &
multiple effects
Frontier in CDU space$
Frontier in CDU space$ Threshold
regions
Threshold regions ENL planes and
contour
ENL planes and contour CEAP
Multiple strategies & a single effect
CDU plane CDU plane ENL curves &
frontier
ENL curves and frontier
Trade-offs in discrete threshold regions where they arise between minimising ENL and P(min NL) taken from relevant bilateral CEA curves
Multiple strategies & multiple effects
Frontier in CDU
space$ Frontier in CDU space $
Threshold regions
Threshold regions ENL planes &
contour
ENL planes and contour
Trade-offs in discrete threshold regions where they arise between minimising ENL and P(min NL) taken from relevant bilateral CEAPs
#objective is to maximise ENB;
^trade-offs can arise over discrete threshold regions between the strategy maximising ENB and strategies with a higher probability of maximising NB relative to that strategy;
$for a maximum of two effects; CDU = cost-disutility; CE = cost-effectiveness; CEA = cost-effectiveness acceptability; CEAP = cost-effectiveness acceptability plane; CI = confidence intervals; ENL = expected net loss; INB = incremental net monetary benefit; P(min NL) = probability of minimising net loss
exploration of relative and absolute monetary values for multiple outcomes on preferred strate-gies. Further, this approach permits robust analysis of the impact of uncertainty around mone-tary threshold values with ENL contours.
Cost-effectiveness analysis is limited by a uni-dimensional measure, where choice of out-come can give rise to outout-come selection bias as illustrated in this paper. Cost-utility analysis (CUA) is limited by narrowly defined health-related QOL domains in the commonly applied generic MAUIs which exclude important domains unable to be integrated with patient survival
in complex disease areas such as palliative care, e.g. utility from preparing for death [45], carer
and family impacts and non-health outcomes [46]. The novel methodology presented in this
paper enables simultaneous evaluation of such diverse domains of effect.
Previously there have been only a few attempts to develop specific methods to evaluate and present costs and multiple outcomes under uncertainty in an explicit manner. Bjorner and
Keiding [47] proposed a relative cost-effectiveness measure. Negrin and Vazquez-Polo [48]
presented an alternative Bayesian cost-effectiveness framework. The Bjorner and Keiding ap-proach compares the performance of each intervention relative to the worst performing
inter-vention in a set of interinter-ventions using DEA [47]. However, their relative cost-effectiveness
measure does not inform decisions between non-dominated interventions, nor allow consider-ation of stochastic uncertainty, or allow estimconsider-ation of the probability of maximising expected
NB. The Bayesian methodology [48] graphically represents the intervention most likely to
maximise NB at various combinations of threshold values for multiple outcomes using a cost-effectiveness acceptability frontier. Geometrically, this is similar to the CEAP derived from comparison in CDU space. However, neither of these previous approaches provides summary measures for quantifying differences in ENB between strategies under uncertainty, which is the critical comparison required to inform risk-neutral or somewhat risk-averse decision
making [25,41].
In this paper, the NBCT is applied with CEA to inform health technology assessment. Simi-larly, the novel approach to multiple outcome comparison illustrated here could be applied to compare multiple outcomes, objectives and facets of chronic disease management programs
[49], health promotion and disease prevention in complex community care settings [50–56].
Multiple aspects relevant to such comparisons might include self-management capability, co-ordination and process aspects of care, network impacts and community uptake and ownership of promotion interventions in complex settings. Other forms of multiple criteria decision anal-ysis (MCDA) have been proposed to allow for multiple objectives and outcomes in some of
these settings [57,58]. The NBCT [24–26] applied to multiple outcomes [59] would enable a
comparison of such multiple criteria consistent with maximising NB and is summarised with
ENL planes and contours. Unlike CEACs [58] and other transformations proposed, the ENL
planes and contour and ENL curves and frontiers [24] are consistent with differences in ENB.
This is particularly important given the primary importance under the Arrow-Lind theorem
[41] to compare differences in ENB and avoid confounding of relevant probabilities between
potentially optimal strategies that arises with multiple strategy CEACs in multiple strategy
comparisons [25]. Consequently, application of the proposed methodology in alternative
health promotion and prevention settings as well as disease areas, with their associated multiple effects or criteria of interest for decision making are suggested as valuable. Applying the values and preferences of individuals, different patient populations and societal decision makers across jurisdictions for relevant multiple outcomes should be considered in future research to further demonstrate the flexibility of this approach.
service, technology or strategy [22,32–34]. That is, the opportunity cost of reimbursing a new technology is the most cost-effective expansion of existing services financed by contraction or displacement of the least cost-effective service. The opportunity cost and threshold value should be estimated allowing for characteristic allocative and displacement inefficiency in
health systems where the least cost-effective program in contraction (ICER =m) has a higher
ICER than the most cost-effective program in expansion (ICER =n) and displaced services
(ICER =d). The health shadow price derived by Pekarsky [34] (seeEquation 8), allows for
allo-cative inefficiency (n<m) and displacement inefficiency (d<m) to reflect the opportunity
cost of best alternative adoption and financing actions in reimbursing new technology.
bc ¼ 1
nþ 1
dþ 1
m
1
Equation 8
The health shadow price threshold has a value ofn, equivalent to the ICER of the most
cost-effective expansion of current programs if displacement is efficient (d=m), but is less thann
where displacement is suboptimal (d<m), reflecting the potential to improve displacement as
well as adoption actions [22]. In the case of multiple effects the associated threshold values
should be determined by their relevant health shadow prices as these represent the best alterna-tive way for societal decision makers to achieve each outcome.
Multiple outcomes analysis in CDU space with use of the ENL contour as a summary mea-sure while highlighting which strategy optimises ENB across potential threshold values for
ef-fects also naturally represents the expected value of perfect information [24,25]. This provides
a starting point to consider use of value of information (VOI) methods to inform decisions under uncertainty of whether undertaking further research is optimal. VOI methods aid opti-misation of trial design in maximising expected return on investment from further research, comparing the expected value relative to expected cost of additional research allowing for
rele-vant decision contexts [16,21,60,61].
Limitations
Despite distinct advantages over existing methods for multiple outcome comparisons, there are some issues to consider. While multiple outcomes comparison presented in CDU space enables flexible and robust comparison under uncertainty, as with other multiple outcome approaches issues of valuation and trade-offs between outcomes arise. Relative decision-maker threshold values are required for funding or policy decisions in any jurisdiction of interest for their popu-lation, practice, and preferences conditional on the budget constrained decision context wheth-er based on cost-effectiveness, cost-utility or cost-benefit analyses. Multiple outcomes
comparison in CDU space, unlike alternative methods, enables explicit joint comparison of costs and multiple outcomes prior to valuation and encourages explicit valuation and acknowl-edgment of trade-offs between outcomes in the decision-making process. These issues are particularly important where the maximand for cost-effectiveness analysis is not stated. In cost-utility analyses, multiple threshold valuation also occurs for different outcomes or do-mains within the MAUI but is less explicit or readily identified. Generally, valuing effects should, as with the proposed approach, be explicit to enable appropriate translation of impacts to decision making in different contexts.
backgrounds and hence application of these methods to fully exploit the benefits of multiple outcomes comparison in CDU space could require educational support to aid knowledge trans-lation. Despite this, the general formulae promote transferability of the method across different populations and jurisdictions given different values can be imputed for each outcome depend-ing on perspective and context.
Further research is required to exploit the societal decision making advantages of robustly comparing multiple outcomes and multiple strategies in CDU space illustrated in this paper. Application of the approach in alternative disease areas, with different numbers of multiple ef-fects and/or strategies would be particularly valuable. The views of bodies and individuals in-volved in societal-decision making on the relative merits of alternative presentation and summary measures for evaluating the cost-effectiveness of interventions with multiple effects could also be sought to explore the interface between theoretical and practical advantages and lead to further development of the methodology in practice.
Conclusion
Better methods are needed to compare the cost effectiveness of alternative strategies with mul-tiple outcomes under uncertainty in complex service delivery areas such as palliative care. On the cost-effectiveness plane analysis is restricted to one outcome and not all outcome domains can be integrated with survival in estimating QALYs. Furthermore, cost-consequences analyses fail to allow for joint uncertainty across outcomes. Comparison in CDU space with ENL planes, contours and CEAPS have been shown to allow presentation of uncertainty across multiple outcomes with summary measures quantifying differences in ENB and the probability of maxi-mising ENB at any given set of threshold values for multiple outcomes. Incorrect inferences are avoided using these presentation and summary measures and neutral or somewhat risk-averse societal decision making better informed, while the potential value of future research (EVPI) is also estimated. In summary, analysis in CDU space provides a readily accessible and systematic way to compare multiple outcomes in CEA and NB assessment under uncertainty. In comparing multiple strategies a more robust picture of the likely trade-offs between costs and benefits, the consequences of funding decisions and the need for future research reduces
inferential errors and better informs societal decisions [16,21,62,63].
Supporting Information
S1 File. Raw data.(DOCX)
Acknowledgments
The authors wish to thank the patients and carers involved in the PEACH study and the pallia-tive care staff from South Western Sydney Local Health District for their help and participation in the pilot study. Thanks also go to Ms. Debbie Marriott for her assistance with manuscript formatting and submission and the reviewers for their valuable comments on earlier drafts.
Author Contributions
References
1. Drummond M, Sculpher M, Torrance G, O’Brien B, Stoddart G (2005) Methods for the economic evalu-ation of health care programmes. Oxford, UK: Oxford University Press. p137–209 PMID:15693028
2. Sindelar JL, Jofre-Bonet M, French MT, McLellan AT (2004) Cost-effectiveness analysis of addiction treatment: paradoxes of multiple outcomes. Drug and Alcohol Dependence 73: 41–50. PMID: 14687958
3. Al-Janabi H, McCaffrey N, Ratcliffe J (2013) Carer Preferences in Economic Evaluation and Healthcare Decision Making. The Patient—Patient-Centered Outcomes Research 6: 235–239.
4. Hoch JS, Dewa CS (2007) Lessons from trial-based cost-effectiveness analyses of mental health inter-ventions: why uncertainty about the outcome, estimate and willingness to pay matters. Pharmacoeco-nomics 25: 807–816. PMID:17887803
5. Brooks R, Rabin R, de Charro F (2003) The Measurement and Valuation of Health Status Using EQ-5D: A European Perspective. Dordrecht, The Netherlands: Kluwer Academic Publishers.
6. Ratcliffe J, Buxton M (1999) Patients’preferences regarding the process and outcomes of life-saving technology. An application of conjoint analysis to liver transplantation. Int J Technol Assess Health Care 15: 340–351. PMID:10507193
7. Ratcliffe J, Van Haselen R, Buxton M, Hardy K, Colehan J, et al. (2002) Assessing patients’ prefer-ences for characteristics associated with homeopathic and conventional treatment of asthma: a con-joint analysis study. Thorax 57: 503–508. PMID:12037224
8. Shih A, Schoenbaum S (2007) Measuring Hospital Performance: The Importance of Process Mea-sures: The Commonwealth Fund.
9. Agar M, Currow DC, Shelby-James TM, Plummer J, Sanderson C, et al. (2008) Preference for place of care and place of death in palliative care: are these different questions? Palliative Medicine 22: 787–795. doi:10.1177/0269216308092287PMID:18755830
10. McCaffrey N, Currow DC, Eckermann S (2009) Measuring Impacts of Value to Patients Is Crucial When Evaluating Palliative Care. Journal of Pain and Symptom Management 37: e7–e9. doi:10.1016/ j.jpainsymman.2008.11.010PMID:19500720
11. Cohen S MB, Bruera E, Provost M, Rowe J, Tong K (1997) Validity of the McGill Quality of Life Ques-tionnaire in the palliative care setting: a multicentre Canadian study demonstrating the importance of the existential domain. Palliative Medicine 11: 3–20. PMID:9068681
12. Gold MR, Menzel P, Nord E, Pinto-Prades J-L, Richardson J, et al. (1999) Toward a Broader View of Values in Cost-Effectiveness Analysis of Health. The Hastings Center Report. p7.
13. Currow DC, Burns C, Agar M, Phillips J, McCaffrey N, et al. (2011) Palliative Caregivers Who Would Not Take on the Caring Role Again. Journal of Pain and Symptom Management 41: 661–672. doi:10. 1016/j.jpainsymman.2010.06.017PMID:21227632
14. Al-Janabi H, Flynn TN, Coast J (2011) QALYs and carers. PharmacoEconomics 29: 1015–1023. doi: 10.2165/11593940-000000000-00000PMID:22077576
15. Brazier JE, Rowen D, Mavranezouli I, Tsuchiya A, Young T, et al. (2012) Developing and testing meth-ods for deriving preference-based measures of health from condition-specific measures (and other patient-based measures of outcome). Health Technol Assess 16: 1–114.
16. Eckermann S, Karnon J, Willan AR (2010) The Value of Value of Information: Best Informing Research Design and Prioritization Using Current Methods. PharmacoEconomics 28: 699–709. doi:10.2165/ 11537370-000000000-00000PMID:20629473
17. Sculpher MJ, Price M (2003) Measuring costs and consequences in economic evaluation in asthma. Respir Med 97: 508–520. PMID:12735668
18. Coast J (2004) Is economic evaluation in touch with society’s health values? BMJ 329: 1233–1236. PMID:15550430
19. Briggs A, O’Brien B (2001) The Death of Cost-Minimization Analysis? Health Economics 10: 179–184. PMID:11252048
20. Briggs AH, O’Brien BJ, Blackhouse G (2002) Thinking Outside the Box: Recent Advances in the Analysis and Presentation of Uncertainty in Cost-Effectiveness Studies. Annual Reviews Public Health 23: 377–401.
21. Eckermann S, Willan AR (2007) Expected value of information and decision making in HTA. Health Economics 16: 195–209. PMID:16981193
22. Eckermann S, Pekarsky B (2014) Can the real opportunity cost stand up: displaced services, the straw man outside the room. Pharmacoeconomics 32: 319–325. doi:10.1007/s40273-014-0140-3PMID: 24515251
24. Eckermann S, Briggs A, Willan A (2008) Health technology assessment in the cost-disutility plane. Medical Decision Making 28: 172–181. doi:10.1177/0272989X07312474PMID:18356312
25. Eckermann S, Willan A (2011) Presenting evidence and summary measures to best inform societal de-cisions when comparing multiple strategies. PharmacoEconomics 29: 563–577. doi:10.2165/ 11587100-000000000-00000PMID:21671686
26. Eckermann S, Coelli T (2013) Including quality attributes in efficiency measures consistent with net benefit: creating incentives for evidence based medicine in practice. Soc Sci Med 76: 159–168. doi: 10.1016/j.socscimed.2012.10.020PMID:23153543
27. McCaffrey N, Agar M, Harlum J, Karnon J, Currow D, et al. (2013) Is home-based palliative care cost-effective? An economic evaluation of the Palliative Care Extended Packages at Home (PEACH) pilot. BMJ Supportive & Palliative Care 3: 431–435.
28. Stinnett AA, Mullahy J (1998) Net health benefits: a new framework for the analysis of uncertainty in cost-effectiveness analysis. Medical Decision Making 18: S68–80. PMID:9566468
29. Willan AR, Lin DY (2001) Incremental net benefit in randomized clinical trials. Stat Med 20: 1563–1574. PMID:11391688
30. Zethraeus N, Johannesson M, Jonsson B, Lothgren M, Tambour M (2003) Advantages of using the net-benefit approach for analysing uncertainty in economic evaluation studies. Pharmacoeconomics 21: 39–48. PMID:12484802
31. Stinnett A (1996) Net Health Benefits: a new framework for the evaluation of uncertainty in medical cost-effectiveness analysis. Medical Decision Making 16: 463.
32. Birch S, Gafni A (1992) Cost effectiveness/utility analyses. Do current decision rules lead us to where we want to be? J Health Econ 11: 279–296. PMID:10122540
33. Pekarsky B (2010) Should financial incentives be used to differentially reward‘me-too’and innovative drugs? PharmacoEconomics 28: 1–17. doi:10.2165/11587410-000000000-00000PMID:21182340
34. Pekarsky B (2012) Trusts, constraints and the counterfactual: reframing the political economy of new drugs (PhD dissertation). University of Adelaide.
35. Fenwick E, Byford S (2005) A guide to cost-effectiveness acceptability curves. Br J Psychiatry 187: 106–108. PMID:16055820
36. Eckermann S (2004) Hospital Performance Including Quality: Creating Economic Incentives Consistent with Evidence-Based Medicine. (PhD Dissertation), University of New South Wales, Sydney.
37. Farrell MJ (1957) The Measurement of Productive Efficiency. Journal of the Royal Statistical Society Series A (General) 120: 253–290.
38. McCaffrey N, Karnon J, Currow D, Eckermann S (2010) The Old Dog & the Poor Relation: Informing funding decisions in palliative care with cost-consequence analysis in the cost-disutility plane. Palliative Medicine 24: S207. doi:10.1177/0269216310366390PMID:20522880
39. Coelli T (1996) A guide to DEAP Version 2.1: A data envelopment analysis (computer) program. CEPA Working Papers. Armidale, NSW 2351: Department of Econometrics, University of New England.
40. Campbell MK, Torgerson DJ (1999) Bootstrapping: estimating confidence intervals for cost-effectiveness ratios. QJM 92: 177–182. PMID:10326078
41. Arrow KJ, Lind RC (1970) Uncertainty and the Evaluation of Public Investment Decisions. The Ameri-can Economic Review 60: 364–378.
42. Hanson LC, Winzelberg G (2013) Research priorities for geriatric palliative care: goals, values, and preferences. J Palliat Med 16: 1175–1179. doi:10.1089/jpm.2013.9475PMID:24007351
43. Pharmaceutical Benefits Advisory Committee (2008) Guidelines for preparing submissions to the Phar-maceutical Benefits Advisory Committee (Version 4.3). Canberra: Department of Health & Ageing, Commonwealth of Australia.
44. National Institute for Clinical Excellence (2008) Guide to the methods of technology appraisal. London, UK: National Institute for Clinical Excellence.
45. McCaffrey N, Currow DC (2010) Psychometric development of a single-item end-of-life patient-reported outcome (EOLPRO): the first piece of the puzzle. Palliative Medicine, 24: s58.
46. Williams I, McIver S, Moore D, Bryan S (2008) The use of economic evaluations in NHS decision-making: a review and empirical investigation. Health Technology Assessment 12: 1–58. PMID: 18796263
47. Bjorner J, Keiding H (2004) Cost-effectiveness with multiple outcomes. Health Economics 13: 1181–1190. PMID:15386670
49. Lemmens KM, Nieboer AP, Rutten-Van Molken MP, van Schayck CP, Asin JD, et al. (2010) Application of a theoretical model to evaluate COPD disease management. BMC Health Serv Res 10: 81. doi:10. 1186/1472-6963-10-81PMID:20346135
50. Hawe P, Ghali L (2008) Use of social network analysis to map the social relationships of staff and teach-ers at school. Health Educ Res 23: 62–69. PMID:17289659
51. Hawe P, Shiell A (2000) Social capital and health promotion: a review. Soc Sci Med 51: 871–885. PMID:10972431
52. Hawe P, Shiell A, Riley T (2004) Complex interventions: how“out of control”can a randomised con-trolled trial be? BMJ 328: 1561–1563. PMID:15217878
53. Hawe P, Shiell A, Riley T (2009) Theorising interventions as events in systems. Am J Community Psy-chol 43: 267–276. doi:10.1007/s10464-009-9229-9PMID:19390961
54. Shiell A, Hawe P (1996) Health promotion community development and the tyranny of individualism. Health Econ 5: 241–247. PMID:8817298
55. Shiell A, Hawe P, Gold L (2008) Complex interventions or complex systems? Implications for health economic evaluation. BMJ 336: 1281–1283. doi:10.1136/bmj.39569.510521.ADPMID:18535071
56. Eckermann S, Dawber J, Yeatman H, Quinsey K, Morris D (2014) Evaluating return on investment in a school based health promotion and prevention program: The investment multiplier for the Stephanie Al-exander Kitchen Garden National Program. Soc Sci Med 114: 103–112. doi:10.1016/j.socscimed. 2014.05.056PMID:24922607
57. Tsiachristas A, Cramm JM, Nieboer A, Rutten-van Molken M (2013) Broader economic evaluation of disease management programs using multi-criteria decision analysis. Int J Technol Assess Health Care 29: 301–308. doi:10.1017/S0266462313000202PMID:23759317
58. Postmus D, Tervonen T, van Valkenhoef G, Hillege HL, Buskens E (2013) A multi-criteria decision anal-ysis perspective on the health economic evaluation of medical interventions. Eur J Health Econ. Jul 11 (epub ahead of print).
59. McCaffrey N (2013) Modelling joint cost and multiple outcomes uncertainty on the cost-disutility plane: case studies in palliative care (PhD dissertation). Central Library: Flinders University.
60. Willan AR, Eckermann S (2012) Value of information and pricing new healthcare interventions. Phar-macoeconomics 30: 447–459. doi:10.2165/11592250-000000000-00000PMID:22591129
61. Kent S, Briggs A, Eckermann S, Berry C (2013) Are value of information methods ready for prime time? An application to alternative treatment strategies for NSTEMI patients. Int J Technol Assess Health Care 29: 435–442. doi:10.1017/S0266462313000433PMID:24290337
62. Claxton K, Briggs A, Buxton MJ, Culyer AJ, McCabe C, et al. (2008) Value based pricing for NHS drugs: an opportunity not to be missed? Bmj 336: 251–254. doi:10.1136/bmj.39434.500185.25PMID: 18244997
![Fig 1. Farrell’s production possibilities frontier for two inputs and one output (adapted from Coelli [41].](https://thumb-eu.123doks.com/thumbv2/123dok_br/18401956.358799/5.918.305.668.118.360/farrell-production-possibilities-frontier-inputs-output-adapted-coelli.webp)


![Table 3. Best presentation and summary measures for informing risk-neutral and somewhat risk averse decision making [25].](https://thumb-eu.123doks.com/thumbv2/123dok_br/18401956.358799/13.918.300.867.154.663/table-presentation-summary-measures-informing-neutral-somewhat-decision.webp)
