A
R
T
IG
O
A
R
T
IC
L
E
1 Hospital de Clínicas de
Porto Alegre, Instituto de Avaliação de Tecnologias em Saúde. R. Ramiro Barcelos 2350 Prédio 21. 90035-903 Porto Alegre RS. [email protected]
2 Universidade Federal do
Rio Grande do Sul.
Health-related quality of life in Brazil: normative data for the
SF-36 in a general population sample in the south of the country
Qualidade de vida relacionada à saúde no Brasil: dados normativos
para o SF-36 em uma amostra da população geral do sul do Brasil
Resumo O objetivo deste trabalho foi
disponibili-zar escores normativos do SF-36 em uma amostra da população geral no Brasil e descrever as dife-renças de escores médios de acordo com caracterís-ticas sociodemográficas. O questionário SF-36 foi aplicado a uma amostra aleatória da população geral de Porto Alegre. A taxa de resposta foi de 68% e 755 indivíduos foram incluídos, 38% homens e 62% mulheres. O pior estado de saúde foi visto em mulheres, em indivíduos na faixa etária de 30 a 44 anos, de uma classe econômica mais baixa, com menor escolaridade e com autorrelato de uma con-dição médica crônica. Os resultados dos escores do SF-36 são apresentados como dados normativos para a população geral. O SF-36 foi um instru-mento aceitável e prático para medir a qualidade de vida relacionada à saúde. Os resultados deste estudo podem ser úteis para pesquisadores utili-zando o SF-36 em outros grupos para comparar os escores com dados normativos, ele pode ser uma boa ferramenta para detectar grupos vulneráveis em estudos epidemiológicos, pela capacidade de discriminar diferentes subgrupos da população. Palavras-chave Qualidade de vida, Nível de saú-de, Epidemiologia
Abstract The objective of this study was to
pro-vide normative SF-36 scores in a general popula-tion sample in Brazil and to describe differences in m ean scores according to socio-dem ographic characteristics. The SF-36 questionnaire was dis-tributed to a randomly selected sample of the gen-eral population of Porto Alegre in the State of Rio Grande do Sul. The response rate was 68% and 755 subjects were included (38% male, 62% fe-male). Lower health status was revealed among females in the 30 to 44 year age bracket, from the lower income class, with less education and self-reported chronic medical conditions. The results and percentiles of scores of the SF-36 are reported as normative data for the general population. The SF-36 was an acceptable and practical instrument for measuring health-related quality of life in a sample of Brazilians. The results of this study can be useful for researchers using the SF-36 ques-tionnaire in other groups to compare the scores with norm ative data. The SF-36 m ay prove a valuable tool for discovering vulnerable groups in epidemiological studies due to the ability to dis-criminate between different population subgroups. Key words Quality of life, Epidemiology, Health status indicators
Luciane Nascimento Cruz 1
Marcelo Pio de Almeida Fleck 2
Michele Rosana Oliveira 2
Suzi Alves Camey 2
Juliana Feliciati Hoffmann 2
Ângela Maria Bagattini 2
C
ru
z
Introduction
The im portan ce of quality-of-life assessm en t (QOL) has been expressively growing in the past 50 years. Some factors that have contributed to the increased use include the accumulation of evidence that it is a valid and reliable measure, the publication of clinical studies demonstrating that these m easures are responsive to clinical changes, and the development of shorter instru-ments easier to use and understand¹.
One of the most used health-related quality of life (HRQOL) instrument worldwide is the Medical Outcomes Study Short-Form 36 (SF-36)². The SF-36 was created from the necessity of having a standardized instrum ent that would address general health concepts not specific for any medical condition, and that were understand-able, easy to use and psychometrically appropri-ate. The conceptual basis for the development of SF-36 were the concepts of functional status and well-being described in accepted definitions of “health”². Thus, the concept of quality of life con-sidered in the elaboration of this instrument was the health-related quality of life, emphasizing the specific impact that prevention and treatment of a disease has on the “value of being alive”.
The health concepts assessed by the SF-36 are: physical functioning, social functioning, role func-tioning, general health and mental health per-ceptions, pain and vitality. As a generic instru-ment, it is useful for comparing general and spe-cific populations, comparing the relative impact of diseases, differentiating the benefits produced by different treatments and screening individual patients³.
SF-36 has been translated into several lan-guages and adapted to several cultures. The In-ternational Quality of Life Assessment (IQOLA) is the project of a group of researchers from Eu-rope and the United States where the guidelines for the translation and cultural adaptation pro-cess of SF-36 were delineated, which consists of 3 stages: 1. Translation; 2. Psychometric evalua-tion of the items; 3. Empirical validaevalua-tion and norming of scores4. Normative data enable the
interpretation of scores of the instrument for an individual or the average of a group, since there is no “gold standard” against which to compare the results obtained with this instrument. Popu-lation norms are available for many developed countries4, but there are a limited number of
stud-ies reporting these data in developing ones5,6. In
Latin America, translations and validations of the SF-36 are available for a few countries7,8, but
this is the first study, of our knowledge, to report population normative data in this context. This is seems to be an important research question, since Brazil is the only Latin American country that speaks Portuguese and adds in its territory several ethnic groups and cultures, thus requir-ing regional normative data for comparison of health-related quality of life scores.
Methods
Sampling
The sample consisted of individuals selected from the general population of Porto Alegre, a capital city in the South of Brazil. This is a city with 1,436,123 inhabitants, being the capital of one of the most developed states of the country, with 97% of the population living in urban areas, per capita GDP of approximately US$ 13,000.00 and a literacy rate of 96.7%9.
The estimated sample size was 800 individu-als, according to the minimum sample size rec-ommended by IQOLA project4.
A two-stage cluster random selection design was used. In a first stage of sampling, a random sample of 108 census sectors of the city was ob-tained, divided by the Brazilian Institute of Ge-ography and Statistics (IBGE). To calculate the number of households to be visited, the average number of adults per household was considered, and the population’s proportion in each one of the strata the study aimed to reach, that is, men and women in the age ranges of 20-29, 30-44, 45-64 years. In each sector, 7 households to be visit-ed were sistematically selectvisit-ed and all residents were invited to participate in the study if they met the following inclusion criteria: age ranging from 20 to 64 years; be literate; not having any physical or mental limitation that could prevent the read-ing and understandread-ing of the instruments. If the residents were not found in the first visit, anoth-er two visits in diffanoth-erent days and times, includ-ing non-business hours, were carried out. A cov-er lettcov-er containing the team identification and purposes of the study, time to be spent on the interview and phone numbers was provided to residents present in the first visit, or deposited in the mailbox of the selected households.
Instruments
S
aú
d
e C
o
le
tiv
a, 1
8
(7
):1
9
1
1
-1
9
2
1
, 2
0
1
3
construct is represented by 36 questions divided into eight domains: physical functioning, role physical, pain, general health, vitality, role social, role em otion al an d m en tal health. Item s are scored by a Likert scale. All items of SF-36 are used to score the eight domains, except for item 2, which refers to a self-report of health transi-tion. Each item contributes to only one domain. After recalibrating two items and reverse the score of nine items, the responses to items are summed. The highest scores represent better health status. One score for missing values is computed if items of one scale are not responded. Scores range from 0 to 100, 0 indicating the less favorable health status and 100 the most favorable one. SF-36 is a questionnaire that can be administered by: self-adm in istration , self-adm in istration by com puter, personally or by phone calls by a trained inter-viewer and is adequate for individuals above 14 years of age. It can be administered in 5 to 10 minutes with high degree of acceptability and quality of data3.
The SF-36 employed in this study was previ-ously translated into Portuguese and validated in Brazil by Ciconelli et al.7. The study was
per-formed with a population of patients with rheu-matoid arthritis, using the protocol elaborated in compliance with some steps proposed by the IQOLA coordinators10.
A standardized questionnaire was used to obtain socio-economic and demographic data and contained the following variables: gender, age, race, marital status, practice of any religion, em-ployment status and economic class, number of medical consultations and admissions in the last year, smoking and alcohol use. The presence of chronic diseases was assessed by a list of diseases with dichotomous response (yes/no): hyperten-sion, diabetes, ischemic cardiopathy (infarct/an-gin a), heart failu re, arthrosis/arthritis, cere-brovascular accident, chronic bronchitis/ emphy-sema, asthma, kidney disease, cancer, HIV/AIDS, back pain, depression and anxiety, and one open question codified as “others”.
The economic class was assessed by an index called Brazil Criterion (Critério Brasil) which di-vides the population into classes according to their purchasing power and schooling of the fam-ily head11. The classification and its equivalence
concerning approximate mean family income in American dollars would be: Class A1: Mean fam-ily income of US$ 3,800; Class A2: US$ 2,300; Class B1: US$ 1,400; Class B2: US$ 800; Class C: US$ 460; Class D: US$212, and Class E: US$ 103.
Statistical analysis
Continuous data are expressed as means ± standard deviation and categorical in percent-age. Comparisons of QOL mean scores among groups according to socio-demographic charac-teristics were performed by ANOVA, Brown-Fo-sythe or t-test. ANOVA was used when there was homogeneity of variances and Brown-Fosythe when there were not both of them for compari-sons between two or more groups. Levene’s test was used to perform tests of hom ogeneity of variances.
For all tests a significance level was established at < 0.05. Data were analyzed using SPSS for Win-dows, version 13.0 (IBM Company, Chicago) and Microsoft Office Excel 2003.
Results
From July/2007 to July/2009, 1057 households were visited, being possible to perform the inter-views in 514 (49%), because for the others it was impossible to contact dwellers after 3 consecu-tive visits or people refused to welcome the study team. From 1119 eligible individuals, identified and contacted, 758 participated in the project, achieving a response rate of 68%. The number of eligible individuals includes all the households in which the research team was able to contact, even households where people refused to participate, because we could collect information regarding the number of people aged from 20 to 64 living at the addresses contacted.
It was necessary to exclude 3 individuals from the sample, 2 (0.3%) for error in the age record and 1 (0.1%) for not responding more than 50% of the SF-36 items, totaling 755 participants with data available for analysis.
peo-C
ru
z
ple of lower purchasing power, may also justify the low level of D class and the lack of E class.
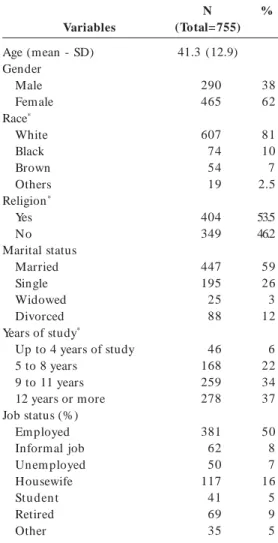
The socio-demographic characteristics of the sample are described in Table 1. The mean age of the sample was 41 ± 13 years and 62% of the participan ts were fem ales. Respon den ts were
mostly married, white, practiced a religion, and with form al em ploym ent. The m ean of study years was 11.3 ± 5.1, and 37% of the sample with 12 years or above of study.
Forty nine percent of participants reported having some chronic medical condition, the most common being hypertension (13.5%), arthritis (8.3%), asthm a (7.5%), and diabetes m ellitus (4.6%). Depression was reported by 14% of the sample and anxiety by 21%.
Seven hundred forty-eight participants (99%) responded to all questions of the SF-36. The items with higher number of missing values (1%) were PF4 (“Climbing several flights of stairs” – physical fun ction in g dom ain ) an d RP3 (“Accom -plished less than would like” – role physical do-main). The mean of time spent to answer to SF-36 was 10 ± 5.2 minutes.
Descriptive statistics for the 8 domains of SF-36 are available in Table 2. As expected in data obtained from a general population sample, most of the respondents scored in the favorable health scores, a finding observed through the high me-dian seen in all domains, and the negative asym-metry, indicating the trend of scores to the upper range of the scale. This finding is also evidenced by the high percentage of ceiling effects, that is, respondents scoring at the highest score, espe-cially in the role physical and role emotional do-mains. A high index of ceiling effect was also seen in the social functioning domain. On the other hand, in a sample of the general population, the percentage of participants with scores at the low-er scale should be minimal, as seen in the present study. From the 8 domains, 1.5% or less of floor effect was observed in 6. There was exception in the role physical and role emotional domains, which had higher percentages of individuals with minimum scores, 11 and 16%, respectively.
Normative data for the 8 domains of SF-36 according to gender, age group, economic class, educational level and presence of disease are avail-Variables
Age (mean - SD) Gender
Male Female Race*
White Black Brown Others Religion*
Yes No Marital status
Married Single Widowed Divorced Years of study*
Up to 4 years of study 5 to 8 years
9 to 11 years 12 years or more Job status (%)
Em ployed Informal job Unem ployed Housewife Stu den t Retired Other
N (Total= 755)
41.3 (12.9) 290 465 607 74 54 19 404 349 447 195 25 88 46 168 259 278 381 62 50 117 41 69 35 Table 1. Socio-demographic characteristics of the study population.
%
38 62 81 10 7 2.5 53.5 46.2 59 26 3 12 6 22 34 37 50 8 7 16 5 9 5 * Total amount is not 755 due to missing values.
Mean SD Median Skewen ess Floor (%) Ceiling (%)
Table 2. Descriptive statistics for the eight domains of SF-36 for the total sample.
Physical Functioning
82.45 20.51 90 -1.57 0.3 24.8
Role Physical
74.73 35.33 100 -1.09 11.0 58
Bodily Pain
67.53 23.75 72 -0.50 1.5 17.7
General Health
71.10 19.52 72 -0.66 0.3 4.4
Vitality
66.85 20.39 70 -0.89 0.5 2.8
Social Functioning
78.30 23.88 87 -1.04 0.9 38.8
Role Emotional
70.02 38.12 100 -0.83 15.9 55.0
Mental Health
S
aú
d
e C
o
le
tiv
a, 1
8
(7
):1
9
1
1
-1
9
2
1
, 2
0
1
3
able in Table 3. Results are presented by mean and standard deviation of the scores.
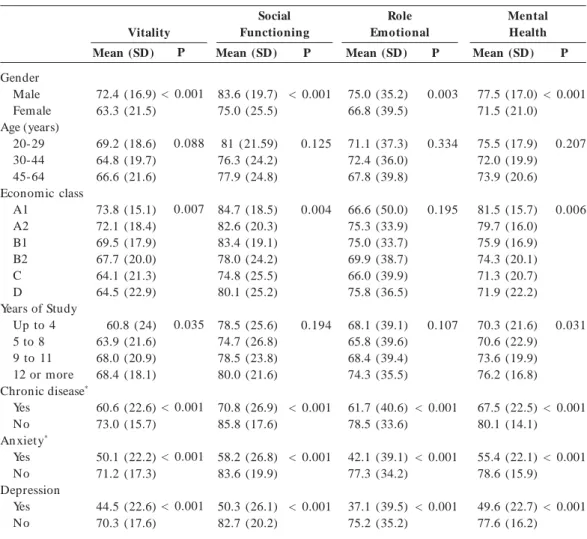
Women had the worst health status, with sta-tistically significant difference (p < 0.001 to 5 do-m ains) in all dodo-m ains. Major differences oc-curred in pain and vitality domains and the mi-nor ones in general health and mental health domains. In terms of age, statistically significant differences between the mean scores were found only in domains related to physical health (phys-ical functioning, pain, role phys(phys-ical and general health), with decreasing values as increasing age. The mean scores also varied according to eco-nomic class and educational level. Values decreased in a proportional manner to education, with sta-tistical significance in most of the areas, except for the pain, social functioning and role emotional domains. A worst health status was also seen in individuals of lower economic classes, with
statis-tically significant differences in scores in all do-mains, except pain and role emotional.
As a measure of health status, SF-36 was able to differentiate the group of individuals that re-ported having som e chronic health condition from the group that considered itself healthy, with worst health status for the first group. The dif-ferences in scores had statistical significance (p < 0.001) in all the 8 domains. The major discrep-ancies occurred between means of individuals who reported having depression and those who not reported, mainly in the role emotional and mental health, as expected.
Table 4 shows the scores in each area of the SF-36 in percentiles 5, 10, 25, 50, 75, 90, 95 for the total sample and for each subgroup according to gender and age group. The description in per-centiles is to make the use of scores here available more practical for future comparisons.
Table 3. Mean scores of SF-36 domains according to sociodemographic characteristics and presence of self-reported diseases.
Gender Male Female Age (years)
20-29 30-44 45-64 Economic class
A1 A2 B1 B2 C D
Years of Study Up to 4 5 to 8 9 to 11 12 or more Chronic disease*
Yes No An xiety*
Yes No Depression
Yes No
Mean (SD)
87.1 (17.2) 79.4 (21.8) 91.4 (11.8) 84.1 (19.2) 76.1 (23.0) 97.2 (4.41) 88.3 (14.3) 82.2 (20.4) 84.2 (18.7) 79.1 (22.8) 83.6 (18.5) 67.8 (27.6) 76.7 (23.7) 83.9 (19.3) 86.8 (15.9) 74.8 (23.3) 89.7 (13.9) 71.5 (24.9) 85.3 (18.1) 66.5 (26.4) 84.9 (18.1)
P
< 0.001
< 0.001
< 0.001
< 0.001
< 0.001
< 0.001
< 0.001
Mean (SD)
79.5 (31.4) 71.7 (37.3) 79.7 (30.5) 75.6 (34.8) 71.2 (37.8) 83.3 (27.9) 85.5 (28.0) 79.9 (32.6) 75.0 (35.9) 69.8 (36.6) 68.2 (25.3) 61.9 (42.4) 66.1 (38.4) 74.2 (34.7) 82.4 (30.4) 64.8 (39.6) 84.2 (27.5) 54.6 (40.5) 79.9 (31.8) 51.4 (41.2) 78.4 (32.8)
P
0.002
0.019
0.003
< 0.001
< 0.001
< 0.001
< 0.001
Mean (SD)
73.8 (21.6) 63.6 (24.2) 74.2 (20.9) 66.8 (24.0) 64.0 (24.3) 71.8 (22.3) 70.9 (19.2) 68.8 (21.8) 69.7 (24.0) 64.4 (24.8) 72.5 (37.8) 58.1 (29.0) 64.8 (25.8) 68.2 (24.0) 69.8 (20.6) 58.0 (24.1) 76.8 (19.3) 53.8 (24.5) 71.1 (22.1) 52.6 (27.0) 69.9 (22.3)
P
< 0.001
< 0.001
0.104
0.016
< 0.001
< 0.001
< 0.001
Mean (SD)
73.7 (18.4) 69.4 (20.0) 75.0 (17.4) 70.9 (19.8) 68.8 (20.2) 72.3 (18.1) 77.4 (16.0) 76.1 (16.2) 71.3 (18.6) 68.1(20.9) 66.9 (22.1) 62.6 (23.7) 64.1 (21.6) 72.2 (18.3) 75.7 (16.7 64.3 (20.4) 77.7 (16.2) 58.3 (21.6) 74.4 (17.4) 54.7 (22.5) 73.7 (17.6)
P
0.003
0.001
< 0.001
< 0.001
< 0.001
< 0.001
< 0.001 Physical
Functioning
Role Physical
General Health Bodily
Pain
C
ru
z
Graph 1 shows the mean scores for the 8 do-mains of SF-36 obtained in this research com-pared to the normative scores of other 4 coun-tries with different cultures. Brazil has lower scores than developed countries and Turkey in nearly all domains, except for vitality, where the score was higher in relation to all the other. Comparing to Croatia, a developing country, the studied Brazil-ian population presented higher mean scores.
Discussion
The results of our research provide regional nor-mative data for SF-36 to be used by researchers in comparisons of cohorts of individuals in dif-ferent clinical situations. In the absence of “gold standards” for health measures, normative scores can be very useful in interpreting scale scores for an individual respondent or the average score for
a group in comparison to the distribution scores for individuals from the general population4.
This study sought to meet the requirements recommended by the guidelines for standardiza-tion of scores of the SF-36. The number of par-ticipants was near to the 800 individuals as sug-gested by IQOLA and the study complied with other criteria such as response rate over two thirds, demographic information including age, sex, employment status, education, marital sta-tus and a checklist of self-reported chronic con-ditions4.
In spite of slightly smaller sample size, im-portant to detect differences in mean scores be-tween groups, the results of the present study regarding the ability to differentiate individuals according to demographic variables and pres-ence of disease were similar to those found in other countries which used a larger number of individuals in the sample5,6,12,13.
Table 3. continuation
Gender Male Female Age (years)
20-29 30-44 45-64 Economic class
A1 A2 B1 B2 C D
Years of Study Up to 4 5 to 8 9 to 11 12 or more Chronic disease*
Yes No An xiety*
Yes No Depression
Yes No
Mean (SD)
72.4 (16.9) 63.3 (21.5) 69.2 (18.6) 64.8 (19.7) 66.6 (21.6) 73.8 (15.1) 72.1 (18.4) 69.5 (17.9) 67.7 (20.0) 64.1 (21.3) 64.5 (22.9) 60.8 (24) 63.9 (21.6) 68.0 (20.9) 68.4 (18.1) 60.6 (22.6) 73.0 (15.7) 50.1 (22.2) 71.2 (17.3) 44.5 (22.6) 70.3 (17.6)
P
< 0.001
0.088
0.007
0.035
< 0.001
< 0.001
< 0.001
Mean (SD)
83.6 (19.7) 75.0 (25.5) 81 (21.59) 76.3 (24.2) 77.9 (24.8) 84.7 (18.5) 82.6 (20.3) 83.4 (19.1) 78.0 (24.2) 74.8 (25.5) 80.1 (25.2) 78.5 (25.6) 74.7 (26.8) 78.5 (23.8) 80.0 (21.6) 70.8 (26.9) 85.8 (17.6) 58.2 (26.8) 83.6 (19.9) 50.3 (26.1) 82.7 (20.2)
P
< 0.001
0.125
0.004
0.194
< 0.001
< 0.001
< 0.001
Mean (SD)
75.0 (35.2) 66.8 (39.5) 71.1 (37.3) 72.4 (36.0) 67.8 (39.8) 66.6 (50.0) 75.3 (33.9) 75.0 (33.7) 69.9 (38.7) 66.0 (39.9) 75.8 (36.5) 68.1 (39.1) 65.8 (39.6) 68.4 (39.4) 74.3 (35.5) 61.7 (40.6) 78.5 (33.6) 42.1 (39.1) 77.3 (34.2) 37.1 (39.5) 75.2 (35.2)
P
0.003
0.334
0.195
0.107
< 0.001
< 0.001
< 0.001
Mean (SD)
77.5 (17.0) 71.5 (21.0) 75.5 (17.9) 72.0 (19.9) 73.9 (20.6) 81.5 (15.7) 79.7 (16.0) 75.9 (16.9) 74.3 (20.1) 71.3 (20.7) 71.9 (22.2) 70.3 (21.6) 70.6 (22.9) 73.6 (19.9) 76.2 (16.8) 67.5 (22.5) 80.1 (14.1) 55.4 (22.1) 78.6 (15.9) 49.6 (22.7) 77.6 (16.2)
P
< 0.001
0.207
0.006
0.031
< 0.001
< 0.001
< 0.001 Vitality
Social Functioning
Mental Health Role
Emotional
S aú d e C o le tiv a, 1 8 (7 ):1 9 1 1 -1 9 2 1 , 2 0 1 3
The quality of data of the study was high, con-sidering as criterion the percentage of missing val-ues for items and domains of the SF-36, which
was below 2%14. This percentage was lower than
that found in Medical Outcomes Study (MOS), a study that used the original version of the SF-36,
All (n = 755) 5 10 25 50 75 90 95
Male (n = 290) 5 10 25 50 75 90 95
Female (n = 465) 5 10 25 50 75 90 95
Male Age 20 a 29 (n = 102) 5 10 25 50 75 90 95
Male Age 30 to 44 (n = 74) 5 10 25 50 75 90 95
C
ru
z
which ranged from 1.1 to 5.9%14. The authors of
SF-36 emphasize that the scores cannot be esti-mated with the same confidence level if there is a large number of missing data15. Additionally, the
non-response index also reflects the
understand-ing and acceptance of the questionnaire by the participants14. In this sample of the general
popu-lation of Porto Alegre, SF-36 seems to have been well accepted, and it was of quick application, with mean of completion time of 10 minutes. Female Age 20 to 29 (n = 98)
5 10 25 50 75 90 95
Female Age 30 to 44 (n = 138) 5
10 25 50 75 90 95
Female Age 45 to 64 (n = 229) 5
10 25 50 75 90 95
Physical Functioning
0 22.50 50 100 100 100 100 0 0 50 100 100 100 100 0 0 25 100 100 100 100
Bodily Pain
65 70 80 95 100 100 100 30 54.50 75 90 95 100 100 25 35 60 80 90 100 100
Role Physical
22 41 51 72 84 100 100 22 31 51 62 84 100 100 22 22 41 62 84 100 100
General Health
0 22.50 50 100 100 100 100 0 0 50 100 100 100 100 0 0 25 100 100 100 100
Vitality
37 47 62 77 87 95 97 36.90 42 54 68.50 82 92 97 28.15 42 53 72 87 95 97
Social Functioning
25 35 50 70 80 85 90 20 30 50 65 80 85 90 15 30 50 70 80 85 90
Role Emotional
25 49 62.50 75 100 100 100 25 37.50 50 75 100 100 100 25 37.50 62.50 75 100 100 100
Mental Health
0 0 33 83 100 100 100 0 0 33 100 100 100 100 0 0 33 100 100 100 100 Table 4. continuation
Graph 1. Means scores of SF-36 domains in the general population of Brazil and other countries. 100
80 60 40 20 0
Brazil Turkish United Kingdom Croatia USA
S
aú
d
e C
o
le
tiv
a, 1
8
(7
):1
9
1
1
-1
9
2
1
, 2
0
1
3
The low number of missing values in this re-search might have been secondary to the admin-istration mode of SF-36, which was self-applica-ble, but performed in the presence of the inter-viewer, who checked if all questions were respond-ed. The few missing items that occurred were probably due to a refusal of the respondent to complete that item.
The distribution of SF-36 scores in the total of sample is comparable to that found in the appli-cation of the original instrument in the general population of the United States3, with most
re-spondents having higher scores. The areas with highest percentages of floor and ceiling effects were the same, role physical and role emotional. These two domains are considered the “coarsest” of the eight scales, enumerating only five or four levels of health each. One of the ways to improve this limitation of these areas would be to replace di-chotomous responses by responses with more categories that measure finer gradations in role disability aside from the mere presence or absence of limitation14. The fact that the highest level of
functioning is merely defined by the absence of physical or emotional limitations causes the ceil-ing effect in the above areas to always be a limita-tion in the SF-36 applicalimita-tion in samples of non-diseased individuals. Younger individuals also had more domains with the highest score in relation to older individuals, confirming a possible reduc-tion in sensitivity at the upper limits of the scale in people with less functional limitations. Data for the SF-36 in populations of patients with chronic diseases had lower prevalence of ceiling effect16.
The observed differences in mean scores of the SF-36 am on g differen t population strata em phasize the need to use the standards de-scribed for each subgroup for comparison. The main discrepancies were related to gender, wom-en preswom-enting a worse health status in all domains of the SF-36. This finding seems to be indepen-dent from culture and socioeconomic status, since it was unanimous in normalization studies con-ducted in different countries of Western Europe 13-17, Canada12, New Zealand18 and Mexico19. For
the other socio-demographic variables, older in-dividuals reported a worse health status only in domains related to physical health, while respon-dents with less education and lower socioeco-nomic class had the lowest scores in almost all areas. These findings were also seen in other stud-ies performed on developed countrstud-ies20, and
de-veloping ones5,21, demonstrating the advantage
of using the SF-36 in populational studies to iden-tify groups of vulnerable individuals. The
descrip-tion of health-related quality of life in different areas also allows identifying which aspects of the life of the individual might be more affected. The graphic showing the curves of scores in different countries showed that the population of some countries reported better health in the physical areas, but worse in areas such as vitality, for ex-ample. Additionally, since this is a generic instru-ment, it enables cross-cultural comparisons.
SF-36 was able to clearly differentiate between the subjects with self-reported diseases and the group declared healthy, suggesting good con-struct validity of this instrument developed to measure health status. The group that reported to have some chronic condition had worst health status in all areas. Individuals who identified themselves with depression and anxiety, the only two psychiatric conditions included in the proto-col, had mean scores significantly lower in the 8 domains, with major differences in role emotional and mental health.
One important aspect to be highlighted is that the sample used is not representative of all re-gions of Brazil. Due to the great cultural diversi-ty, this research should be replicated in the other regions so that the national normative tables be-come available.
Another caveat of this study is the fact that the sample presented a subrepresentativity of the general population in relation to the lower socio-economic classes. Some criteria followed by the protocol such as to exclude illiterate and preserve the team to work on areas of greatest risk for urban violence may have led to a smaller repre-sentation of D and E classes. Since the quality of life scores decreased progressively in lower so-cioeconomic classes, one can infer that the class-es D and E would score even lower. Then, using the results presented in this paper to compare quality of life between groups, researchers should be aware that for individuals pertaining to class-es D and E, valuclass-es are probably overclass-estimated.
C
ru
z
Collaborations
LN Cruz, MPA Fleck, MR Oliveira, SA Camey, LF Hoffmann, AM Bagattini and CA Polanczyk have made substantive contributions to conception and design, acquisition of data, analysis and in-terpretation of data. LN Cruz drafted the article and MPA Fleck, SA Camey and CA Polanczyk revised the final version. All the authors endorse the data and conclusions.
S
aú
d
e C
o
le
tiv
a, 1
8
(7
):1
9
1
1
-1
9
2
1
, 2
0
1
3
Pappa E, Kontodimopoulos N, Niakas D. Validating an d n or m in g of th e Greek SF- 36 Health Su r vey.
Qual Life Res 2005; 14(5):1433-1438.
McHorney CA, Ware JE, Jr., Lu JF, Sherbourne CD. The MOS 36-item Short-Form H ealth Survey SF-36: III. Tests of data quality, scalin g assum p tion s, an d reliability across diverse patien t groups. M ed
Care 1994; 32(1):40-66.
Gan d ek B, War e JE, Jr., Aaron so n NK, Alo n so J, Apolone G, Bjorner J, Brazier J, Bullinger M, Fuku-hara S, Kaasa S, Leplège A, Sullivan M. Tests of data quality, scalin g assum ption s, an d reliability of the SF-36 in eleven countries: results from the IQOLA Project. International Quality of Life Assessment. J
Clin Epidem iol 1998; 51(11):1149-1158.
Cruz LN, Camey SA, Fleck MP, Polanczyk CA. World Health Organization quality of life instrument-brief and Short Form-36 in patients with coronary artery disease: do they measure similar quality of life con-cepts? Psychol Health Med 2009; 14(5):619-628. Aaron son NK, Mu ller M, Coh en PD, Essin k- Bot ML, Fekkes M, San d er m an R, Sp r an ger s MA, te Veld e A, Ver r ip s E. Tr an slatio n , valid atio n , an d norming of the Dutch language version of the SF-36 H ealth Survey in com m un ity an d chron ic disease populations. J Clin Epidemiol 1998; 51(11):1055-1068. Scott KM, Tobias MI, Sarfati D, Haslett SJ. SF-36 health survey reliability, validity and norms for New Zealand. Aust N Z J Public Health 1999; 23(4):401-406.
Du ran -Aren as L, Gallegos-Carrillo K, Salin as-Es-cu d ero G, Mar tín ez-Salgado H . Towar ds a Mexi-can n or m ative stan d ar d for m easu r em en t of th e short format 36 health-related quality of life instru-ment. Salud Publica Mex 2004; 46(4):306-315. Sullivan M, Karlsson J. The Swedish SF-36 H ealth Su rvey III. Evalu ation of criterion -based validity: results from normative population. J Clin Epidem
i-ol 1998; 51(11):1105-1113.
Wang R, Wu C, Zhao Y, Yan X, Ma X, Wu M, Liu W, Gu Z, Zhao J, H e J. H ealth related quality of life m easu red by SF-36: a popu lation -based stu dy in Shanghai, China. BMC Public Health 2008; 8:292.
Artigo apresentado em 09/08/2012 Aprovado em 17/10/2012
Versão final apresentada em 08/11/2012 13.
14.
15.
16.
17.
18.
19.
20.
21.
References
Wilson IB, Clear y PD. Linking clinical variables with health-related quality of life. A con ceptual m odel of patient outcomes. JAMA 1995; 273(1):59-65. Ware JE Jr, Sherbourne CD. The MOS 36-item short-form health survey SF-36. I. Conceptual framework and item selection. Med Care 1992; 30(6):473-483. Ware JE Jr. SF-36 health survey update. Spine (Phila
Pa 1976) 2000; 25(24):3130-3139.
Gandek B, Ware Jr JE. Methods for validating and norming translations of health status questionnaires: the IQOLA Project approach. International Quality of Life Assessment. J Clin Epidemiol 1998; 51(11):953-959.
Dem iral Y, Ergor G, Un al B, Sem in S, Akvardar Y, Kivircik B, Alptekin K. Norm ative data an d dis-crim in ative properties of short form 36 SF-36 in Turkish urban population. BMC Public Health 2006; 6:247.
Maslic SD, Vuletic G. Psychometric evaluation and establishin g n orm s of Croatian SF-36 health su r-vey: framework for subjective health research. Croat
Med J 2006; 47(1):95-102.
Cicon elli RM , Fer r az M B, San to s W, Mein ão I, Quaresma MR. Brazilian-Portuguese version of the SF-36. A reliable and valid quality of life outcom e m easure. Revista Brasileira de Reum atologia 1999; 39(3):143-150.
Augustovski FA, Lewin G, Elor rio EG, Rubin stein A. The Argentine-Spanish SF-36 Health Survey was successfully validated for local outcom e research. J
Clin Epidem iol 2008; 61(12):1279-1284.
Instituto Brasileiro de Geografia e Estatística (IBGE).
IBGE Cidades. [cited 2010 Feb 12]. Available from : www.ibge.gov.br
Bullinger M, Alonso J, Apolone G, Leplège A, Sul-livan M, Wood-Dauphinee S, Gandek B, Wagner A, Aaronson N, Bech P, Fukuhara S, Kaasa S, Ware JE Jr. Translating health status questionnaires and eval-uating their quality: the IQOLA Project approach. In t er n at ion al Q u alit y of Life Assessm en t . J Clin
Epidemiol 1998; 51(11):913-923.
Asso ciação Br asileir a d e Em p r esas d e Pesqu isa (ABEP). Critério Econôm ico Brasil 2003. [cited 2010 Feb 12]. Available from: www.abep.org/novo/default. aspx
Hopm an WM, Towheed T, Anastassiades T, Tenen-house A, Poliquin S, Berger C, Joseph L, Brown JP, Murray TM, Adachi JD, Hanley DA, Papadimitropou-los E. Canadian normative data for the SF-36 health sur vey. Can adian Mu lticen tre Osteoporosis Study Research Group. CMAJ 2000; 163(3):265-271. 1.
2.
3.
4.
5.
6.
7.
8.
9.
10.
11.