Artigo Original
Taise Argolo Sena1 Natália Ramos1 Gabriela Ribeiro Ivo Rodrigues2 Doris Ruthi Lewis3
Descritores
Potenciais evocados auditivos Triagem neonatal Recém-nascido Audição Testes auditivos
Keywords
Evoked potentials, auditory Neonatal screening Infant, newborn Hearing Hearing tests
Correspondence address:
Taise Argolo Sena
R. Estado de Israel, 860, Vl. Mariana, São Paulo (SP), Brasil, CEP: 04022-002. E-mail: [email protected]
Received: 9/23/2011
Accepted: 10/15/2012
Study conducted at the Centro Audição na Criança, Divisão de Educação e Reabilitação dos Distúrbios da Co-municação, Pontifícia Universidade Católica de São Paulo – CeAC/DERDIC/PUC-SP – São Paulo (SP), Brazil. (1) Graduate Program (Master’s degree) in Speech-Language Pathology and Audiology, Pontifícia Universidade Católica de São Paulo – PUC-SP – São Paulo (SP), Brazil; Centro Audição na Criança, Divisão de Educação e Reabilitação dos Distúrbios da Comunicação, Pontifícia Universidade Católica de São Paulo – PUC-SP – São Paulo (SP), Brazil.
(2) Centro Audição na Criança, Divisão de Educação e Reabilitação dos Distúrbios da Comunicação, Pontifícia Universidade Católica de São Paulo – PUC-SP – São Paulo (SP), Brazil.
(3) School of Speech-Language Pathology and Audiology, Pontifícia Universidade Católica de São Paulo – PUC-SP – São Paulo (SP), Brazil.
Conflict of interests: None
new technologies of Automated Auditory Brainstem
Response (AABR)
Comparação do tempo de dois procedimentos com novas
tecnologias de Potencial Evocado Auditivo de Tronco
Encefálico Automático (PEATE-A)
ABSTRACT
Purpose: To compare the testing time of two Automated Auditory Brainstem Response (AABR) procedures using different repetition rates and detection modes. Methods: A hearing screening using AABR was per-formed in 30 newborns with mean age of 21 days. Each newborn was submitted to two hearing screening procedures using different AABR equipments (Procedure 1 and Procedure 2). Procedure 1 used a repetition rate of 53 Hz and the one-sample test for response detection; Procedure 2 used a repetition rate of 90 Hz, and the q-sample test for response detection. The ABR with click stimulus was then registered as gold standard test, and the responses were analyzed by a trained audiologist. Results: The mean time observed for Procedure 1 considering both ears was 84.8 (±53.5) seconds; for Procedure 2 the mean time was 27.9 (±20.0) seconds. The testing time of the first procedure was three times longer than the second one. Statistical analysis showed significant difference between the testing times of the procedures. Conclusion: The q-sampletestand the repetition rate of 90 Hz used in the AABR equipment showed earlier response detection.
RESUMO
INTRODUCTION
The identification of hearing loss through the Neonatal Hearing Screening (NHS) is essential for early intervention, since the diagnosis, when concluded before three months of age and followed by intervention before six months of age, pro-vides significant changes in cognitive and linguistic quotients of deaf individuals(1-5). Currently, two physiological
procedu-res are recommended as NHS for early detection of hearing loss: Evoked Otoacoustic Emissions (EOAE) and Auditory Brainstem Response (ABR)(3,6-8).
According to the recommendations of the Joint Committee on Infant Hearing(7), the performance of NHS equipment
proce-dures must be based in evidence such as: sensitivity, specificity, and testing time in the presence or absence of response. The ABR is more sensitive when compared to the EOAE because it reflects the activity of the auditory nerve and the brainstem. In addition, the ABR is less affected by middle ear fluids, considerably decreasing the number of false-positive results. However, this test is considered less viable, because its testing time is superior to that of the EOAE(9-14). Currently, the ABR
is recommended in two different situations: for newborns with risk indicators for hearing loss, and for those who do not pass the EOAE test. Hence, the faster and the more effective the ABR test, the better for all situations(3,8).
With the improvement of technology, automated ABR (AABR) equipments were introduced in clinical routine. In the-se equipments, the prethe-sence or abthe-sence of responthe-ses is analyzed automatically, exempting the participation of the audiologist in data interpretation. The automated detection of ABR contributes to the decrease of errors due to wrong interpretation of results, and also of the testing time, reinforcing its use in NHS(11,15,16).
Recent studies in the issue of NHS have the aim to impro-ve the testing time conditions in the registration of AABR. Great part of these studies focuses the automated detection of responses(9,11,15,16). Thus, the repetition/stimulus presentation
rate and the statistical method used to analyze the responses are important aspects to be considered in improving the elec-trophysiological response in the AABR test and decreasing its testing time.
A research has shown that the stimulus repetition rate close to 90 clicks per second is the best to be used in NHS. By using a fast and continuous stimulation at a repetition rate close to 90 Hz, it is possible to obtain a periodic response, such as those of stable state, which, due to its continuous nature, can easily be transformed for the frequency domain and analyzed by statistical methods(11).
The other important aspect to be considered in AABR is the statistical method chosen for the automated analysis of responses. Most AABR equipments use response detection methods analyzed in the frequency domain, and mostly use statistical tests called one-sample test(17-19). These are
statis-tical tests that consider only the spectral component of the modulation frequency, that is, the first harmonic(15). Recently,
the use of statistical tests that include more harmonics in the detection of responses, such as the q-sample test, has shown better performance regarding time(15,16,20).
Considering the national and international recommenda-tions of using the AABR test in the NHS, in addition to the importance of studying the performance of hearing screening equipments with new technologies, the present study has the aim to compare two AABR procedures using different repetition rates and detection modes.
METHODS
This is a cross-sectional descriptive study that analyzed the testing time of two different AABR equipments. The study was approved by the Research Ethics Committee of the Pontifícia Universidade Católica de São Paulo (PUC-SP) under protocol number 188/2010.
Participants were 30 newborns with ages between 15 and 28 days, mean age of 21 years, referred by the Hospital Estadual Mandaqui, in the city of São Paulo, to the Centro Audição na Criança (Child Hearing Center), a high complexity institution in hearing health, for selective hearing screening. Selective he-aring screening is the screening performed only in infants with risk indicators for hearing loss. Thus, all infants included in the study had at least one risk indicator for hearing loss. Parents and/or caregivers of all subjects signed the Free and Informed Consent, agreeing with their participation in the research.
Each newborn was submitted to two hearing screening procedures using different AABR equipments (Procedure 1 and Procedure 2). After that, in order to validate the results found in the automated hearing screening, an ABR test with click stimulus verified the minimum level of auditory response until 20 dBnHL. Differently from the two AABR procedures, the interpretation of the results of the ABR was the visual analysis of the waves by an experienced examiner. For this reason, this test was considered the gold standard, that is, it was indicative of hearing normality. All tests were conducted with the infants in natural sleep, comfortably resting in their mothers’ laps or in a litter. The three procedures were carried out in the same session, in a silent environment, seeking to keep the same conditions.
Both hearing screening procedures included the place-ment of surface electrodes in different positions, according to the technical specifications of each AABR equipment. For Procedure 1, the equipment was the Accuscreen model from GNOtometrics®. The AABR was recorded at the intensity of 35 dBnHL and repetition rate of 55 clicks/second. The detec-tion mode in the frequency domain used statistical tests called one-sample test. The electrodes were placed at the vertex (ac-tive), the zygomatic (ground), and at the C7 vertebra position (reference). The testing time for each ear was recorded using the Cassio® 225L stopwatch.
For Procedure 2, the equipment used was the Eclipse Black Box – software ABRIS model from Interacoustics®. The AABR was recorded at the intensity of 35 dBnHL and repetition rate of 93 clicks/second. The detection mode in the frequency domain used q-sample tests. The electrodes were placed at the vertex (active and ground) and the left and right mastoids (M1 and M2). The testing time for each ear was automatically calculated by the equipment.
placement for the procedures was due to the technical specifica-tions for each equipment, which suggest different posispecifica-tions. The equipment used in Procedure 1 is a portable NHS equipment, while the one used in Procedure 2 is a two-channel diagnosis equipment, as shown in Chart 1.
Both hearing screening equipments performed the auto-mated analysis of responses, indicating, at the end of the test, the sign “pass” when response was detected, and “refer” when there was absence of response.
To ensure reliability of the results, after the hearing screening procedures, all infants were submitted to the ABR test (gold standard) to obtain the minimum level of auditory response up to 20 dBnHL. The equipment used for this recording was the Eclipse EP25 ABR system model,from Interacoustics®. The recording was conducted and interpreted by an audiologist with experience in auditory electrophysio-logy. The recording parameters were: click stimulus, alternate polarity presented at repetition rate of 21.1 Hz. The reference electrodes were placed at the left (A1) and right (A2) mas-toids, and the active (Fz) and ground (Fpz) electrodes were placed at the front. The recording was conducted only with the electrodes lower than 3 kΩ. Filters from 100 Hz to 3 kHz were used during the test.
Data analysis compared the testing times for each test, having the ear (left x right) as independent variable in each procedure and in both ears comparing both procedures. For this purpose, the Wilcoxon test was used, since the data are paired, that is when the same individual is study and control for himself. A descriptive analysis regarding the presence or absence of AABR responses was also performed.
RESULTS
All of the 30 evaluated infants (60 ears) obtained satisfac-tory results in both hearing screening procedures. Thus, the final results of procedures 1 and 2 were similar, with 100% “pass” results. For security and reliability of both, all newborns presented the minimum level of response on the air-conduction ABR with click stimulus at 20 dBnHL (gold standard).
In order to compare the testing time of the screening proce-dures, the responses were compared by ear and in both ears in each procedure by means of the Wilcoxon test. Table 1 presents the comparison values between Procedure 1 and Procedure 2 for right, left and both ears.
In the three situations, the differences found between the procedures were significant (p<0.001). It is noted that, in all situations (right, left, and both ears), Procedure 1 had a higher mean testing time (in seconds) than the mean of Procedure 2.
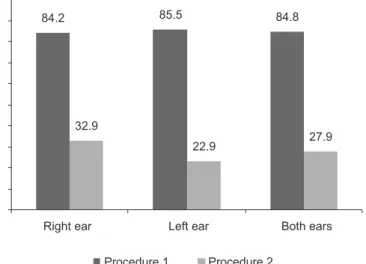
Figure 1 presents the distribution of testing times observed in both procedures, according to the variable ear. It is noted that the testing time of Procedure 1 was three times higher than that of Procedure 2.
DISCUSSION
The present study showed that Procedure 2, which uses
Chart 1. Description of the characteristics of each procedure used
Characteristics Procedure 1 Procedure 2
Intensity 35 dBnHL 35 dBnHL
Stimulus Click Click
Statistical test One-sample test q-sample test
Repetition rate 55 clicks/second 93 clicks/second
Time registration Cassio® 225L stopwatch Automated
Table 1. Testing time comparison between the procedures (in seconds)
Test Right ear Left ear Both
Procedure 1 Procedure 2 Procedure 1 Procedure 2 Procedure 1 Procedure 2
Mean 84.2 32.9 85.5 22.9 84.8 27.9
Median 63 21 90 20 76.5 20.5
SD 59.1 25.4 48.5 10.9 53.5 20.0
Q1 47 14 45 14 45 14
Q3 107 39 119 27 109 36
n 25 25 25 25 50 50
CI 23.2 10.0 19.0 4.3 14.8 5.5
p-value <0.001* <0.001* <0.001*
Note: SD = standard deviation; Q1 = quartile 1; Q3 = quartile 3; CI = confidence interval
a repetition rate of 93 clicks/second and the q-sample test as statistical test for automated detection of responses, is three times faster than Procedure 1, which uses a lower repetition rate and the one-sample test for response detection. This finding corroborates a study that showed that q-sample tests are better than one-sample tests when the testing time is considered(15).
As one-sample tests analyze only the first harmonic to perform the automated analysis of responses, different tests are applied separately for the different frequency components to be evaluated. Hence, to determine whether a response is present or absent, the results found must be combined in a safe and adequate manner, which takes some time(17).
Considering that the amplitude of the electrophysiological response is lower close to the hearing threshold and, con-sequently, more difficult to be detected, a higher number of promediation is necessary when one-sample tests are used, which takes a longer time(19,20). In q-sample tests, on the other
hand, as more than one harmonic is analyzed, the response is more easily detected. Thus, a higher number of scans, as well as the use of a combination of rules to determine the final outcome, is unnecessary(15). All these factors influence for a
shorter testing time.
The mean testing time found for Procedure 1 (using the one-sample test) was 84.8 seconds, and for Procedure 2 (using the q-sample test), 27.9 seconds (Table 1). These results show that q-sample tests are faster to analyze the presence or absence of response.
The mean testing times of AABR show in literature are high when compared to those found in the present study. A research that used the vector algorithm for the automated detection of AABR responses with repetition rate of 33 Hz found a mean time for presence of response at 1.5 minutes (90 seconds), and for absence of response at 4.5 minutes (270 seconds)(9).
Other studies(10,13) have indicated that the mean testing times
of AABR equipments used in the clinical practice vary from 4 yo 15 minutes.
A study that used repetition rate around 90 Hz and the q-sample test as statistical test presented minimum response time of 10 seconds, and maximum of 65 seconds (mean of 24.6 seconds). These results corroborate the findings of the present study(16).
According to the recommendation of a few committees, the ABR should be carried out with all newborns with at least one risk indicator for hearing loss, or as an immediate second step after an unsatisfactory result (“refer”) on the EOAE(7,8).
Considering the importance of the ABR on the NHS, studies with new technologies that have the potential to diminish the difficulties in its application, such as the visual identification of the response and the increased testing time, allow that it is used with a greater number of newborns.
The main purpose of NHS programs is to identify all new-borns with hearing disability in a fast and reliable manner(4,13).
The AABR recorded with repetition rate close to 90 Hz and automatically detected by the q-sample test presented testing time around 30 seconds, suggesting that this is an important tool for the early identification of hearing loss in newborns.
Although these are promising results, further studies that
analyze the sensitivity (the test’s ability to correctly identify the cases of hearing loss in the tested population) and the specificity (the test’s accuracy in correctly identifying normal hearing newborns) are still necessary to ensure the use of AABR in clinical practice.
CONCLUSION
The q-sample test and the repetition rate around 90 Hz used in AABR equipments showed earlier response detection.
* TAS, NR and GRIR were responsible for data collection and tabulation, literature review, elaboration and final revision of the Portuguese and English versions of the manuscript. DRL supervised the research and reviewed the final version of the manuscript.
REFERENCES
1. Yoshinaga-Itano C, Sedey AL, Coutler DK, Mehl A. Language of early and later identified children with hearing loss. Pediatrics. 1988 Nov;102(5):1161-71.
2. Marion Downs National Hearing Center, 2011. Available from: http:// www.mariondowns.com/
3. Joint Committee on Infant Hearing. Year 2000 position statement: principles and guidelines for early hearing detection and intervention programs. Am J Audiol 2000 Jun;9:9-29.
4. Hernández-Herrera RJ, Hernández-Aguirre LM, Castillo-Martínez NE, de la Rosa-Mireles N, Martínez-Elizondo J, Alcalá-Galván LG, et al. Hearing screening and diagnosis of hearing loss: high risk versus low risk neonates. Rev Med Inst Mex Seguro Soc. 2007 Sep;45(5):421-6. 5. Jakubíková J, Kabátová Z, Pavlovcinová G, Profant M. Newborn hearing
screening and strategy for early detection of hearing loss in infants. Int J Pediatr Otorhinolaryngol. 2009 Apr;73(4):607-12. Epub 2009 Jan 31. 6. Early Identification of Hearing Impairment in Infants and Young
Children. NIH Consens State Sci Statements. 1993 Mar;1-3;11(1):1-24. 7. Joint Committee on Infant Hearing. Year 2007 position statement:
principles and guidelines for early hearing detection and intervention programs. Pediatrics. 2007 Oct;120(4):898–921.
8. Comitê Multiprofissional em Saúde Auditiva – COMUSA. Saúde auditiva neonatal. Academia Brasileira de Audiologia, 2009. [ Acesso em: 2009 Nov 03] Disponível em: http://www.audiologiabrasil.org.br/ pdf/COMUSA_final_17_maio2009.pdf
9. Keohane BM, Mason SM, Baguley DM. Clinical evaluation of the vector algorithm for neonatal hearing screening using automated auditory brainstem response. J Laryngol Otol. 2004 Feb;118(2):112-6.
10. Van Straaten HL Automated auditory brainstem response in neonatal hearing screening. Acta Paediatr Suppl. 1999 Dec;88(432):76-9. 11. Stürzebecher E, Cebulla M, Neumann K. Click-evoked ABR at high
stimulus repetition rates for newborn hearing screening. Int J Audiol 2003 Mar;42:59-70.
12. Pedersen L, Møller TR, Wetke R, Ovesen T. Neonatal hearing screening. A comparison of automatic auditory brainstem audiometry and otoacoustic emissions. Ugeskr Laeger. 2008 Feb 18;170(8):642-6. 13. Freitas VS, Alvarenga KF, Bevilacqua MC, Martinez MAN, Costa OA.
Análise crítica de três protocolos de triagem auditiva neonatal. Pro Fono. 2009 Jul-Set;21(3):201-6.
14. Guastini L, Mora R, Dellepiane M, Santomauro V, Mora M, Rocca A, Salami A. Evaluation of an automated auditory brainstem response in a multi-stage infant hearing screening. Eur Arch Otorhinolaryngol. 2010 Aug;267(8):1199-205.
16. Cebulla M, Stürzebecher E, Elberling C, Müller J. New clicklike stimuli for hearing testing. J Am Acad Audiol. 2007 Oct;18(9):725-38. 17. Dolbie RA, Wilson MJ. Objetive response detection in the frequency
domain. Eletroencephalogr Clin Neurophysiol. 1993 Nov-Dec;88(6):516-24.
18. Cebulla M, Stürzebercker E, Wernecke KD. Objetive detection of auditory evoked potentials. Comparison of several statistical tests in the frequency domain by means of Monte Carlo simulations. Scand Audiol. 1996;25(3):201-6.
19. Stürzebercker E, Cebulla M. Objetive detection of auditory evoked potentials – Comparison of several statistical tests in the frequency domain on the basis of near-threshold ABR data. Scand Audiol. 1997;26(1):7-14.