www.biogeosciences.net/5/969/2008/
© Author(s) 2008. This work is distributed under the Creative Commons Attribution 3.0 License.
Biogeosciences
Modeling carbon dynamics in two adjacent spruce forests with
different soil conditions in Russia
J. Kurbatova1, C. Li2, A. Varlagin1, X. Xiao2, and N. Vygodskaya1
1A.N. Severtsov Institute of Ecology and Evolution, Russian Academy of Sciences, Moscow, Russia
2Institute for the Study of Earth, Oceans, and Space, University of New Hampshire, Durham, NH 03824, USA
Received: 5 December 2007 – Published in Biogeosciences Discuss.: 24 January 2008 Revised: 14 May 2008 – Accepted: 4 June 2008 – Published: 1 July 2008
Abstract.Net ecosystem carbon exchange (NEE) was
mea-sured with eddy covariance method for two adjacent forests located at the southern boundary of European taiga in Russia in 1999–2004. The two spruce forests shared similar vege-tation composition but differed in soil conditions. The wet spruce forest (WSF) possessed a thick peat layer (60 cm) with a high water table seasonally close to or above the soil surface. The dry spruce forest (DSF) had a relatively thin organic layer (5 cm) with a deep water table (>60 cm). The measured multi-year average NEE fluxes (2000 and – 1440 kg C ha−1yr−1 for WSF and DSF, respectively)
indi-cated that WSF was a source while DSF a sink of atmo-spheric carbon dioxide (CO2)during the experimental years.
A process-based model, Forest-DNDC, was employed in the study to interpret the observations. The modeled multi-year average NEE fluxes were 1800 and –2200 kg C ha−1yr−1for
WSF and DSF, respectively, which were comparable with observations. The modeled data also showed high soil het-erotrophic respiration rates at WSF that suggested that the water table fluctuation at WSF could have played a key role in determining the negative carbon balance in the wetland ecosystem. A sensitivity test was conducted by running Forest-DNDC with varied water table scenarios for WSF. The results indicated that the NEE fluxes from WSF were highly sensitive to the water table depth. When the water table was high, the WSF ecosystem maintained as a sink of atmospheric CO2; while along with the drop of the water
table the length of the flooded period reduced and more or-ganic matter in the soil profile suffered from rapid decompo-sition that gradually converted the ecosystem into a source of atmospheric CO2. The general effect of water table
vari-ation on wetland carbon balance observed from this
model-Correspondence to:C. Li
ing study could be applicable for a wide range of wetland ecosystems that have accumulated soil organic carbon while face hydrological changes under certain climatic or land-use change scenarios.
1 Introduction
Boreal forests contain about 50% of the total carbon stored in vegetation and soils in the world (Dixon et al., 1994). The majority of boreal forests are distributed in Russia (600 million ha), Europe (300 million ha) and North America (500 million ha) (Schulze et al., 1999). Boreal forests play an important role in the global cycles of carbon (C), water and nutrients as well as the climate system. A number of global C balance studies have suggested that there is very likely a large C sink in the northern Hemisphere, but its spatial pat-terns and temporal dynamics remain uncertain (Schimel et al., 2001; Fan et al., 1998; Myneni et al., 2001). Multiple bi-ological and abiotic factors, including climate variation, land use change, and frequent natural disturbance (e.g., fire, in-sect outbreak), could significantly affect the carbon dioxide (CO2)fluxes and C storage in the boreal forest regions
(Shv-idenko and Nilsson, 2002; Jarvis and Linder, 2000; Kobak et al., 1996). The existing estimates of net primary production for boreal forests vary widely (Melillo et al., 1993; Schulze et al., 1999; Jarvis et al., 2001; Jarvis and Linder, 2000).
To better quantify the role of boreal forests in the global carbon cycle, the international research communities re-cently made great efforts establishing a net work of CO2
R u s s i a
Fig. 1. Location of the studied wetland spruce forest (WSF) and upland spruce forest (DSF) in the Central Forest Biosphere Reserve at Fyodorovskoe in Tver, Russia.
will continuously produce rich data sets of net ecosystem ex-change of CO2(NEE) between forests and the atmosphere
at the tower sites. NEE is defined as the difference between gross primary production (GPP) and ecosystem respiration (Re)consisting of the plant autotrophic respiration and the
soil microbial heterotrophic respiration. The analyses with the observed NEE flux data have been conducted and demon-strated interesting but complex patterns on the seasonal dy-namics and inter-annual variations of the NEE fluxes (Falge et al., 2002).
Carbon dynamics represented by the observed NEE fluxes for the forest ecosystems is regulated by a series of pri-mary drivers including climate, soil, hydrology, vegetation, and management practices. Any single change in the pri-mary drivers could simultaneously alter several of the for-est environmental factors such as radiation, temperature, soil moisture, soil redox potential, and nutrient substrates dynam-ics; and the altered environmental factors could collectively and simultaneously affect the plant photosynthesis and/or the ecosystem respiration (Li, 2007). Sometimes, the interac-tions between the changes in primary drivers and the forest responses are so complex that it is hard to reveal the mecha-nisms that controlling the forest C dynamics solely relying on the observed NEE fluxes. Process-based models have been developed to meet the gap. During the past decade a number of models were developed by integrating the funda-mental processes that govern the forest growth, litter incor-poration, and soil organic matter (SOM) turnover. Driven by climate, forest type, soil properties, management practices and other relevant input parameters, the models can simulate forest production as well as C and N cycles in the ecosys-tems. Among the modeling efforts, the Forest-DNDC model developed by Li and his colleagues (Li et al., 2000) has been widely tested for greenhouse gas studies (Butterbach-Bahl et
al., 2004; Kiese et al., 2004; Cui et al., 2005; Kesik et al., 2005; Miehle et al., 2006). In this study, we applied Forest-DNDC for understanding the NEE fluxes observed at two adjacent forest ecosystems located at the southern boundary of European taiga in Russia. The two forests shared similar composition though differing in soil and hydrological con-ditions. The multi-year observation data indicated that one of the forests was continuously a sink of atmospheric CO2
while the other a source. By tracking the various C fluxes in the two forest stands with the modeling tool, we tried ex-plaining why the two forests functioned differently regarding their contributions to atmospheric C.
2 Description of study sites
Net ecosystem exchange of carbon (NEE) was measured with eddy covariance technique at two adjacent forested sites in the Central Forest Biosphere Reserve (56◦27′N, 32◦55′E) at Fyodorovskoe in Tver, Russia from 1999-2004 (Fig. 1). The reserve was established in 1931 possessing an area of 24 447 ha with an elevation of 230–270 m. The forests have been being reserved without any commercial disturbance since the 1960s. The territory of the reserve is far from any industrial or residential areas with little air pollution affect-ing the forest growth. The two measured sites, the wet and dry spruce forests, are located about 2 km apart from each other. The sites have similar climatic conditions with aver-age annual temperature 3.9◦C and precipitation 711 mm for the 1990s (Milyukova et al., 2002).
The wet spruce forest (WSF) site is an old (150 years) spruce forest with spruce (Picea abies, 86%) and birch
(Betula pubescens, 14%). The undergrowth is dominated
by Vaccinium spp. and Sphaghum spp. Above-ground
woody biomass is approximately 53 tC ha−1(Milyukova et
al., 2002). The measurement tower is located on a flat sur-face with homogenous vegetation cover. The stand has a 60 cm Sphagnum peat layer with the tree roots throughout the whole profile. The soil C content in the peat layer is about 197 ton C ha−1(Vygodskaya et al., 2002). The forest is
char-acterized by poor soil aeration, low pH (3.5–3.8) and low nitrogen content (0.5–9.9 kg ha−1). The water table is
sea-sonally close to or above the soil surface. The water table usually reaches the soil surface in spring. The dry spruce forest (DSF) site is an old (80–150 years) spruce forest with
Picea abies (53%), Betula pubescens (5%), Populus
3 Measurement of NEE fluxes
The eddy covariance system employed at the experimental sites was similar to that used in the Euroflux project (Aubinet et al., 2000). Briefly, a three-axis sonic anemometer with an omni directional head (Solent R3, Gill Instruments, Lyming-ton, UK) was installed in 29 m and 44 m heights atop metal tower at WSF and DSF respectively. The instrument provides high frequency measurements (20 Hz) of the wind speed and the air temperature. For measurements of CO2 and water
vapor concentration, air was drawn from an inlet atop of the tower through a 1/4” inner diameter BEV-A-LINE tub-ing to a closed-path infrared gas analyzer (IRGA; LI-COR 6262, Lincoln, NE USA) located close to the bottom of the tower in an insulated wooden shelter. The suction pump was placed in front of the analyzer gas-inlet to ensure the air to be pushed through the instrument with a flow rate of approxi-mately 6 L min−1. A pressure transducer (PTP101B, Vaisala,
Helsinki, Finland) in the reference cell provided the neces-sary information to correct the measurements for variations associated with pressure fluctuations induced by the pump. The analyzer was run in absolute mode with CO2and
water-free air circulating in the reference cell, using a combination of magnesium perchlorate and soda-lime. Calibration of the instrument was checked regularly once a week using air of known CO2(pressure bottle) and H2O (dew-point generator,
LI 610, LI-COR, Lincoln, NE USA) concentrations. Output from the sonic anemometer and infrared gas analyzer were read at 20Hz through RS-232 ports and stored into comput-ers for subsequent analysis.
Ambient CO2concentrations at heights of 0.20, 1.0, 2.0,
5.0, 11.0, 15.6, 25.0, 27.6 m and 0.25, 1.0, 2.0, 5.80, 22.60, 33.40, 42.8 m at the WSF and DSF, respectively, were recorded with a system consisting of a LiCor nondis-persive infrared gas analyzer (Li-Cor 6251, LI-COR, Lin-coln, NE USA), pump (KNF, Neurberger, Germany), switch-ing manifold, BEV-A-Line tubswitch-ing and datalogger (Campbell, model CR23X). Air was drawn through the tubes at a rate of 7 L min−1, with each height being samples for 2 min, with
the reading taken at rate of 1 Hz over the last 10 s of sam-pling at each height and averaged before being stored.
The eddy towers was also equipped with instruments to measure environmental factors which have been used for the procedure of gap filling: incoming photosynthetic photon flux density (model LI-190SA, Lincoln, NE USA), humid-ity and temperature (model HMP35D, Vaisala, Helsinki, Fin-land), shortwave downward and upward radiation (CM14, Kipp and Zonen, Delft, Holland). Precipitation was col-lected on the height of 1 m above ground and was measured by a tipping bucket rain gauge (model 52202, R. M. Young Company, Traverse City, USA). Soil temperature was mea-sured by platinum resistance thermometers (Geratherm, Geschwenden, Germany) at two profiles at depths of 5, 15, 50 and 100 cm and then averaged for every depth. All meteo-rological data were collected every 10 s, and 10 min averages
or sums (precipitation only) were stored in the datalogger (Dl3000, Delta-T, Burwell, UK). For comparison with half-hourly eddy flux data, 30 min averages of the environmental data were subsequently calculated. The data of local weather station for precipitation were used during the period of dis-turbances of a tipping bucket rain gauge. The water table depth was measured by a ruler at the observation wells once a week.
The methods for gap filling procedure and estimating of average annual NEE have been described in detail by Van der Molen et al. (2007). The methods can be summarized as follows:
Eddy Covariance Data acquires and primary process with the software “Eddymeas” (Kolle and Rebmann, 2007). On the next stage the half-hourly data sets were processed using a standardized methodology described in Papale et al. (2006); Reichstein et al. (2005). The fluxes of CO2were
corrected for within-canopy CO2 storage, filtering for
low-turbulence night conditions using a friction velocity thresh-old criterion, spikes are detected. During the period analyzed (1999–2004) the different quality tests discarded part of the measured NEE data, leading yearly data coverage of 39–47% for night time and 58–71% for day time datasets. For gap-filling procedure was performed Marginal Distribution Sam-pling (MDS) method (Reichstein et al., 2005; Moffat et al., 2007).
Eddy tower measurements were conducted at WSF and DSF for six years from 1999–2004. A complete dataset of daily NEE fluxes measured at the WSF site were achieved for the entire measurement time span. The multi-year av-erage annual NEE flux for the WSF site was of about 2000 kg C ha−1per year (standard deviation of annual NEE
was 1031 kg C ha−1). However, the observed data at the
DSF site were not as complete as that at the WSF site due to the malfunctions of the instruments at DSF. The contin-uous measurements at DSF only covered a time periods: 7 October–21 November in 1999; 7 June–5 September in 2000; 18 June–7 July and 27 July–31 December in 2002; 1 January–15 May and 26 August–10 November in 2003; and 31 May–30 June and 28 July–20 September in 2004. Based on the limited measurements, an average annual NEE flux was estimated as –1440 kg C/ha for DSF1. The observa-tions indicated that the two adjacent forests, WSF and DSF, acted as a source and a sink, respectively, of atmospheric CO12. Water table depths were measured at WSF and DSF in 2004.
1van der Molen, M. K., Dolman, A. J., Marchesini, L. B., Ciais,
emission of NO, N2O, N2, NH3 and CH4
predicted gas fluxes predicted gas fluxes
NO
N2O
N2
emission of NO, N2O, N2, NH3 and CH4
predicted gas fluxes predicted gas fluxes
NO
N2O
N2
NO2
Nitrat -denitrifier
N2O
-denitrifier Nitrit -denitrifier
nitrifier
NO3
-NH3
clay-minerals
N2O
NO NH3
denitrification nitrification
NO3
-DOC
exchange of NO, N2O, NO3
-NH4+
DOC
NO2
Nitrat -denitrifier
N2O
-denitrifier Nitrit -denitrifier
nitrifier
NO3
-NH3
clay-minerals
N2O
NO NH3
denitrification nitrification
NO3
-DOC
exchange of NO, N2O, NO3
-NH4+
DOC soil
moisture profile
O2-profile
O2-diffusion
mean annual temperat. daily evapotrans-piration evaporation transpira-tion water movement
in the soil
Soil climate
soil T-profile
CO2
NH4+
DOC
non-degradable organic matter very labile labile resistant
degradable organic matter
degradable microbial matter very labile resistant
degradable humines labile resistant mineralisation soil moisture profile
O2-profile
O2-diffusion
mean annual temperat. daily evapotrans-piration evaporation transpira-tion water movement
in the soil
Soil climate
soil T-profile
CO2
NH4+
DOC
non-degradable organic matter very labile labile resistant
degradable organic matter
degradable microbial matter very labile resistant
degradable humines labile resistant mineralisation tree growth water demand root respiration water uptake by roots water stress photo-synthesis N-uptake by roots bio-mass leave- N-content plant respiration leaves wood root N-demand CO2 LAI depending albedo tree growth water demand root respiration water uptake by roots water stress photo-synthesis N-uptake by roots bio-mass leave- N-content plant respiration leaves wood root N-demand CO2 LAI depending albedo ecological
driver climate soil vegetation
ecological driver
human impact
Effect of temperature and moisture on mineralisation
predicted soil
environmental forces substrate (C, N) temperature moisture pH
anaerobic balloon
Forest-DNDC
methanogenesis
CH4-oxidation
CO2
methanotrophic bacteria
- diffusion - gasbubbles - plant tranpsort methanogenic bacteria
CH4
DOC CO2
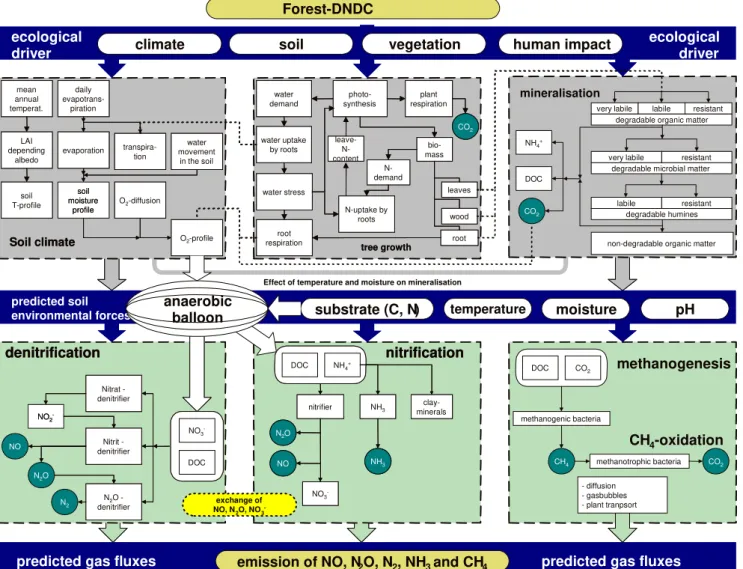
Fig. 2.Structure of the Forest-DNDC model.
4 Validations of Forest-DNDC
Forest-DNDC is a generic forest biogeochemical model. The model was developed by integrating two existing models, an upland forest model PnET-N-DNDC (Li et al., 2000; Stange et al., 2000) and a wetland forest model Wetland-DNDC (Zhang et al., 2002; Li et al., 2004; Cui et al., 2005). Equipped with the upland and wetland features from the par-ent models, Forest-DNDC is capable of simulating both aer-obic and anaeraer-obic processes at landscape scale. Forest-DNDC consists of two components. The first component consisting of the soil climate, plant growth and decompo-sition sub-models converts the primary drivers (e.g., climate, soil properties, vegetation and anthropogenic activity) to soil environmental factors (e.g., temperature, moisture, pH, Eh and substrate concentration gradients); and the second
com-ponent consisting of the nitrification, denitrification and fer-mentation sub-models predicts transformations of C and N driven by the soil environmental factors (Fig. 2). The six in-teracting sub-models form a computable framework to sim-ulate the forest growth and soil biogeochemical processes including SOM turnover and emissions of CO2, nitrous
ox-ide (N2O), nitric oxide (NO), dinitrogen (N2)and methane
(CH4). The modeled NEE flux is the net sum of the
Measured and modeled mean NEE fluxes from a upland sruce forest in Tharandt, Germany in 2000
-50 -40 -30 -20 -10 0 10
Jan Feb Mar Apr May Jun Jul Aug Sep Oct Nov Dec Month
NEE flux, kg C/ha/day
Field Model
R2 = 0.9058
Measured and modeled mean NEE fluxes from a upland sruce forest in Griffin Aberfeldy, UK in 1998
-50 -40 -30 -20 -10 0 10
Jan Feb Mar Apr May Jun Jul Aug Sep Oct Nov Dec Month
NEE flux, kg C/ha/day
Field Model
R2 = 0.7349
Measured and modeled mean NEE fluxes from a upland slash pine in Florida in 1996
-50 -40 -30 -20 -10 0
Jan Feb Mar Apr May Jun Jul Aug Sep Oct Nov Dec Month
Mean NEE flux, kg C/ha/day
Simulated Measured
Measured and modeled mean NEE fluxes from a wetland cypress in Florida in 1996
-20 -10 0 10 20
Jan Feb Mar Apr May Jun Jul Aug Sep Oct Nov Dec Month
Mean NEE f;ux, kg C/ha/day
Simulated Measured
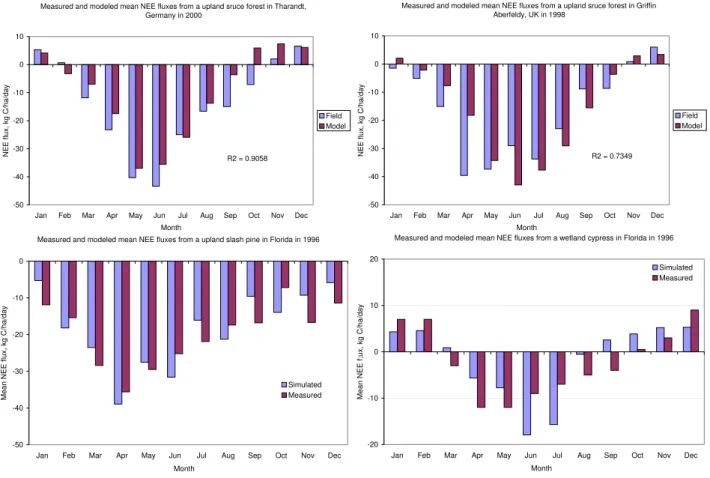
Fig. 3.Comparison between observed and Forest-DNDC modeled NEE fluxes for a upland spruce forest in Tharandt, Germany(a), a upland spruce forest in Griffin-Aberfeldy, the UK(b), a upland slash pine(c)and a wetland cypress(d)in Gainesville in Florida, the US. All the tested forest were sinks of atmospheric CO2although the wetland cypress at Gainesville sequestered the least C.
depth (WT) as an input parameter to define the saturated and unsaturated zones in the modeled soil profile. The input WT data can be obtained from one of three optional sources in-cluding (1) field-observed WT, (2) predicted WT with empir-ical parameters developed with historempir-ical WT data, and (3) predicted WT with spatial distribution hydrological models based on the watershed information (e.g., topography, cli-mate, soil and vegetation). An interface has been built in Forest-DNDC to allow users to select one of the options to define the WT fluctuation.
To test the applicability of Forest-DNDC for upland and wetland forests, we applied the model for four forest ecosys-tems in Europe and the US. The tested forests included an upland spruce plantation in Tharandt, Germany, an upland spruce forest in Griffin-Aberfeldy, the UK, a upland slash pine in Florida, the US, and a wetland cypress in Florida, the US. The measured NEE flux data were obtained from Christian Bernhofer for the Tharandt site, John Moncrieff for the Griffin-Aberfeldy site, and Clark et al. (1999 and 2004) for the Gainesville sites. The European data were accessible in the CarboeuropeIP database at http://gaia.agraria.unitus.it/ database (Papale et al., 2006 and Moffat et al., 2007). The
two European stands were spruce plantations with relatively young ages (20–50 years old). The measured NEE fluxes in-dicated that the forests were sinks of atmospheric CO2on an
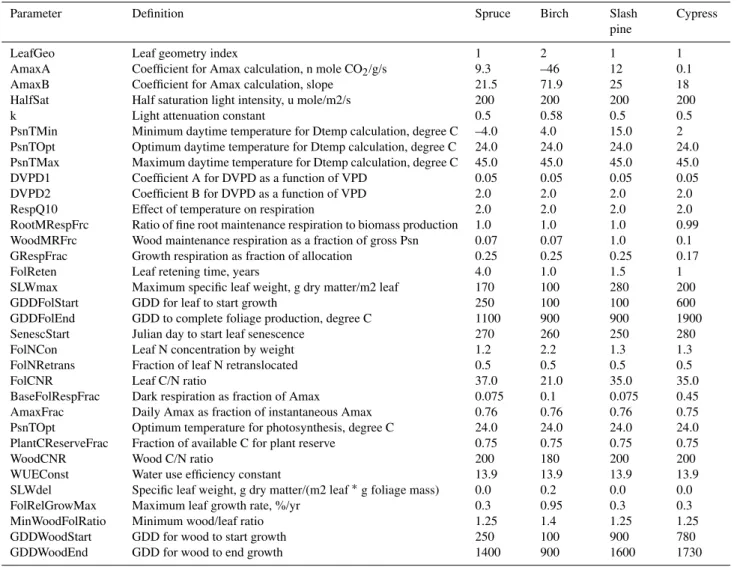
Table 1.Physiological and phenology parameters for spruce, birch, slash pine and cypress forests adopted in Forest-DNDC.
Parameter Definition Spruce Birch Slash
pine Cypress LeafGeo AmaxA AmaxB HalfSat k PsnTMin PsnTOpt PsnTMax DVPD1 DVPD2 RespQ10 RootMRespFrc WoodMRFrc GRespFrac FolReten SLWmax GDDFolStart GDDFolEnd SenescStart FolNCon FolNRetrans FolCNR BaseFolRespFrac AmaxFrac PsnTOpt PlantCReserveFrac WoodCNR WUEConst SLWdel FolRelGrowMax MinWoodFolRatio GDDWoodStart GDDWoodEnd
Leaf geometry index
Coefficient for Amax calculation, n mole CO2/g/s
Coefficient for Amax calculation, slope Half saturation light intensity, u mole/m2/s Light attenuation constant
Minimum daytime temperature for Dtemp calculation, degree C Optimum daytime temperature for Dtemp calculation, degree C Maximum daytime temperature for Dtemp calculation, degree C Coefficient A for DVPD as a function of VPD
Coefficient B for DVPD as a function of VPD Effect of temperature on respiration
Ratio of fine root maintenance respiration to biomass production Wood maintenance respiration as a fraction of gross Psn Growth respiration as fraction of allocation
Leaf retening time, years
Maximum specific leaf weight, g dry matter/m2 leaf GDD for leaf to start growth
GDD to complete foliage production, degree C Julian day to start leaf senescence
Leaf N concentration by weight Fraction of leaf N retranslocated Leaf C/N ratio
Dark respiration as fraction of Amax
Daily Amax as fraction of instantaneous Amax Optimum temperature for photosynthesis, degree C Fraction of available C for plant reserve
Wood C/N ratio
Water use efficiency constant
Specific leaf weight, g dry matter/(m2 leaf∗g foliage mass)
Maximum leaf growth rate, %/yr Minimum wood/leaf ratio GDD for wood to start growth GDD for wood to end growth
1 9.3 21.5 200 0.5 –4.0 24.0 45.0 0.05 2.0 2.0 1.0 0.07 0.25 4.0 170 250 1100 270 1.2 0.5 37.0 0.075 0.76 24.0 0.75 200 13.9 0.0 0.3 1.25 250 1400 2 –46 71.9 200 0.58 4.0 24.0 45.0 0.05 2.0 2.0 1.0 0.07 0.25 1.0 100 100 900 260 2.2 0.5 21.0 0.1 0.76 24.0 0.75 180 13.9 0.2 0.95 1.4 100 900 1 12 25 200 0.5 15.0 24.0 45.0 0.05 2.0 2.0 1.0 1.0 0.25 1.5 280 100 900 250 1.3 0.5 35.0 0.075 0.76 24.0 0.75 200 13.9 0.0 0.3 1.25 900 1600 1 0.1 18 200 0.5 2 24.0 45.0 0.05 2.0 2.0 0.99 0.1 0.17 1 200 600 1900 280 1.3 0.5 35.0 0.45 0.75 24.0 0.75 200 13.9 0.0 0.3 1.25 780 1730
C fluxes to daily NEE fluxes for the modeled forest ecosys-tems. The physiological and phenology parameters of the simulated forests were adopted from Aber et al. (Aber and Federer, 1992) with minor modifications. All the forest pa-rameters utilized in Forest-DNDC for the study are listed in Table 1.
The modeled patterns and magnitudes of NEE fluxes were basically in agreement with observations for all the four stands. On an annual basis, the measured NEE fluxes were 5830, 5011, 7400 and 840 kg C/ha, and the modeled NEE fluxes were 5470, 3570, 6720 and 650 kg C/ha for the spruce in Griffin-Aberfeldy, the spruce in Tharandt, the slash pine in Grainesville and the cypress in Grainesville, respectively (Table 2). Monthly mean NEE fluxes were calculated and are shown in Fig. 3 to demonstrate the seasonality of the measured and modeled NEE fluxes. Both the measured and modeled results showed that C sequestration rate of the wet-land forest in Florida was significantly lower than that of the
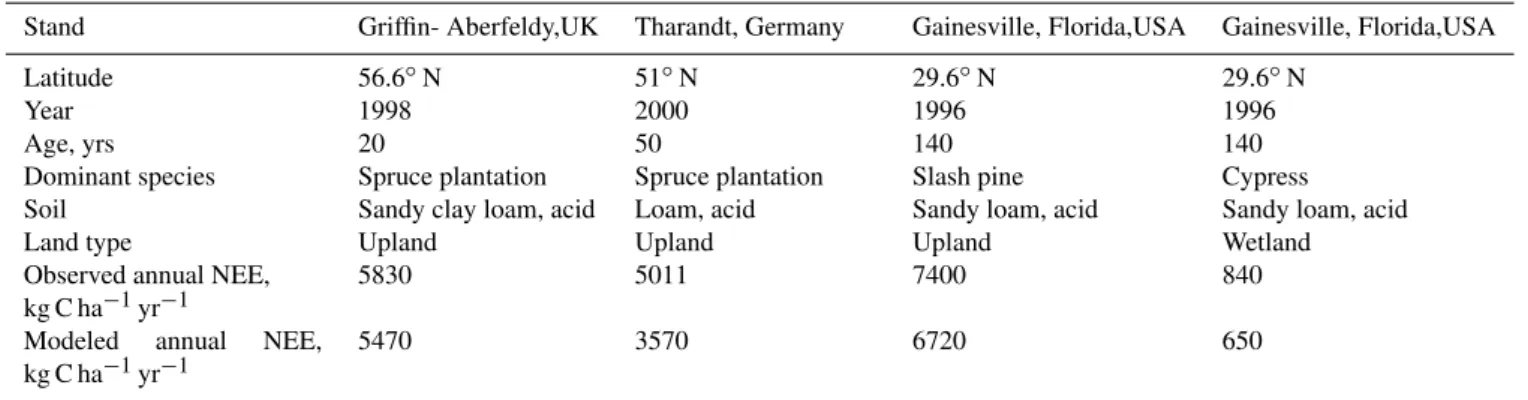
Table 2.Characteristics of four forest stands used for validation of Forest-DNDC∗.
Stand Griffin- Aberfeldy,UK Tharandt, Germany Gainesville, Florida,USA Gainesville, Florida,USA Latitude 56.6◦N 51◦N 29.6◦N 29.6◦N
Year 1998 2000 1996 1996
Age, yrs 20 50 140 140
Dominant species Spruce plantation Spruce plantation Slash pine Cypress Soil Sandy clay loam, acid Loam, acid Sandy loam, acid Sandy loam, acid Land type Upland Upland Upland Wetland Observed annual NEE,
kg C ha−1yr−1
5830 5011 7400 840
Modeled annual NEE, kg C ha−1yr−1
5470 3570 6720 650
∗Measured NEE flux data from Papale et al., 2006 and Moffat et al., 2007 through the CarboeuropeIP database at http://gaia.agraria.unitus.
it/database, Christian Bernho fer for Tharandt, John Moncrieff for Griffin-Aberfeldy, and Clark et al. for Gainesville sites.
4.1 Forest-DNDC application for the Russian forests Long-term NEE measurements were conducted at the two Russian forests, WSF and DSF, at Fyodorovskoe from 1999-2004. Van der Molen and his colleagues have thoroughly analyzed the measured data and concluded that the two adja-cent forests differed in C sequestration with WSF as a source and DSF as a sink of atmospheric CO2 ( van der Molen et
al., 2007). In this study, Forest-DNDC was utilized to in-terpret the difference. For the model simulations, the WSF forest was set to be a 150 years old spruce forest with a 50 years old birch as the under-story; and the DSF forest was constructed with a 100 years old spruce as the upper-story with a 10 years old birch as the under-story. The WSF site had a 60-cm organic layer containing about 200 tons C/ha, and the DSF site a 5-cm organic layer containing 25 tons C/ha. Based on the field observations, we set DSF as an up-land forest with the WT depth below the modeled soil depth; while we set WSF as a wetland forest with the WT depth seasonally close to the ground surface. The daily WT depth data at WSF for the period from 1999–2004 were calculated based on the WT data measured in 2004 in conjunction with the daily climate data for the six yeas. As mentioned ear-lier in the paper, a group of hydrological parameters have been embedded in Forest-DNDC to empirically predict the daily WT dynamics based on historical WT data. The val-ues of the six parameters, namely initial WT depth, lowest WT depth ceasing surface outflow, lowest WT depth ceasing ground outflow, fraction of precipitation for surface inflow, intensity of surface outflow and intensity of ground outflow, can be empirically determined with a fitting-tuning method based on observed WT depth data for a specific site (Zhang et al., 2002). In this study, the WT data measured at WSF in 2004 were used to determine the parameter values. With the approach, the six parameters were endowed with the specific values as –16 cm, –15 cm, –60 cm, 15, 0.9 and 0.05,
respec--0.7 -0.6 -0.5 -0.4 -0.3 -0.2 -0.1 0
1 18 35 52 69 86 103 120 137 154 171 188 205 222 239 256 273 290 307 324 341 358 Day
Water table depth, m
Fig. 4. Comparison of the hydrological parameters-induced wa-ter table (WT) dynamics with observed WT depth data for WSF in 2004.
tively. Equipped with the hydrological parameters, daily WT depths were calculated for the years from 1999-2004 driven by their daily climate data. Figure 4 shows the hydrological parameters-generated WT dynamics in comparison with the observed WT data for 2004. Table 3 contains the calculated WT data in comparison with the temperature and precipita-tion data for 1999–2004.
Table 3.Monthly average air temperature (T,◦C), monthly sum of precipitation (P, mm) and modeled monthly average water table depth (W, m; negative values mean below ground) for the wet spruce forest (WSF) in Fyodorovskoe, Tver, Russia from 1999–2004.
Jan Feb Mar Apr May Jun Jul Aug Sep Oct Nov Dec
T1999 –6.0 –9.7 –0.8 9.2 7.9 20.9 20.3 15.0 11.5 5.0 –3.7 –2.9
T2000 –7.2 –3.5 –1.7 9.4 10.1 14.2 16.8 15.2 9.2 6.8 0.5 –3.1
T2001 –4.8 –8.4 –3.2 9.3 10.4 14.9 21.5 15.6 10.8 5.1 –2.4 –12.0
T2002 –5.9 –2.3 0.8 6.7 12.4 15.3 20.7 17.2 10.3 0.9 –2.5 –12.0
T2003 –8.3 –8.6 –2.3 3.1 13.1 12.2 19.3 14.7 10.0 3.5 0.2 –3.1
T2004 –8.4 –7.7 0.1 4.1 10.1 13.8 17.4 17.0 10.9 4.6 –2.5 –3.5
P1999 64.3 55.3 43.3 16.1 24.4 22.5 49.9 122.0 23.0 107.2 25.4 89.3
P2000 41.3 59.1 25.0 69.2 47.4 95.8 171.4 85.3 36.3 28.0 60.1 54.0
P2001 39.8 59.3 63.3 26.3 48.0 52.6 48.3 67.9 32.0 69.3 88.9 35.7
P2002 56.5 82.1 49.9 8.3 21.3 87.1 13.4 3.9 20.3 93.5
P2003 49.3 13.3 22.0 51.0 66.6 100.7 140.0 194.0 25.2 129.0 54.6 60.1
P2004 85.8 56.8 42.4 4.0 65.7 62.0 77.4 70.7 49.1 87.7 58.9 71.8
W1999 –0.28 –0.26 –0.16 –0.20 –0.19 –0.15 –0.17 –0.19 –0.42 –0.26 –0.28 –0.20
W2000 –0.19 –0.19 –0.19 –0.18 –0.15 –0.17 –0.15 –0.16 –0.32 –0.49 –0.22 –0.22
W2001 –0.28 –0.28 –0.26 –0.15 –0.17 –0.17 –0.17 –0.21 –0.42 –0.37 –0.18 –0.15
W2002 –0.20 –0.20 –0.20 –0.19 –0.15 –0.17 –0.15 –0.40 –0.50 –0.25 –0.26 –0.21
W2003 –0.21 —0.21 –0.21 –0.21 –0.18 –0.17 –0.17 –0.22 –0.37 –0.23 –0.16 –0.21
W2004 –0.21 –0.21 –0.21 –0.20 –0.18 –0.16 –0.31 –0.38 –0.36 –0.30 –0.34 –0.31
basically in agreement with observations; (2) both the mea-sured and modeled monthly NEE fluxes showed clear sea-sonality with sequestering C in early summers and releasing C in autumns and winters; (3) on an annual basis, the WSF ecosystem was a source of atmospheric CO2with the C
se-questration rates varying between –1000 and –6000 kg C/ha per year during the tested six years; and (4) the highest loss of C occurred in 2002 with the lowest precipitation in the year. In contrast to WSF, the modeled NEE data indicated that DSF was a sink of atmospheric CO2. The NEE data
we collected from DSF were not as complete as that from WSF. A multi-year average NEE flux value for DSF was cal-culated based on all the observed datasets and reported by van der Molen et al. (2007). Based on the results from van der Molen et al. (2007), the averaged annual NEE flux was –1440 kg C/ha, which was comparable with our modeled re-sult, –1200 kg C/ha. The modeled data further indicated that the difference in NEE between WSF and DSF resulted from two reasons, i.e., forest age and SOC content. In compar-ison with DSF, WSF possessed relatively older trees with lower photosynthesis and higher respiration rates. In addi-tion, WSF had more organic C content in its peat soil profile that caused higher soil respiration rates.
To further test the sensitivity of wetland C dynamics to climate change, we re-ran Forest-DNDC for the WSF site but with varied soil hydrological scenarios. Based on the 2004-observed daily water table (WT) depths as the base-line scenario (WT0), we systematically elevated the daily WT depths by 20 and 40 cm, and decreased the daily WT depths by 20 and 40 cm to create four alternative scenarios,
WT+40, WT+20, WT–20 and WT–40, respectively. Forest-DNDC was run for WSF with the baseline and alternative WT scenarios for year 2004. Results from the sensitiv-ity tests indicated that when the WT scenario shifted from the highest one (i.e., WT+40) to the lowest one (i.e., WT– 40) (1) the fraction of soil profile allocated in the unsat-urated zone significantly increased (Fig. 6a), (2) the an-nual soil heterotrophic respiration rate increased from 320 to 6160 kg C/ha (Fig. 6b); and (3) the annual NEE flux in-creased from –1820 to 3820 kg C/ha. The results suggested that variation in WT dynamics alone could significantly af-fect the C balance in wetland ecosystems mainly through al-tering the decomposition rate of the organic matter accumu-lated in the soil profile. The modeled results supported the hypothesis that the soil processes, especially the decompo-sition process, in wetlands could play an important role in altering the C dynamics in the ecosystems.
5 Discussions
Measured and modeled monthly NEE fluxes from the wet spruce forest (WSF) at Fyodorovskoe, Russia from 1999-2004
-600 -400 -200 0 200 400 600 800 1000
199 9
200 0
200 1
200 2
200 3
200 4
Year
NEE flux, kg C/ha/month
Field Model R2 = 0.4985
Measured and modeled annual NEE fluxes from the wet spruce forest (WSF) at Fyodorovskoe, Russia from 1999-2004
0 1000 2000 3000 4000 5000 6000 7000
1999 2000 2001 2002 2003 2004
Year
NEE flux, kg C/ha/year
Field Model R2 = 0.8519
Fig. 5.Comparison between observed and Forest-DNDC modeled NEE fluxes from the wet spruce forest (WSF) in the Central Forest Reserve at Fyodorovskoe, Tver, Russia in 1999-2004 on a monthly
(a)and an annual(b)basis.
sequestering C or be sources of atmospheric CO2. Globally,
wetland soils contain a significant proportion of the terres-trial soil C (20–25%), despite the relatively small proportion of the total land area (2–3%) occupied. When considered on a unit area basis, upland forest soils typically have less than 3 kg C m−2, whereas forested wetland soils may
con-tain from 9 to 90 kg C m−2(Trettin and Jurgensen, 2003). It
is apparently important to understand the feedbacks between the wetland C storage and global climate change. There is a hypothesis that the large amount of organic carbon stored in wetland soils could readily be released into the atmosphere if the climate becomes warmer and dryer, especially in the high latitude areas. The six-year NEE measurements at the two adjacent spruce forests at Fyodorovskoe in Russia pro-vided a unique case for us to test the hypothesis. Based on the field observations, the two forests shared similar climate and vegetation structure but differed in soil conditions; and the measured NEE data indicated the wetland spruce for-est (WSF) was a source of atmospheric CO2while the dry
spruce forest (DSF), like most upland forests, remained as a sink (van der Molen et al., 2007). In this study, we utilized a process-based model, Forest-DNDC, to interpret the
ob-Fig. 6.A sensitivity test for the wetland spruce forest (WSF) in Fyo-dorovskoe, Russia. When the water table (WT) depths shifted from the high to the low scenarios, the fraction of soil profile exposed to aerobic conditions(a)and soil heterotrophic respiration rate(b)
non-lineally increased.
served differences between the two forest stands. The mod-eled results reproduced the observations that WSF and DSF were in negative and positive C balances, respectively. A sen-sitivity test with varied WT conditions indicated that climate change could significantly affect the C balance in wetland forest ecosystems by altering the soil decomposition rates. A drier and warmer climate could convert wetlands from a sink to a source of atmospheric CO2. The conclusion from this
modeling study could be applicable for a wide range of wet-land ecosystems that have accumulated high contents of soil organic C during the historical period and now suffer from climate change and anthropogenic activities.
In comparison with most existing C models, such as CEN-TURY, CASA or Roth-C, which were developed mainly fo-cusing on upland ecosystems, Forest-DNDC appears more powerful to work at landscape scale that are mosaicked by wetland and upland ecosystems. However, Forest-DNDC is relatively weak in simulating forest community. The forest growth sub-model embedded in Forest-DNDC was adopted from a forest physiological model, PnET, developed by Aber and Federer (1992). PnET has well developed physiological processes but is lack of forest structure functions. To over-come the weakness, a three-layer vegetation structure was developed in Forest-DNDC to allow the users to construct a forest ecosystem by defining its upper story, under story and ground growth (e.g., sedge, moss etc.) (Zhang et al., 2002; Li et al., 2004). The upper story and under story can be defined as two different species of trees to make up a multi-species forest. For example, in this study, the modeled spruce forests in Russia were constructed with a 150 years old spruce as the upper story and a 25 years old birch as the under story. By changing the proportions of the two species, the bulk pho-tosynthesis, respiration and other physiological parameters of the forest can be adjusted to match the corresponding ob-servations. However, this simplification may not adequately applicable for complex forest communities. This weakness will need to be addressed in the future development of the model.
Acknowledgements. The study reported in this paper was supported by the US NASA through Northern Eurasia Earth Science Partner-ship Initiative (NEESPI) project “Quantifying CO2fluxes of boreal
forests in northern Eurasia through integrated analyses of in-situ flux tower, remote sensing and biogeochemical modeling” (NASA #143192), by European Commission DG Research 5th Frame-work Programme, projects EUROSIBERIAN CARBONFLUX (ENV4-CT97-0491) and TCOS-Siberia (EVK2-CT-2001-00131). We appreciate the assistances provided by Christian Bernhofer, John Moncrieff, Moffat A.M. and Papale D. with their permissions to allow us to use their NEE data published at the CarboeuropeIP database (http://gaia.agraria.unitus.it/database). We thank Huiyong Sang for her decent work formatting the manuscript for submission. Edited by: T. Laurila
References
Aber, J. D. and Federer, C. A.: A generalized, lumped-parameter model of photosynthesis, evapotranspiration and net primary pro-duction in temperate and boreal forest ecosystems, OECOLO-GIA, 92, 463–474, 1992.
Aubinet, M., Grelle, A., Ibrom, A., Rannik, U., Moncrieff, J., Fo-ken, T., Kowalski, A. S., Martin, P. H., Berbigier, P., Bernhofer, C., Clement, R., Elbers, J., Granier, A., Grunwald, T., Morgen-stern, K., Pilegaard, K., Rebmann, C., Snijders, W., Valentini, R., and Vesala, T.: Estimates of the annual net carbon and wa-ter exchange of forests: The euroflux methodology, Advances in Ecological Research, 30(30), 113–175, 2000.
Butterbach-Bahl, K., Kesik, M., Miehle, P., Papen, H., and Li, C.: Quantifying the regional source strength of n-trace gases across agricultural and forest ecosystems with process based models, Plant and Soil, 260, 311–329, 2004.
Clark, K. L., Gholz, H. L., Moncrieff, J. B., Cropley, F., Loescher, H. W.: Environmental controls over net exchanges of carbon dioxide from contrasting Florida ecosystems, Ecological Appli-cations, 9(3), 936, 1999.
Clark, K. L., Gholz, H. L., and M. S. Castro, M. S.: Carbon dy-namics along a chronosequence of slash pine plantations in north Florida, Ecological Applications, 14:4. 1154–1171, 2004. Cui, J., Li, C., Sun, G., and Trettin, C.: Linkage of mike she to
wetland-dndc for carbon budgeting and anaerobic biogeochem-istry simulatio, Biogeochembiogeochem-istry, 72, 147–167, 2005.
Dixon, R. K., Brown, S., Houghton, R., Solomon, S. C., Trexler, M. C., and Wisniewski, J.: Carbon pools and flux of global forest ecosystems, Science, 263, 185–190, 1994.
Falge, E., Baldocchi, D., Tenhunen, J., Aubinet, M., Bakwin, P., Berbigier, P., Bernhofer, C., Burba, G., Clement, R., Davis, K. J., Elbers, J. A., Goldstein, A. H., Grelle, A., Granier, A., Guo-mundsson, J., Hollinger, D., Kowalski, A. S., Katul, G., Law, B. E., Malhi, Y., Meyers, T., Monson, R. K., Munger, J. W., Oechel, W., Paw, K. T., Pilegaard, K., Rannik, U., Rebmann, C., Suyker, A., Valentini, R., Wilson, K., and Wofsy, S.: Sea-sonality of ecosystem respiration and gross primary production as derived from fluxnet measurements, Agricultural and Forest Meteorology, 113, 53–74, 2002.
Fan, S., Gloor, M., Mahlman, J., Pacala, S., Sarmiento, J., Taka-hashi, T., and Tans, P.: A large terrestrial carbon sink in north america implied by atmospheric and oceanic carbon dioxide data and models, Science, 282, 442–446, 1998.
Hamada, S., Ohta, T., Hiyama, T., Kuwada, T., Takahashi, A., and Maximov, T. C.: Hydrometeorological behaviour of pine and larch forests in eastern siberia, Hydrological Processes, 18, 23– 39, 2004.
Hollinger, D. Y., Kelliher, F. M., Schulze, E. D., Bauer, G., Arneth, A., Byers, J. N., Hunt, J. E., McSeveny, T. M., Kobak, K. I., Milukova, I., Sogatchev, A., Tatarinov, F., Varlargin, A., Ziegler, W., and Vygodskaya, N. N.: Forest-atmosphere carbon dioxide exchange in eastern siberia, Agricultural and Forest Meteorol-ogy, 90, 291–306, 1998.
Jarvis, P. and Linder, S.: Constraints to growth of boreal forests, Nature, 405, 904–905, 2000.
Jarvis, P., Saugier, B., and Schulze, E. D.: Producitivity of boreal forests, in: Terrestrial global productivity, edited by: Roy, J., Saugier, B., and Mooney, H. A., Academic Press Inc., San Diego, CA, 211–244, 2001.
Kesik, M., Ambus, P., Baritz, R., Bruggemann, N. B., Butterbach-Bahl, K., Damm, M., Duyzer, J., Horvath, L., Kiese, R., Kitzler, B., Leip, A., Li, C., Pihlatie, M., Pilegaard, K., Seufert, G., Simp-son, D., Skiba, U., Smiatek, G., Vesala, T., and Zechmeister-Boltenstern, S.: Inventories of N2O and NO emissions from
eu-ropean forest soils, Biogeosciences, 2, 353–375, 2005, http://www.biogeosciences.net/2/353/2005/.
Kiese, R., Li, C., Hilbert, D., Papen H., and Butterbach-Bahl, K.: Regional application of PnET-N-DNDC for estimating the N2O
Kobak, K. I., Turchinovich, I. Y., Kondrasheva, N. Y., Schulze, E. D., Schulze, W., Koch, H., and Vygodskaya, N. N.: Vulnerability and adaptation of the larch forest in eastern siberia to climate change, Water, Air, and Soil Pollution, 92, 119–127, 1996. Kolle, O. and Rebmann, C.: EddySoft – Documentation of a
Soft-ware Package to Aquire and Process Eddy Covariance Data, Max-Planck-Institut fur Biogeochemie, Jena, Technical Report, 10, 85, 2007.
Li, C., Aber, J. D., Stange, F., Butterbach-Bahl, K., and Papen, H.: A process-oriented model of N2O and NO emissions from forest soils: 1. Model developement, J. Geophys. Res.-Atmos., 105, 4369–4384, 2000.
Li, C., Cui, J., Sun, G., and Trettin, C. C.: Modeling impacts of management on carbon sequestration and trace gas emissions in forested wetland ecosystems, Environmental Management, 33, 176–186, 2004.
Li, C.: Quantifying greenhouse gas emissions from soils: Scientific basis and modeling approach, Soil Science and Plant Nutrition, 53, 344–352, 2007.
Lloyd, J., Shibistova, O., Zolotoukhine, D., Kolle, O., Arneth, A., Wirth, C., Styles, J. M., Tchebakova, N., and Schulze, E. D.: Seasonal and annual variations in the photosynthetic productivity and carbon balance of a central siberian pine forest, Tellus Series B-Chemical and Physical Meteorology, 54B, 590–610, 2002. Melillo, J. M., Mcguire, A. D., Kicklighter, D. W., Moore, B.,
Vorosmarty, C. J., and Schloss, A. L.: Global climate-change and terrestrial net primary production, Nature, 363, 234–240, 1993. Miehle, P., S.J. Livesley, P.M. Feikema, C. Li, and S.K. Arndt.
As-sessing productivity and carbon sequestration capacity of Eu-calyptus globulus plantations using the process model Forest-DNDC: Calibration and validation. Ecological Modelling 192, 83–94, 2006.
Milyukova, I. M., Kolle, O., Varlagin, A. V., Vygodskaya, N. N., Schulze, E. D., and Lloyd, J.: Carbon balance of a southern taiga spruce stand in european russia, Tellus Series B-Chemical and Physical Meteorology, 54, 429–442, 2002.
Moffat, A. M., Papale, D., Reichstein, M., Hollinger, D. Y., Richardson, A. D., Barr, A. G., Beckstein, C., Braswell, B. H., Churkina, G., Desai, A. R., Falge, E., Gove, J. H., Heimann, M., Hui, D., Jarvis, A. J., Kattge, J., Noormets, A., and Stauch, V. J.: Comprehensive comparison of gap-filling techniques for eddy covariance net carbon fluxes, Agr. Forest Meteorol., 147, 209–232, 2007.
Myneni, R. B., Dong, J., Tucker, C. J., Kaufmann, R. K., Kauppi, P. E., Liski, J., Zhou, L., Alexeyev, V., and Hughes, M. K.: A large carbon sink in the woody biomass of northern forests, Proceed-ings of the National Academy of Sciences of the United States of America, 98, 14 784–14 789, 2001.
Ohta, T., Hiyama, T., Tanaka, H., Kuwada, T., Maximov, T. C., Ohata, T., and Fukushima, Y.: Seasonal variation in the energy and water exchanges above and below a larch forest in eastern siberia, Hydrological Processes, 15, 1459–1476, 2001.
Papale, D., Reichstein, M., Aubinet, M., Canfora, E., Bernhofer, C., Longdoz, B., Kutsch, W., Rambal, S., Valentini, R., Vesala, T., Yakir, D.: Towards a standardized processing of Net Ecosystem Exchange measured with eddy covariance technique: algorithms and uncertainty estimation, Biogeosciences, 3, 571–583, 2006, http://www.biogeosciences.net/3/571/2006/.
Reichstein, M., Falge, E., Baldocchi, D., Papale, D., Aubinet,
M., Berbigier, P., Bernhofer, C., Buchmann, N., Gilmanov, T., Granier, A., Grunwald, T., Havr’ankov’a, K., Ilvesniemi, H., Janous, D., Knohl, A., Laurila, T., Lohila, A., Loustau, D., Mat-teucci, G., Meyers, T., Miglietta, F., Ourcival, J.-M., Pumpanen, J., Rambal, S., Rotenberg, E., Sanz, M., Tenhunen, J., Seufert, G., Vaccari, F., Vesala, T., Yakir, D., and Valentini, R.: On the separation of net ecosystem exchange into assimilation and ecosystem respiration: review and improved algorithm, Global Change Biol., 11, 1424–1439, 2005.
Roeser, C., Montagnani, L., Schulze, E. D., Mollicone, D., Kolle, O., Meroni, M., Papale, D., Marchesini, L. B., Federici, S., and Valentini, R.: Net co2exchange rates in three different
succes-sional stages of the “Dark taiga” Of central siberia, Tellus Series B-Chemical and Physical Meteorology, 54 B, 642–654, 2002. Schimel, D. S., House, J. I., Hibbard, K. A., Bousquet, P., Ciais, P.,
Peylin, P., Braswell, B. H., Apps, M. J., Baker, D., Bondeau, A., Canadell, J., Churkina, G., Cramer, W., Denning, A. S., Field, C. B., Friedlingstein, P., Goodale, C., Heimann, M., Houghton, R. A., Melillo, J. M., Moore, B., Murdiyarso, D., Noble, I., Pacala, S. W., Prentice, I. C., Raupach, M. R., Rayner, P. J., Scholes, R. J., Steffen, W. L., and Wirth, C.: Recent patterns and mecha-nisms of carbon exchange by terrestrial ecosystems, Nature, 414, 169–172, 2001.
Schulze, E. D., Lloyd, J., Kelliher, F. M., Wirth, C., Rebmann, C., Luhker, B., Mund, M., Knohl, A., Milyukova, I. M., Schulze, W., Ziegler, W., Varlagin, A. B., Sogachev, A. F., Valentini, R., Dore, S., Grigoriev, S., Kolle, O., Panfyorov, M. I., Tchebakova, N., and Vygodskaya, N. N.: Productivity of forests in the eurosi-berian boreal region and their potential to act as a carbon sink – a synthesis, Global Change Biology, 5, 703–722, 1999. Shvidenko, A. and Nilsson, S.: Dynamics of russian forests and the
carbon budget in 1961-1998: An assessment based on long-term forest inventory data, Climatic Change, 55, 5–37, 2002. Stange, F., Butterbach-Bahl, K., Papen, H.,
Zechmeister-Boltenstern, S., Li, C. S., and Aber, J.: A process-oriented model of n2o and no emissions from forest soils 2. Sensitivity analysis and validation, J. Geophys. Res.-Atmos., 105, 4385–4398, 2000. Stange, F., Butterbach-Bahl, K., Papen, H., Zechmeister-Boltenstern, S., Li, C., Aber, J.: A process-oriented model of N2O and NO emission from forest soils 2, Sensitivity analysis and validation, J. Geophys. Res., 105 , 4 , 4385–4398, 2000. Sun, G., Li, C., Trettin, C., Lu, J., and McNulty, S. G.:
Simu-lating the Biogeochemical Cycles in Cypress Wetland-Pine Up-land Ecosystems at a Landscape Scale with the WetUp-land-DNDC Model. In Proceedings of the International Conference on Hy-drology and Management of Forested Wetlands. April 8-12, 2006. New Bern, NC, 261–270, 2006.
Trettin, C. C. and Jurgensen, M. F.: Carbon cycling in wetland for-est soils. Pg. 311-331, In: J. Kimble, R. Birdsie, R. Lal. Carbon Sequestration in US Forests, Lewis Publisher. Boca Raton, FL. 2003.
Vygodskaya, N., Abrazhko, V., Varlagin, A., Kurbatova, Y., Sidorov, K., Milukova, I., Sogachev, A., Sogacheva, L., Sha-poshnikov, E., Nepomnyashii, G., and Abrazhko, M.: Long-term dynamics of soil moisture and drying of spruce trees in spruce forests of the southern taiga, Lesovedenie, 1, 3–22, 2004a. Vygodskaya, N. N., Schulze, E. D., Tchebakova, N. M.,
Minaeva, T. Y., Jeltuchin, A. S., Wirth, C., and Pugachevskii, A. V.: Climatic control of stand thinning in unmanaged spruce forests of the southern taiga in european russia, Tellus Series B-Chemical and Physical Meteorology, 54, 443–461, 2002. Vygodskaya, N. N., Oltchev, A. V., Kurbatova, J. A., and Varlargin,
A.: Gross primary production (gpp) of unmanaged over-mature spruce forests at southern european taiga: Eddy covariance mea-surements and modeling approach, in: Modeling forest produc-tion, scientific tools - data needs and sources, validation and ap-plication, edited by: Hasenauer, H., and Makela, A., 421–430, 2004b.