BGD
5, 271–296, 2008Modeling carbon dynamics in Russian
forests
J. Kurbatova et al.
Title Page
Abstract Introduction
Conclusions References
Tables Figures
◭ ◮
◭ ◮
Back Close
Full Screen / Esc
Printer-friendly Version
Interactive Discussion
Biogeosciences Discuss., 5, 271–296, 2008 www.biogeosciences-discuss.net/5/271/2008/ © Author(s) 2008. This work is licensed under a Creative Commons License.
Biogeosciences Discussions
Biogeosciences Discussionsis the access reviewed discussion forum ofBiogeosciences
Modeling carbon dynamics in two
adjacent spruce forests with di
ff
erent soil
conditions in Russia
J. Kurbatova1, C. Li2, A. Varlagin1, X. Xiao2, and N. Vygodskaya1
1
A. N. Severtsov Institute of Ecology and Evolution, Russian Academy of Sciences, Moscow, Russia
2
Institute for the Study of Earth, Oceans, and Space, University of New Hampshire, Durham, NH03824, USA
Received: 5 December 2007 – Accepted: 11 December 2007 – Published: 24 January 2008
BGD
5, 271–296, 2008Modeling carbon dynamics in Russian
forests
J. Kurbatova et al.
Title Page
Abstract Introduction
Conclusions References
Tables Figures
◭ ◮
◭ ◮
Back Close
Full Screen / Esc
Printer-friendly Version
Interactive Discussion
EGU
Abstract
Net ecosystem carbon exchange (NEE) were measured with eddy covariance method for two adjacent forests located at the southern boundary of European taiga in Rus-sia in 1999–2004. The two spruce forests shared similar vegetation composition but differed in soil conditions. The wet spruce forest (WSF) possessed a thick peat layer 5
(60 cm) with a high water table seasonally close to or above the soil surface. The dry spruce forest (DSF) had a relatively thin organic layer (5 cm) with a deep water table (>60 cm). The measured NEE fluxes (2000 and −1440 kg C ha−1yr−1 for WSF and DSF, respectively) indicated that WSF was a source while DSF a sink of atmospheric carbon dioxide during the experimental years. A process-based model, Forest-DNDC, 10
was employed in the study to interpret the observations. The modeled NEE fluxes were 1800 and−2200 kg C ha−1yr−1for WSF and DSF, respectively, which were com-parable with the observations. The modeled data indicated that WSF and DSF had similar rates of photosynthesis and plant autotrophic respiration but differed in soil het-erotrophic respiration. The simulations resulted in a hypothesis that the water table 15
fluctuation at WSF could play a key role in determining the negative C balance in the ecosystem. A sensitivity test was conducted by running Forest-DNDC with varied water table scenarios for WSF. The results proved that the NEE fluxes from WSF were highly sensitive to the water table depth. When the water table dropped, the length of flood-ing season became shorter and more organic matter in the soil profile suffered from 20
BGD
5, 271–296, 2008Modeling carbon dynamics in Russian
forests
J. Kurbatova et al.
Title Page
Abstract Introduction
Conclusions References
Tables Figures
◭ ◮
◭ ◮
Back Close
Full Screen / Esc
Printer-friendly Version
Interactive Discussion
1 Introduction
Boreal forests contain about 50% of the total carbon stored in vegetation and soils in the world (Dixon et al., 1994). The majority of boreal forests are distributed in Russia (600 million ha), Europe (300 million ha) and North America (500 million ha) (Schulze et al., 1999). Although relatively simple in their vegetation composition and structure, 5
boreal forests play an important role in the global cycles of carbon (C), water and nutrients as well as the climate system. A number of global C balance studies have suggested that there is very likely a large C sink in the northern Hemisphere, but its spatial patterns and temporal dynamics remain uncertain (Schimel et al., 2001; Fan et al., 1998; Myneni et al., 2001). Multiple biological and abiotic factors, including climate 10
variation, land use change, and frequent natural disturbance (e.g. fire, insect outbreak), could significantly affect the carbon dioxide (CO2) fluxes and C storage in the boreal
forest regions (Shvidenko and Nilsson, 2002; Jarvis and Linder, 2000; Kobak et al., 1996). The existing estimates of net primary production for boreal forests vary widely (Melillo et al., 1993; Schulze et al., 1999; Jarvis et al., 2001; Jarvis and Linder, 2000). 15
To better quantify the role of boreal forests in the global carbon cycle, the interna-tional research communities recently made great efforts establishing a net work of CO2
eddy flux towers across boreal forests in Northern Eurasia through programs as Asi-aFlux, EuroFlux, and ChinaFlux (Schulze et al., 1999; Hollinger et al., 1998; Roeser et al., 2002; Lloyd et al., 2002; Hamada et al., 2004; Ohta et al., 2001). The eddy 20
flux tower network has produced and will continuously produce rich data sets of net ecosystem exchange of CO2 (NEE) between forests and the atmosphere at the tower sites. NEE is defined as the difference between gross primary production (GPP) and ecosystem respiration (Re) consisting of the plant autotrophic respiration and the soil
microbial heterotrophic respiration. Preliminary analyses with the observed NEE flux 25
data have been conducted and demonstrated interesting but complex patterns on the seasonal dynamics and inter-annual variations of the NEE fluxes (Falge et al., 2002).
BGD
5, 271–296, 2008Modeling carbon dynamics in Russian
forests
J. Kurbatova et al.
Title Page
Abstract Introduction
Conclusions References
Tables Figures
◭ ◮
◭ ◮
Back Close
Full Screen / Esc
Printer-friendly Version
Interactive Discussion
EGU is regulated by a series of primary drivers including climate, soil, hydrology, vegetation,
and management practices. Any single change in the primary drivers could simultane-ously alter several of the forest environmental factors such as radiation, temperature, soil moisture, soil redox potential, and nutrient substrates dynamics; and the altered environmental factors could collectively and simultaneously affect the plant photosyn-5
thesis and/or the ecosystem respiration (Li, 2007). Sometimes, the interactions be-tween the changes in primary drivers and the forest responses are so complex that it is hard to reveal the mechanisms controlling the forest C dynamics solely relying on the observed NEE fluxes. Process-based models have been developed to meet the gap. During the past decade a number of models were developed by integrating 10
the fundamental processes that governing forest growth, litter incorporation, and soil organic matter (SOM) turnover. Driven by climate, forest type, soil properties, man-agement practices and other relevant input parameters, the models can simulate forest production as well as C and N cycles in the ecosystems. Among the modeling ef-forts, the Forest-DNDC model developed by Li and his colleagues (Li et al., 2000) has 15
been tested for greenhouse gas studies with encouraging results (Stange et al., 2000; Butterbach-Bahl et al., 2004; Kiese et al., 2004; Cui et al., 2005; Kesik et al., 2005; Miehle et al., 2006) . In this study, we applied Forest-DNDC for understanding the NEE fluxes observed at two adjacent forest ecosystems located at the southern boundary of European taiga in Russia. The two forests shared similar composition though differing 20
in soil and hydrological conditions. The multi-year observation data indicated that one of the forests was continuously a sink of atmospheric CO2 while the other a source.
By tracking the various C fluxes in the two forest stands with the modeling tool, we tried explaining why the two forests functioned differently regarding their contributions to atmospheric C.
BGD
5, 271–296, 2008Modeling carbon dynamics in Russian
forests
J. Kurbatova et al.
Title Page
Abstract Introduction
Conclusions References
Tables Figures
◭ ◮
◭ ◮
Back Close
Full Screen / Esc
Printer-friendly Version
Interactive Discussion
2 Description of study sites
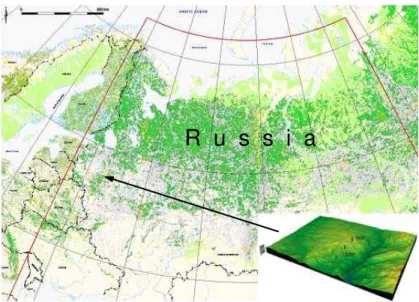
Net ecosystem exchange of carbon (NEE) was measured with eddy covariance tech-nique at two adjacent forested sites in the Central Forest Biosphere Reserve (56◦27′N, 32◦55′E) at Fyodorovskoe in Tver, Russia from 1999–2004 (Fig. 1). The reserve was established in 1931 possessing an area of 24 447 ha with an elevation of 230–270 m. 5
The forests have been being reserved without any commercial disturbance since the 1960s. The territory of the reserve is far from any industrial or residential areas with little air pollution affecting the forest growth. The two measured sites, the wet and dry spruce forests, are about 2 km apart from each other sharing similar climatic condi-tions with average annual temperature 3.9◦C and precipitation 711 mm for the 1990s 10
(Milyukova et al., 2002).
The wet spruce forest (WSF) site is an old (150 years) spruce forest dominated by spruce (Picea abies, 86%) and birch (Betula pubescens, 14%). The undergrowth is dominated byVaccinium spp. andSphaghumspp. The above-ground woody biomass is approximately 53 tC ha−1(Milyukova et al., 2002). The measurement tower is located 15
in a shallow depression with a heterogeneous territory. The stand has a 60 cm Sphag-num peat layer with the tree roots throughout the whole profile. The soil C content in the peat layer is about 197 ton C ha−1 (Vygodskaya et al., 2002). The forest is character-ized by poor soil aeration, low pH (3.5–3.8) and low nitrogen content (0.5–9.9 kg ha−1). The water table is seasonally close or above the soil surface usually in spring. The 20
dry spruce forest (DSF) site is an old (80–150 years) spruce forest withPicea abies (53%),Betula pubescens(5%),Populus tremula(6%),Ulmus glabra(6.4%),Acer plan-tanoides(18%) and others growing on a well-drained slope. The organic layer is less than 5 cm. The water table is usually at a depth of 1.5 m (Vygodskaya et al., 2004a, 2004b).
BGD
5, 271–296, 2008Modeling carbon dynamics in Russian
forests
J. Kurbatova et al.
Title Page
Abstract Introduction
Conclusions References
Tables Figures
◭ ◮
◭ ◮
Back Close
Full Screen / Esc
Printer-friendly Version
Interactive Discussion
EGU
3 Measurement of NEE fluxes
The eddy covariance system employed at the experimental sites was similar to that used in the Euroflux project (Aubinet et al., 2000). Briefly, a three-axis sonic anemome-ter with an omni directional head (Solent R3, Gill Instruments, Lymington, UK) was installed in 29 m height atop aluminum tower. The instrument provides high frequency 5
measurements (20 Hz) of the wind speed and the air temperature. For measurements of CO2 and water vapor concentration, air was drawn from an inlet atop of the tower through a 1/8′′ inner diameter BEV-A-LINE tubing to a closed-path infrared gas ana-lyzer (IRGA; LI-COR 6262, Lincoln, NE USA) located close to the bottom of the tower in an insulated wooden shelter. The suction pump was placed in front of the analyzer 10
gas-inlet to ensure the air to be pushed through the instrument with a flow rate of ap-proximately 4-5 l min−1. A pressure transducer (PTP101B, Vaisala, Helsinki, Finland) in the reference cell provided the necessary information to correct the measurements for variations associated with pressure fluctuations induced by the pump. The analyzer was run in absolute mode with CO2and water-free air circulating in the reference cell,
15
using a combination of magnesium perchlorate and soda-lime. Calibration of the in-strument was checked regularly once a week using air of known CO2(pressure bottle)
and H2O (dew-point generator, LI 610, LI-COR, Lincoln, NE USA) concentrations.
Out-put from the sonic anemometer and infrared gas analyzer were read at 20 Hz through RS-232 ports and stored into computers for subsequent analysis.
20
Ambient CO2concentrations at heights of 0.20, 1.0, 2.0, 5.0, 11.0, 15.6, 25.0, 27.6 m
were recorded with a system consisting of a LiCor nondispersive infrared gas ana-lyzer (Li-Cor 6251, LI-COR, Lincoln, NE USA), pump (KNF, Neurberger, Germany), switching manifold, BEV-A-Line tubing and datalogger (Campbell, model CR23X). Air was drawn through the tubes at a rate of 7 l min−1, with each height being samples 25
BGD
5, 271–296, 2008Modeling carbon dynamics in Russian
forests
J. Kurbatova et al.
Title Page
Abstract Introduction
Conclusions References
Tables Figures
◭ ◮
◭ ◮
Back Close
Full Screen / Esc
Printer-friendly Version
Interactive Discussion
flux density (model LI-190SA, Lincoln, NE USA), humidity and temperature (model HMP35D, Vaisala, Helsinki, Finland), air pressure (model PTB101B, Vaisala, Helsinki, Finland), wind velocity (model A100R, Vector Instruments, UK), total downward and upward radiation (LXG055), and shortwave downward and upward radiation (CM14, Kipp and Zonen, Delft, Holland). Precipitation was collected under the canopy on the 5
height of 1 m above ground and was measured by a tipping bucket rain gauge (model 52202, R.M. Young Company, Traverse City, USA).
Five soil heat flux plates (Rimco HFP-CN3, McVan Instruments, Melbourne, Aus-tralia) installed at a depth 4–5 cm were used to obtain an average soil heat flux in the neighborhood of the tower. Soil temperature was measured by sensors PT 100 at two 10
profiles at depths of 5, 15, 50 and 100 cm and then averaged for every depth. All mete-orological data were collected every 10 s, and 10 min averages or sums (precipitation only) were stored in the datalogger (Dl3000, Delta-T, Burwell, UK). For comparison with half-hourly eddy flux data, 30 min averages of the environmental data were sub-sequently calculated.
15
Eddy tower measurements were conducted at WSF and DSF for six years from 1999–2004. A complete dataset of daily NEE fluxes measured at the WSF site were achieved for the entire measurement time span. The multi-year average annual NEE flux for the WSF site was about 2000 kg C ha−1per year. However, the observed data at the DSF site were not complete due to malfunctions of the instruments at the site. 20
The continuous measurements at DSF only covered a time period from 27 July 2002 to 15 May 2003. Based on the limited measurements, an average annual NEE flux was estimated as−1440 kg C/ha for DSF (Van der Molen et al., 20071). The observations indicated that the two adjacent forests, WSF and DSF, acted as a source and a sink,
1
BGD
5, 271–296, 2008Modeling carbon dynamics in Russian
forests
J. Kurbatova et al.
Title Page
Abstract Introduction
Conclusions References
Tables Figures
◭ ◮
◭ ◮
Back Close
Full Screen / Esc
Printer-friendly Version
Interactive Discussion
EGU respectively, of atmospheric CO2 (Van der Molen et al., 2007
1
). Water table depths were measured at WSF and DSF in 2004.
4 Validations of Forest-DNDC for spruce forests
Forest-DNDC is a generic forest biogeochemical model. The model was developed by integrating two existing models, an upland forest model PnET-N-DNDC (Li et al., 5
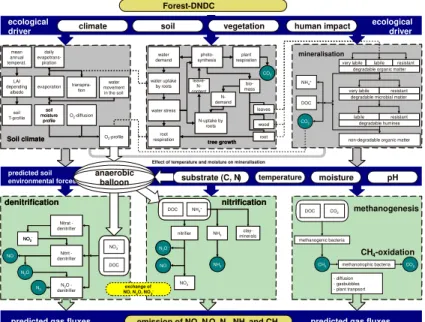
2000; Stange et al., 2000) and a wetland forest model Wetland-DNDC (Zhang et al., 2002; Li et al., 2004; Cui et al., 2005). Equipped with the upland and wetland fea-tures, Forest-DNDC is capable of simulating both aerobic and anaerobic processes at landscape scale. The structure of Forest-DNDC is shown in Fig. 2. Forest-DNDC consists of two components. The first component consisting of the soil climate, plant 10
growth and decomposition sub-models converts the primary drivers (e.g. climate, soil properties, vegetation and anthropogenic activity) to soil environmental factors (e.g. temperature, moisture, pH, Eh and substrate concentration gradients). The second component consisting of the nitrification, denitrification and fermentation sub-models predicts transformations of C and N driven by the soil environmental factors. The six 15
interacting sub-models form a computable framework to simulate the forest growth and soil biogeochemical processes including SOM turnover and emissions of CO2, nitrous
oxide (N2O), nitric oxide (NO), dinitrogen (N2) and methane (CH4). The modeled NEE flux is the net sum of the simulated photosynthesis (i.e. gross primary production), plant autotrophic respiration and soil microbial heterotrophic respiration. If the simu-20
lated ecosystem is an upland forest, a one-dimension hydrological routine will be ap-plied to track the vertical movement of water in the soil profile (Zhang et al., 2002). The soil water flow and moisture will be modeled based on precipitation, evapotranspiration and soil texture. If the simulated ecosystem is a wetland forest, the model will require daily ground water table depth (WT) as an input parameter to define the saturated and 25
BGD
5, 271–296, 2008Modeling carbon dynamics in Russian
forests
J. Kurbatova et al.
Title Page
Abstract Introduction
Conclusions References
Tables Figures
◭ ◮
◭ ◮
Back Close
Full Screen / Esc
Printer-friendly Version
Interactive Discussion
with empirical equations developed with historical WT data, and (3) predicted WT with spatial distribution hydrological models based on the watershed information (e.g. to-pography, climate, soil and vegetation). An interface has been built in Forest-DNDC to allow users to select one of the options to define the WT fluctuation.
To test the applicability of Forest-DNDC for spruce forests in temperate or boreal 5
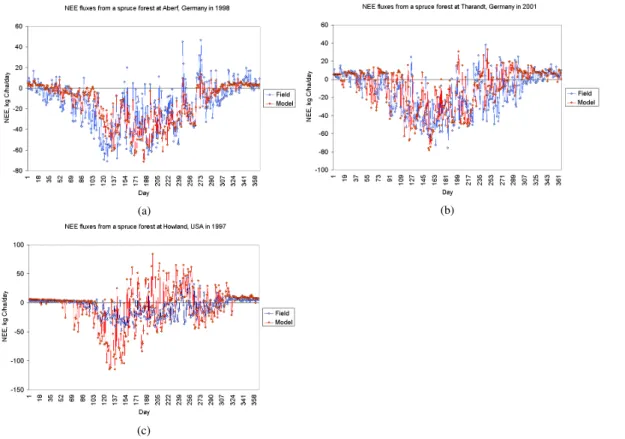
areas, we applied the model for two upland spruce forests in Germany and one in the U.S. where NEE fluxes were measured in 1998, 2001 and 1997, respectively. The two German forests were 20- and 50-years old spruce plantations located at Aberf and Tharandt, respectively (from EUROFLUX database athttp://carbodat.jrc.it/data arch f.
html). The U.S. forest was a natural forest (140-years old) dominated by spruce but 10
also contained hemlock and other conifers in the Howland Forest in Main (Hollinger et al., 1999; Xiao et al., 2005). Forest-DNDC was run for the three spruce forests to simulate their daily photosynthesis and ecosystem respiration rates, which were further converted to NEE fluxes. The physiological and phenology parameters of spruce and other relevant tree species utilized in the simulations were originally adopted from Aber 15
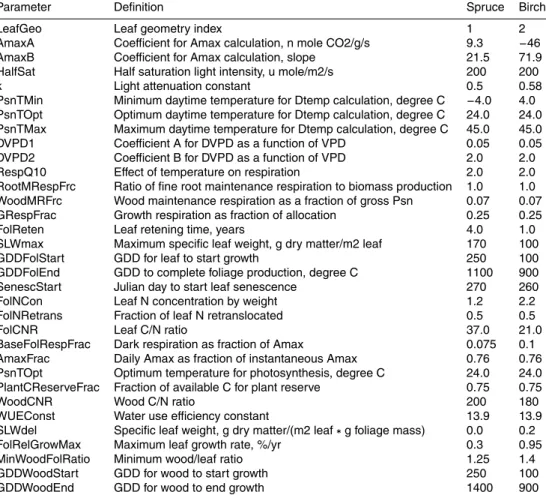
and Federer (1992) but slightly modified based on calibration tests against the three spruce forests in Germany and the U.S. The modified parameters included minimum photosynthesis temperature and wood respiration fraction. All the forest parameters adopted in Forest-DNDC for the study are listed in Table 1. Figure 3 shows the modeled NEE fluxes in comparison with observations for the three spruce forests in Germany 20
and the U.S.
Equipped with the calibrated forest parameters, Forest-DNDC was applied for the two Russian spruce forests, WSF and DSF. The daily weather data of 1999–2004 uti-lized for the 6-year simulations were obtained from the local climatic station at Fyodor-ovskoe. The forest structure was set to be a 150-years old spruce as the upper-story 25
BGD
5, 271–296, 2008Modeling carbon dynamics in Russian
forests
J. Kurbatova et al.
Title Page
Abstract Introduction
Conclusions References
Tables Figures
◭ ◮
◭ ◮
Back Close
Full Screen / Esc
Printer-friendly Version
Interactive Discussion
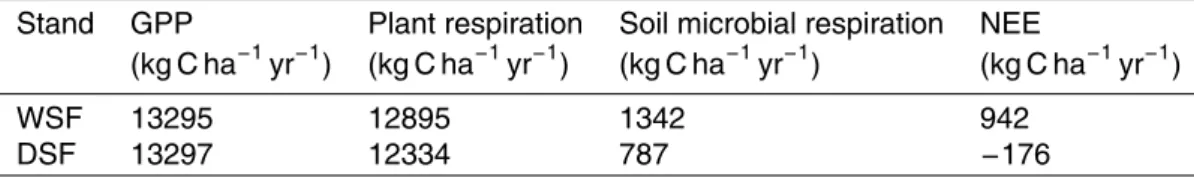
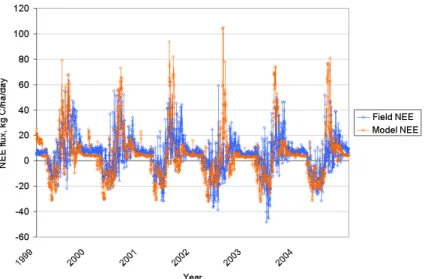
EGU annual fluxes of photosynthesis, plant autotrophic respiration, soil heterotrophic
respi-ration and NEE were produced for WSF and DSF for 1999–2004. The modeled daily and annual NEE fluxes were compared with the observed NEE fluxes for the WSF site. The comparison showed that the patterns and magnitudes of the modeled daily NEE fluxes were in agreement with that of the measured NEE fluxes (Fig. 4). The 5
modeled multi-year average annual NEE fluxes were 1800 and −2200 kg C ha−1yr−1 for WSF and DSF, respectively, which are comparable with the observations (2000 and −1440 kg C ha−1yr−1 for WSF and DSF, respectively) reported by van der Molen et al. (2007)1 (Table 2). In agreement with the observations, the modeled results in-dicated that WSF was a weak source while DSF a weak sink of atmospheric CO2.
10
The modeled data further showed that the forest photosynthesis rates or the plant au-totrophic respiration rates between WSF and DSF were close to each other but the soil heterotrophic respiration rates differed between the two forests (Table 3). The results implied that the soil processes, especially the decomposition process, at the WSF site could play a key role in switching the wetland ecosystem from a sink to a source of 15
atmospheric CO2.
5 Sensitivity analysis
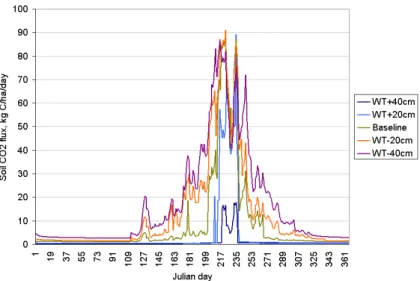
To test the hypothesis that the decomposition processes in the WSF soil could switch the ecosystem from a sink to a source of atmospheric C, we re-run Forest-DNDC for the WSF case but with varied soil hydrological scenarios. With the 2004-observed 20
daily water table (WT) depth as baseline scenario (WT0), we systematically elevated the daily WT depths by 40 and 20 cm, and also decreased the daily WT depths by 40 and 20 cm. Thus we created four alternative scenarios, WT+40, WT+20, WT−20 and WT−40, respectively. Forest-DNDC was run for WSF with the baseline and alterna-tive WT scenarios for year 2004. Results from the sensitivity test runs indicated that 25
BGD
5, 271–296, 2008Modeling carbon dynamics in Russian
forests
J. Kurbatova et al.
Title Page
Abstract Introduction
Conclusions References
Tables Figures
◭ ◮
◭ ◮
Back Close
Full Screen / Esc
Printer-friendly Version
Interactive Discussion
(Fig. 5), (2) the annual soil heterotrophic respiration rate drastically increased from 315 to 6160 kg C/ha (Fig. 6); and (3) the annual NEE flux increased from −1820 to 3820 kg C/ha (Fig. 7). The results suggested that variation in WT dynamics could sig-nificantly alter C balance in the wetland ecosystems by affecting decomposition rate of the organic matter accumulated in the soil profile.
5
Forest-DNDC simulates not only CO2 fluxes but also methane (CH4) and nitrous
oxide (N2O) emissions from wetland ecosystems (Li, 2007; Li et al., 2000) that enables
us to assess the net greenhouse effect of the changes in climate or management. In this sensitivity test, the changes in the WT scenarios from WT+40 to WT+20, WT0, WT−20 and WT−40 increased N2O emissions from 0.08 to 0.45, 1.99, 3.60
10
and 13.78 kg N ha−1yr−1, decreased CH
4 emissions from 697 to 563, 64, 24 and
0 kg C ha−1yr−1, and increased NEE fluxes (i.e. net CO
2fluxes) from−1820 to−770,
870, 2540 and 3820 kg C ha−1yr−1, respectively. Since the three greenhouse gases have different warming potentials based on IPCC (1996), the global warming potential (GWP) of each scenario can be calculated as follows:
15
GWPi =CO2i +N2Oi×310+CH4i×21;
with CO2i =Ci×(44/12)
20
N2Oi =Ni×(44/28)
CH4i =Ci×(16/12)
where GWPi (kg CO2 equivalent ha− 1
yr−1) is the GWP induced by scenario i; 25
CO2i, N2Oi and CH4i are CO2 flux (kg CO2ha− 1
yr−1), N
2O flux (kg N2O ha− 1
yr−1) and CH4flux (kg CH4ha−
1
yr−1), and C
i and Ni are fluxes in carbon and nitrogen units
BGD
5, 271–296, 2008Modeling carbon dynamics in Russian
forests
J. Kurbatova et al.
Title Page
Abstract Introduction
Conclusions References
Tables Figures
◭ ◮
◭ ◮
Back Close
Full Screen / Esc
Printer-friendly Version
Interactive Discussion
EGU The calculated GWP values are 12 880, 13 150, 5 930, 11 740 and 20 720 kg CO2
equivalent ha−1yr−1 for the WT
+40, WT+20, WT0, WT−20 and WT−40 scenarios, respectively. The results indicated that water table variation in wetland ecosystems could simultaneously alter emissions of all the three greenhouse gases (i.e. CO2, N2O
and CH4) that will draw an impact on global warming more complex than only counting 5
the C balance.
6 Discussions
The C loss from wetland ecosystems due to climate change has long been discussed by the research community although case studies on the hypothesis are still spare. The difficulties in the studies are related to collecting the field data under usually harsh 10
measurement conditions as well as interpreting the field data by integrating a large number of processes driven by climate, forest growth, soil hydrology and soil microbial activities. The six-year NEE measurements at a wetland spruce forest adjacent to a upland spruce forest in Russia provided an unique case for us to observe how the local climate, forest and soil conditions collectively affected the C dynamics between the two 15
forest ecosystems. By adopting a process-based model, Forest-DNDC, in the study, we reproduced the NEE fluxes from the two forests. The modeled results indicated that it was the soil factors (i.e., soil hydrology and soil C storage) that differentiated the two forest ecosystems regarding their contributions to atmospheric CO2. Russia possesses
a large area of forested wetlands, which mostly contain the thick organic layers. Under 20
the projected scenarios of global warming, these forest ecosystems may suffer dra-matic changes in their C storage as well as other trace gas emissions that could send a significant feedback to the global climate. The modeling approach demonstrated in the study could play a key role in interpreting, integrating and extrapolating the field observations that will eventually enhance our capacity for predicting the C exchange 25
BGD
5, 271–296, 2008Modeling carbon dynamics in Russian
forests
J. Kurbatova et al.
Title Page
Abstract Introduction
Conclusions References
Tables Figures
◭ ◮
◭ ◮
Back Close
Full Screen / Esc
Printer-friendly Version
Interactive Discussion
Acknowledgements. The study reported in this paper was supported by the US NASA through
Northern Eurasia Earth Science Partnership Initiative (NEESPI) project “Quantifying CO2fluxes
of boreal forests in northern Eurasia through integrated analyses of in-situ flux tower, remote sensing and biogeochemical modeling” (NASA #143192). We thank H. Sang for her decent work formatting the manuscript for submission. Thanks are also given to the Central Forest
5
Reserve at Fyodorovskoe in Tver, Russia for their assistances with the field investigations.
References
Aber, J. D. and Federer, C. A.: A generalized, lumped-parameter model of photosynthesis, evapotranspiration and net primary production in temperate and boreal forest ecosystems, Oecologia, 92, 463–474, 1992.
10
Aubinet, M., Grelle, A., Ibrom, A., Rannik, U., Moncrieff, J., Foken, T., Kowalski, A. S., Martin,
P. H., Berbigier, P., Bernhofer, C., Clement, R., Elbers, J., Granier, A., Grunwald, T., Morgen-stern, K., Pilegaard, K., Rebmann, C., Snijders, W., Valentini, R., and Vesala, T.: Estimates of the annual net carbon and water exchange of forests: The euroflux methodology, Adv. Ecol. Res., 30, 113–175, 2000.
15
Butterbach-Bahl, K., Kesik, M., Miehle, P., Papen, H., and Li, C.: Quantifying the regional source strength of n-trace gases across agricultural and forest ecosystems with process based models, Plant Soil, 260, 311–329, 2004.
Cui, J., Li, C., Sun, G., and Trettin, C.: Linkage of mike she to wetland-dndc for carbon budget-ing and anaerobic biogeochemistry simulatio, Biogeochemistry, 72, 147–167, 2005.
20
Dixon, R. K., Brown, S., Houghton, R., Solomon, S. C., Trexler, M. C., and Wisniewski, J.: Carbon pools and flux of global forest ecosystems, Science, 263, 185–190, 1994.
Falge, E., Baldocchi, D., Tenhunen, J., Aubinet, M., Bakwin, P., Berbigier, P., Bernhofer, C., Burba, G., Clement, R., Davis, K. J., Elbers, J. A., Goldstein, A. H., Grelle, A., Granier, A., Guomundsson, J., Hollinger, D., Kowalski, A. S., Katul, G., Law, B. E., Malhi, Y., Meyers, T.,
25
BGD
5, 271–296, 2008Modeling carbon dynamics in Russian
forests
J. Kurbatova et al.
Title Page
Abstract Introduction
Conclusions References
Tables Figures
◭ ◮
◭ ◮
Back Close
Full Screen / Esc
Printer-friendly Version
Interactive Discussion
EGU
Fan, S., Gloor, M., Mahlman, J., Pacala, S., Sarmiento, J., Takahashi, T., and Tans, P.: A large terrestrial carbon sink in north america implied by atmospheric and oceanic carbon dioxide data and models, Science, 282, 442–446, 1998.
Hamada, S., Ohta, T., Hiyama, T., Kuwada, T., Takahashi, A., and Maximov, T. C.: Hydrometeo-rological behaviour of pine and larch forests in eastern siberia, Hydrol. Process., 18, 23–39,
5
2004.
Hollinger, D. Y., Kelliher, F. M., Schulze, E. D., Bauer, G., Arneth, A., Byers, J. N., Hunt, J. E., McSeveny, T. M., Kobak, K. I., Milukova, I., Sogatchev, A., Tatarinov, F., Varlargin, A., Ziegler, W., and Vygodskaya, N. N.: Forest-atmosphere carbon dioxide exchange in eastern siberia, Agr. Forest Meteorol., 90, 291–306, 1998.
10
Hollinger, D. Y., Goltz, S. M., Davidson, E. A., Lee, J. T., Tu, K., and Valentine, H. T.: Sea-sonal patterns and environmental control of carbon dioxide and water vapour exchange in an ecotonal boreal forest, Glob. Change Biol., 5, 891–902, 1999.
IPCC: Climate Change 1995: The Science of Climate Change: Intergovernmental Panel on Climate Change (IPCC) Cambridge University Press, Cambridge, United Kingdom, 1996.
15
Jarvis, P. and Linder, S.: Constraints to growth of boreal forests, Nature, 405, 904–905, 2000. Jarvis, P., Saugier, B., and Schulze, E. D.: Producitivity of boreal forests, in: Terrestrial global
productivity, edited by: Roy, J., Saugier, B., and Mooney, H. A., Academic Press Inc., San Diego, CA, 211–244, 2001.
Kesik, M., Ambus, P., Baritz, R., Bruggemann, N. B., Butterbach-Bahl, K., Damm, M., Duyzer,
20
J., Horvath, L., Kiese, R., Kitzler, B., Leip, A., Li, C., Pihlatie, M., Pilegaard, K., Seufert, G., Simpson, D., Skiba, U., Smiatek, G., Vesala, T., and Zechmeister-Boltenstern, S.: Inventories of n2o and no emissions from european forest soils, Biogeosciences, 2, 353–375, 2005, http://www.biogeosciences.net/2/353/2005/.
Kiese, R., Li, C., Hilbert, D., Papen, H., and Butterbach-Bahl, K.: Regional application of
PnET-25
N-DNDC model for estimating the N2O source strength of tropical rainforests in the wet
tropics of Australia, Global Change Biol., 11(1), 128–144, 2005.
Kobak, K. I., Turchinovich, I. Y., Kondrasheva, N. Y., Schulze, E. D., Schulze, W., Koch, H., and Vygodskaya, N. N.: Vulnerability and adaptation of the larch forest in eastern siberia to climate change, Water Air Soil Poll., 92, 119–127, 1996.
30
BGD
5, 271–296, 2008Modeling carbon dynamics in Russian
forests
J. Kurbatova et al.
Title Page
Abstract Introduction
Conclusions References
Tables Figures
◭ ◮
◭ ◮
Back Close
Full Screen / Esc
Printer-friendly Version
Interactive Discussion
Li, C., Cui, J., Sun, G., and Trettin, C. C.: Modeling impacts of management on carbon se-questration and trace gas emissions in forested wetland ecosystems, Environ. Manage., 33, 176–186, 2004.
Li, C.: Quantifying greenhouse gas emissions from soils: Scientific basis and modeling ap-proach, Soil Sci. Plant Nutr., 53, 344–352, 2007.
5
Lloyd, J., Shibistova, O., Zolotoukhine, D., Kolle, O., Arneth, A., Wirth, C., Styles, J. M., Tchebakova, N., and Schulze, E. D.: Seasonal and annual variations in the photosynthetic productivity and carbon balance of a central siberian pine forest, Tellus B, 54B, 590–610, 2002.
Melillo, J. M., Mcguire, A. D., Kicklighter, D. W., Moore, B., Vorosmarty, C. J., and Schloss, A. L.:
10
Global climate-change and terrestrial net primary production, Nature, 363, 234–240, 1993. Miehle, P., Livesley, S. J., Feikema, P. M., Li, C., and Arndt, S. K.: Assessing productivity and
carbon sequestration capacity of eucalyptus globulus plantations using the process model forest-dndc: Calibration and validation, Ecol. Model., 192, 83–94, 2006.
Milyukova, I. M., Kolle, O., Varlagin, A. V., Vygodskaya, N. N., Schulze, E. D., and Lloyd, J.:
15
Carbon balance of a southern taiga spruce stand in european russia, Tellus B, 54, 429–442, 2002.
Myneni, R. B., Dong, J., Tucker, C. J., Kaufmann, R. K., Kauppi, P. E., Liski, J., Zhou, L., Alexeyev, V., and Hughes, M. K.: A large carbon sink in the woody biomass of northern forests, P. Natl. Acad. Sci. USA, 98, 14 784–14 789, 2001.
20
Ohta, T., Hiyama, T., Tanaka, H., Kuwada, T., Maximov, T. C., Ohata, T., and Fukushima, Y.: Seasonal variation in the energy and water exchanges above and below a larch forest in eastern siberia, Hydrol. Process., 15, 1459–1476, 2001.
Roeser, C., Montagnani, L., Schulze, E. D., Mollicone, D., Kolle, O., Meroni, M., Papale, D.,
Marchesini, L. B., Federici, S., and Valentini, R.: Net co2 exchange rates in three different
25
successional stages of the “Dark taiga” of central siberia, Tellus Series B, 54 B, 642–654, 2002.
Schimel, D. S., House, J. I., Hibbard, K. A., Bousquet, P., Ciais, P., Peylin, P., Braswell, B. H., Apps, M. J., Baker, D., Bondeau, A., Canadell, J., Churkina, G., Cramer, W., Denning, A. S., Field, C. B., Friedlingstein, P., Goodale, C., Heimann, M., Houghton, R. A., Melillo, J. M.,
30
Moore, B., Murdiyarso, D., Noble, I., Pacala, S. W., Prentice, I. C., Raupach, M. R., Rayner, P.
J., Scholes, R. J., Steffen, W. L., and Wirth, C.: Recent patterns and mechanisms of carbon
BGD
5, 271–296, 2008Modeling carbon dynamics in Russian
forests
J. Kurbatova et al.
Title Page
Abstract Introduction
Conclusions References
Tables Figures
◭ ◮
◭ ◮
Back Close
Full Screen / Esc
Printer-friendly Version
Interactive Discussion
EGU
Schulze, E. D., Lloyd, J., Kelliher, F. M., Wirth, C., Rebmann, C., Luhker, B., Mund, M., Knohl, A., Milyukova, I. M., Schulze, W., Ziegler, W., Varlagin, A. B., Sogachev, A. F., Valentini, R., Dore, S., Grigoriev, S., Kolle, O., Panfyorov, M. I., Tchebakova, N., and Vygodskaya, N. N.: Productivity of forests in the eurosiberian boreal region and their potential to act as a carbon sink - a synthesis, Glob. Change Biol., 5, 703–722, 1999.
5
Shvidenko, A. and Nilsson, S.: Dynamics of russian forests and the carbon budget in 1961– 1998: An assessment based on long-term forest inventory data, Climatic Change, 55, 5–37, 2002.
Stange, F., Butterbach-Bahl, K., Papen, H., Zechmeister-Boltenstern, S., Li, C. S., and Aber, J.: A process-oriented model of n2o and no emissions from forest soils 2. Sensitivity analysis
10
and validation, J. Geophys. Res.-Atmos., 105, 4385–4398, 2000.
Vygodskaya, N., Abrazhko, V., Varlagin, A., Kurbatova, Y., Sidorov, K., Milukova, I., Sogachev, A., Sogacheva, L., Shaposhnikov, E., Nepomnyashii, G., and Abrazhko, M.: Long-term dy-namics of soil moisture and drying of spruce trees in spruce forests of the southern taiga, Lesovedenie, 1, 3–22, 2004a.
15
Vygodskaya, N. N., Schulze, E. D., Tchebakova, N. M., Karpachevskii, L. O., Kozlov, D., Sidorov, K. N., Panfyorov, M. I., Abrazko, M. A., Shaposhnikov, E. S., Solnzeva, O. N., Mi-naeva, T. Y., Jeltuchin, A. S., Wirth, C., and Pugachevskii, A. V.: Climatic control of stand thinning in unmanaged spruce forests of the southern taiga in european russia, Tellus B, 54, 443–461, 2002.
20
Vygodskaya, N. N., Oltchev, A. V., Kurbatova, J. A., and Varlargin, A.: Gross primary production (gpp) of unmanaged over-mature spruce forests at southern european taiga: Eddy covari-ance measurements and modeling approach, in: Modeling forest production, scientific tools – data needs and sources, validation and application, edited by: Hasenauer, H. and Makela, A., 421–430, 2004b.
25
Xiao, X. M., Zhang, Q. Y., Hollinger, D., Aber, J., and Moore, B.: Modeling gross primary production of an evergreen needleleaf forest using modis and climate data, Ecol. Appl., 15, 954–969, 2005.
Zhang, Y., Li, C. S., Trettin, C. C., Li, H., and Sun, G.: An integrated model of soil, hydrology, and vegetation for carbon dynamics in wetland ecosystems, Global Biogeochem. Cy., 16(4),
30
BGD
5, 271–296, 2008Modeling carbon dynamics in Russian
forests
J. Kurbatova et al.
Title Page
Abstract Introduction
Conclusions References
Tables Figures
◭ ◮
◭ ◮
Back Close
Full Screen / Esc
Printer-friendly Version
Interactive Discussion
Table 1. Physiological and phenology parameters for spruce and birch forests adopted in
Forest-DNDC.
Parameter Definition Spruce Birch
LeafGeo Leaf geometry index 1 2
AmaxA Coefficient for Amax calculation, n mole CO2/g/s 9.3 −46
AmaxB Coefficient for Amax calculation, slope 21.5 71.9
HalfSat Half saturation light intensity, u mole/m2/s 200 200
k Light attenuation constant 0.5 0.58
PsnTMin Minimum daytime temperature for Dtemp calculation, degree C −4.0 4.0
PsnTOpt Optimum daytime temperature for Dtemp calculation, degree C 24.0 24.0
PsnTMax Maximum daytime temperature for Dtemp calculation, degree C 45.0 45.0
DVPD1 Coefficient A for DVPD as a function of VPD 0.05 0.05
DVPD2 Coefficient B for DVPD as a function of VPD 2.0 2.0
RespQ10 Effect of temperature on respiration 2.0 2.0
RootMRespFrc Ratio of fine root maintenance respiration to biomass production 1.0 1.0
WoodMRFrc Wood maintenance respiration as a fraction of gross Psn 0.07 0.07
GRespFrac Growth respiration as fraction of allocation 0.25 0.25
FolReten Leaf retening time, years 4.0 1.0
SLWmax Maximum specific leaf weight, g dry matter/m2 leaf 170 100
GDDFolStart GDD for leaf to start growth 250 100
GDDFolEnd GDD to complete foliage production, degree C 1100 900
SenescStart Julian day to start leaf senescence 270 260
FolNCon Leaf N concentration by weight 1.2 2.2
FolNRetrans Fraction of leaf N retranslocated 0.5 0.5
FolCNR Leaf C/N ratio 37.0 21.0
BaseFolRespFrac Dark respiration as fraction of Amax 0.075 0.1
AmaxFrac Daily Amax as fraction of instantaneous Amax 0.76 0.76
PsnTOpt Optimum temperature for photosynthesis, degree C 24.0 24.0
PlantCReserveFrac Fraction of available C for plant reserve 0.75 0.75
WoodCNR Wood C/N ratio 200 180
WUEConst Water use efficiency constant 13.9 13.9
SLWdel Specific leaf weight, g dry matter/(m2 leaf∗g foliage mass) 0.0 0.2
FolRelGrowMax Maximum leaf growth rate, %/yr 0.3 0.95
MinWoodFolRatio Minimum wood/leaf ratio 1.25 1.4
GDDWoodStart GDD for wood to start growth 250 100
BGD
5, 271–296, 2008Modeling carbon dynamics in Russian
forests
J. Kurbatova et al.
Title Page
Abstract Introduction
Conclusions References
Tables Figures
◭ ◮
◭ ◮
Back Close
Full Screen / Esc
Printer-friendly Version
Interactive Discussion
EGU
Table 2.Characteristics of five spruce forest stands used for validation of Forest-DNDC.
Stand Aberf, Tharandt, Howland, USA Fyodorovskoe, Fyodorovskoe,
Germany Germany Tver, Russia Tver, Russia
Location 56.6 51 45◦12′N 56 56
Age, yrs 20 50 140 150 150
Dominant Spruce Spruce Red spruce, Spruce, birch Spruce, birch
species plantation plantation hemlock
Soil Sandy clay Loam, Sandy loam, Sandy clay Sandy clay
loam, acid acid acid loam, acid loam, acid
Land type Upland Upland Upland Upland Wetland
Observed −5830 −5011 −2577 −1440 2000
multi-year average NEE,
kg C ha−1yr−1
Modeled −5470 −3570 −2280 −2200 1800
multi-year average NEE,
kg C ha−1
BGD
5, 271–296, 2008Modeling carbon dynamics in Russian
forests
J. Kurbatova et al.
Title Page
Abstract Introduction
Conclusions References
Tables Figures
◭ ◮
◭ ◮
Back Close
Full Screen / Esc
Printer-friendly Version
Interactive Discussion
Table 3.Modeled C fluxes for the wet spruce forest (WSF) and the dry spruce forest (DSF) in
Fyodorovskoe, Tver, Russia in 2004.
Stand GPP Plant respiration Soil microbial respiration NEE
(kg C ha−1
yr−1
) (kg C ha−1
yr−1
) (kg C ha−1
yr−1
) (kg C ha−1
yr−1
)
WSF 13295 12895 1342 942
BGD
5, 271–296, 2008Modeling carbon dynamics in Russian
forests
J. Kurbatova et al.
Title Page
Abstract Introduction
Conclusions References
Tables Figures
◭ ◮
◭ ◮
Back Close
Full Screen / Esc
Printer-friendly Version
Interactive Discussion
EGU
R u s s i a
BGD
5, 271–296, 2008Modeling carbon dynamics in Russian
forests
J. Kurbatova et al.
Title Page Abstract Introduction Conclusions References Tables Figures ◭ ◮ ◭ ◮ Back Close
Full Screen / Esc
Printer-friendly Version
Interactive Discussion
emission of NO, N2O, N2, NH3 and CH4
predicted gas fluxes predicted gas fluxes
NO
N2O
N2
emission of NO, N2O, N2, NH3 and CH4
predicted gas fluxes predicted gas fluxes
NO
N2O
N2
NO2 Nitrat -denitrifier
N2O -denitrifier
Nitrit -denitrifier
nitrifier
NO3 -NH3
clay-minerals
N2O
NO NH3
denitrification nitrification
NO3
-DOC
exchange of NO, N2O, NO3
-NH4+ DOC
NO2 Nitrat -denitrifier
N2O -denitrifier
Nitrit -denitrifier
nitrifier
NO3 -NH3
clay-minerals
N2O
NO NH3
denitrification nitrification
NO3
-DOC
exchange of NO, N2O, NO3
-NH4+ DOC soil
moisture profile
O2-profile O2-diffusion mean annual temperat. daily evapotrans-piration evaporation transpira-tion water movement in the soil
Soil climate soil T-profile
CO2
NH4+
DOC
non-degradable organic matter very labile labile resistant
degradable organic matter
degradable microbial matter very labile resistant
degradable humines labile resistant mineralisation soil moisture profile
O2-profile O2-diffusion mean annual temperat. daily evapotrans-piration evaporation transpira-tion water movement in the soil
Soil climate soil T-profile
CO2
NH4+
DOC
non-degradable organic matter very labile labile resistant
degradable organic matter
degradable microbial matter very labile resistant
degradable humines labile resistant mineralisation tree growth water demand root respiration water uptake by roots water stress photo-synthesis N-uptake by roots bio-mass leave- N-content plant respiration leaves wood root N-demand CO2 LAI depending albedo tree growth water demand root respiration water uptake by roots water stress photo-synthesis N-uptake by roots bio-mass leave- N-content plant respiration leaves wood root N-demand CO2 LAI depending albedo ecological
driver climate soil vegetation
ecological driver
human impact
Effect of temperature and moisture on mineralisation
predicted soil
environmental forces substrate (C, N) temperature moisture pH
anaerobic balloon
Forest-DNDC
methanogenesis
CH4-oxidation
CO2
methanotrophic bacteria
- diffusion - gasbubbles - plant tranpsort methanogenic bacteria
CH4
DOC CO2
BGD
5, 271–296, 2008Modeling carbon dynamics in Russian
forests
J. Kurbatova et al.
Title Page
Abstract Introduction
Conclusions References
Tables Figures
◭ ◮
◭ ◮
Back Close
Full Screen / Esc
Printer-friendly Version
Interactive Discussion
EGU
(a) (b)
(c)
Fig. 3.Comparison between observed and Forest-DNDC modeled NEE fluxes for three spruce
BGD
5, 271–296, 2008Modeling carbon dynamics in Russian
forests
J. Kurbatova et al.
Title Page
Abstract Introduction
Conclusions References
Tables Figures
◭ ◮
◭ ◮
Back Close
Full Screen / Esc
Printer-friendly Version
Interactive Discussion
Fig. 4. Comparison between observed and Forest-DNDC modeled NEE fluxes from a wet
BGD
5, 271–296, 2008Modeling carbon dynamics in Russian
forests
J. Kurbatova et al.
Title Page
Abstract Introduction
Conclusions References
Tables Figures
◭ ◮
◭ ◮
Back Close
Full Screen / Esc
Printer-friendly Version
Interactive Discussion
EGU
Fig. 5. Daily water table (WT) depths with different WT scenarios at the wetland spruce forest
BGD
5, 271–296, 2008Modeling carbon dynamics in Russian
forests
J. Kurbatova et al.
Title Page
Abstract Introduction
Conclusions References
Tables Figures
◭ ◮
◭ ◮
Back Close
Full Screen / Esc
Printer-friendly Version
Interactive Discussion
Fig. 6.Modeled daily soil CO2 fluxes from the wetland spruce forest (WSF) with different water
BGD
5, 271–296, 2008Modeling carbon dynamics in Russian
forests
J. Kurbatova et al.
Title Page
Abstract Introduction
Conclusions References
Tables Figures
◭ ◮
◭ ◮
Back Close
Full Screen / Esc
Printer-friendly Version
Interactive Discussion
EGU
Fig. 7. Modeled annual GPP, plant autotrophic respiration, soil heterotrophic respiration and
NEE fluxes for the wetland spruce forest (WSF) with different water table scenarios in