www.nat-hazards-earth-syst-sci.net/10/717/2010/ © Author(s) 2010. This work is distributed under the Creative Commons Attribution 3.0 License.
and Earth
System Sciences
Brief communication
“Calabria daily rainfall from 1970 to 2006”
S. Federico1,2, L. Pasqualoni2, E. Avolio1,2, and C. Bellecci3,2
1Institute of Atmospheric Sciences and Climate – Italian National Research Council (ISAC-CNR), U. O. S. of Lamezia Terme, Italy
2Engineering Department, University of Rome “Tor Vergata”, Italy 3CRATI Scrl, Rende, Italy
Received: 16 November 2009 – Revised: 27 March 2010 – Accepted: 31 March 2010 – Published: 13 April 2010
Abstract. This brief communication introduces a new quality-controlled precipitation database for Calabria, shows the precipitation trend for the period considered, and corre-lates daily rainfall with some common teleconnection pat-terns. The database consists of daily accumulated precipita-tion collected by 61 rain gauges from 1 January 1970 to 31 December 2006.
The 37-year trend in yearly rainfall shows a decrease of 4.7 mm/y, with a 17% reduction in the yearly mean value.
The correlation of the daily rainfall with large-scale pat-terns shows that the Mediterranean Oscillation Index (MOI a/c) is a useful predictor of daily precipitation over Calabria.
1 Introduction
The motivations of this brief note are to present a new pre-cipitation database for the Calabria peninsula (Fig. 1a, b), to show the precipitation trend for the period analyzed, and to correlate daily precipitation with large-scale patterns. These goals are of interest to the general community because the literature on precipitation over the central Mediterranean is still rather poor and needs to be improved.
Contrary to the tendency in many areas of the world (Day et al., 1997), the Mediterranean Basin shows decreasing pre-cipitation in the last 50 years, as reported in several stud-ies (Xoplaki et al., 2000; Paz et al., 1998; Kostopoulou and Jones, 2005; Romero et al., 1998; Piervitali et al., 1998), with a reduction of 10 to 20% in the central-western Mediter-ranean Basin. Those studies considered only one or two rain-gauges in Calabria and focused their attention on different
ar-Correspondence to:S. Federico ([email protected])
eas. This paper presents the precipitation trend over Calabria from 1970 to 2006 and discusses the result in the framework of previous findings, using a much greater number of rain gauges.
Variations in daily rainfall are often related to telecon-nection patterns, expressing the global or regional circula-tions. The North Atlantic Oscillation (NAO) is well cor-related with climate conditions over Europe and over the Mediterranean (Wallace and Gutzler, 1981; Hurrel, 1985). The El Ni˜no Southern Oscillation (ENSO) is well corre-lated with North and Central Europe precipitation (Moron and Ward, 1998; van Loon and Madden, 1981). Conte et al. (1989) showed the importance of the Mediterranean Os-cillation Index (MOI a/c, Algiers-Cairo) to precipitation over Italy and North Africa. This index is derived from the seesaw oscillation of the mean annual geopotential height at 500 hPa between Algiers and Cairo. Based on this concept, a similar seesaw pattern between Gibraltar and Israel is considered be-tween the western and eastern Mediterranean (MOI i/g; Ku-tiel and Paz, 1998). Eastern Atlantic (EA) and Eastern At-lantic/West Russia (EA/WR) oscillations play an important role in the precipitation variability over the eastern Mediter-ranean (Krichak and Alpert, 2005).
In this short communication we correlate several telecon-nection indexes (ENSO, NAO, MOI, EA, EA/WR) with daily precipitation over Calabria to find useful predictor(s).
2 Data and methodology
Fig. 1.Panel(a)the regional rain gauge network; panel(b)Calabria region in the central Mediterranean; panel(c)the two sub-regions (see text).
gauges in the regional network is 127. Their positions are marked both by squares and filled circles in Fig. 1a.
All stations are equipped with a tipping-bucket rain gauge and have a sampling rate of 20 min. Daily accumulated rain-fall is used in this work.
A compromise was necessary between considering as many stations as possible and retaining a considerable amount of valid data for each station. The final decision was to keep all stations having at least 80% of data available from 1 January 1970 to 31 December 2006. This choice re-duces to 61 the number of suitable rain gauges (filled circles in Fig. 1a). The average of the minimum distance between rain gauges is 11 km, which can be assumed as a measure of the spatial resolution of our database.
The Regional Agency for Environmental Protection ap-plies a data quality control procedure to the measurements. This procedure is based on a check of the physical internal coherence and spatial inter-comparison of data. Because all stations have missing data, the gap-filling procedure and data quality control reported in Federico et al. (2009) was also applied. This methodology generates a new time series for each station (target station) by interpolating the records of the surrounding stations within a search radius of 50 km. The weight assigned to each station is the square of the ratio tween the precipitation correlation coefficient (computed be-tween the interpolating and target stations) and distance. This functional form gave better performance compared to others (for details see Federico et al., 2009). A missing record of the target station is substituted with the interpolated value. Only stations that share at least 1000 days of common pre-cipitation records with the target station are considered in the interpolation process, which uses all 127 rain gauges. Even if the data filling could smooth the precipitation field, we note
that the algorithm is designed to preserve gradients because: a) the weights take into account the correlation between the interpolated and interpolating stations; and b) the precipita-tion of the interpolating staprecipita-tion is scaled by the average ratio between the precipitation at the interpolated station and the precipitation at the interpolating station.
After the gap-filling procedure, there are no missing data for the 61 rain gauges for the whole period. The number of gaps filled for each station varies from 93 (0.7% of the 13 757 total data points) to 2511 (18% of the 13 757 total data points). Data filling over years varies from no gaps filled for 1970 to 3608 gaps filled for 1998 (16.2% of the 22 265 yearly total data).
The spatial distribution of the 61 rain gauges is rather ho-mogeneous and covers both mountains and lowlands. None of the rain gauges were relocated.
Fig. 2a. Annual precipitation over Calabria (average from 1970 to 2006). Contours from 600 mm to 1500 mm. Contour interval: 100 mm.
correlations were found. The monthly values of the NAO, EA, EA/WR, and Ni˜no indexes were downloaded from the National Oceanic and Atmospheric Administration (NOAA) Climate Prediction Center website (http://www.cpc.noaa. gov/data/teledoc/nao.shtml), and the MOI index monthly values were downloaded from the University of East Anglia website (http://www.cru.uea.ac.uk/cru/data/moi).
TheSpearman rank-order(or nonparametric) correlation coefficient (rs; Wilks, 1995) is used to measure the
associa-tion between the precipitaassocia-tion and large-scale patterns. The nonparametric correlation is chosen because it is both robust and resistant in a statistical sense. Moreover, to assess the significance of the correlation, it does not require that the original data must follow any particular statistical distribu-tion.
To evaluate the significance of thers value, a resampling
method with bootstrap is used (Wilks, 1995). The basic idea is to build up a collection of artificial data batches (10 000 in our case) of the same size of the actual data at hand, in a manner consistent with the null hypothesis (i.e., that the pre-cipitation and large-scale pattern index are uncorrelated), and then compute the Spearman correlation coefficient for each artificial batch. Taken together, these test statistics constitute an estimated null distribution against which to compare the test statistic computed from the original data.
Fig. 2b. Linear trend of the yearly rainfall over Calabria. A fifth-order polynomial fitting is also shown. Among polynomials from the first to seventh degree, the fifth order minimizes the sum of squared differences between the interpolating curve and the orig-inal time series.
3 Results
3.1 Precipitation trend
Before considering the correlation between daily rainfall and large-scale patterns, we introduce the precipitation field (an-nual mean) and trend for the 37 years considered.
The annual rainfall average from 1970 to 2006 is shown in Fig. 2a. The orographic signature is clear. From north to south there are maxima corresponding to the highest moun-tains of Calabria: Pollino (1400 mm), Sila (1200 mm), Serre (1500 mm) and Aspromonte (1400 mm).
There is a rainfall gradient from west to east. Minimum precipitation near the coastline is less than 600 mm east of Pollino and less than 700 mm east of Sila. These minima are a consequence of the shielding effect of the mountains be-cause Mediterranean storms usually impinge Calabria from west to east (Federico et al., 2008, 2009).
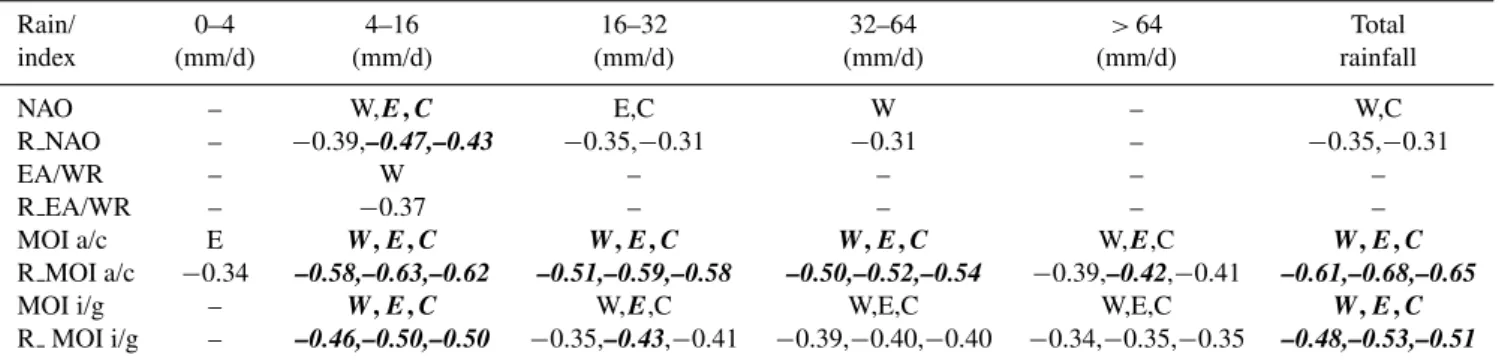
Table 1. Significant correlations (bold and italic: 99% level, plain text: 95% level) between the cold-season rainfall categories and the teleconnection indexes, for the two sub-regions of Calabria (W, E) and for the whole region (C). The value of the Spearman regression coefficient is also reported for each significant correlation (rows: R NAO, R EA/WR, R MOI a/c, R MOI i/g).
Rain/ 0–4 4–16 16–32 32–64 >64 Total
index (mm/d) (mm/d) (mm/d) (mm/d) (mm/d) rainfall
NAO – W,E,C E,C W – W,C
R NAO – −0.39,–0.47,–0.43 −0.35,−0.31 −0.31 – −0.35,−0.31
EA/WR – W – – – –
R EA/WR – −0.37 – – – –
MOI a/c E W,E,C W,E,C W,E,C W,E,C W,E,C
R MOI a/c −0.34 –0.58,–0.63,–0.62 –0.51,–0.59,–0.58 –0.50,–0.52,–0.54 −0.39,–0.42,−0.41 –0.61,–0.68,–0.65
MOI i/g – W,E,C W,E,C W,E,C W,E,C W,E,C
R MOI i/g – –0.46,–0.50,–0.50 −0.35,–0.43,−0.41 −0.39,−0.40,−0.40 −0.34,−0.35,−0.35 –0.48,–0.53,–0.51
The linear trend is in agreement with previous findings in the Mediterranean Basin (Xoplaki et al., 2000; Paz et al., 1998; Kostopoulou and Jones, 2005; Romero et al., 1998; Piervitali et al., 1998). Piervitali et al. (1998), in particular, divided their analysis of the Mediterranean Basin into three belts: northern (>42◦N), central (38◦N–42◦N), and
south-ern (<38◦N), and found a reduction in the yearly
precipita-tion amount of 13, 20, and 26%, respectively. Considering the difference in the years analyzed, our result compares rea-sonably well with previous findings.
The polynomial fitting is useful to illustrate changes in the precipitation regime within the 37-year period. It shows that the yearly precipitation increased from 1970 to 1975, de-creased from 1976 to 1988, and was then almost constant until 2004, when it started to increase again.
3.2 Correlation with large-scale patterns
This section shows the correlation between the daily precipi-tation and large-scale patterns. To study whether correlations are particularly important for selected pairs of precipitation-geographical area, in addition to the total daily precipitation and to the whole region, we define five rainfall intensities and two geographical sub-regions.
Rainfall intensities are defined as: light (0–4 mm/d); mod-erate (4–16 mm/d); modmod-erate-heavy (16–32 mm/d); heavy (32–64 mm/d); and severe (>64 mm/d). The usefulness of
the power of 2 thresholds, i.e., 2n
as indicated above, and its comparison with thresholds adopted in other studies is dis-cussed in Alpert et al. (2002). We remark that thresholds allow the evaluation of the contribution of different rainfall categories to the rainfall totals. Considering the daily rainfall over the whole region, the moderate category has the highest contribution (32%). The second-highest contribution is from the moderate-heavy category (28%). The third-highest con-tribution is from the heavy category, accounting for 21% of the total yearly rainfall. Severe rainfall follows (12%), while the remaining 7% is from the light category.
The daily precipitation was correlated with several tele-connection patterns both for the cold semester and for winter (DJF). The same behaviour was found for cold semester and for winter, which supports the robustness of the analysis. In the following discussion we consider the correlation with the cold semester.
The correlation was computed as follows. For each cate-gory and sub-region (including the total daily rainfall and the whole region), the daily precipitation is the sum of the daily rainfall recorded in that category by all rain gauges belong-ing to that sub-region. For example, if one day in sub-region W, 3 mm are recorded at one station, 5 mm at four other sta-tions, and 0 mm in the remaining stasta-tions, the daily precipi-tation is 3 mm for the light category, 20 mm for the moderate category, and 0 mm for the other categories. A monthly rain-fall value is then computed for each category/sub-region by adding all the daily precipitation in the category/sub-region. The cold semester rainfall is computed by adding monthly data from October to March. Finally, cold semester rainfall is transformed into a standardized anomaly (SA, Wilks, 1995) and correlated with the average of pattern indexes for cold semester for each category/sub-region. Results are shown in Table 1.
No significant correlations were found with pattern EA. The spatial correlation between the EA/WR index and precipitation over Europe was considered in Krichack and Alpert (2005). They found a significant relationship over wide areas of the eastern Atlantic and southeastern Mediter-ranean. The correlation was not significant for the central Mediterranean and our result confirms this for Calabria. Nev-ertheless, sub-region W shows a significant (95%) negative correlation for the moderate category.
absolute value of 0.5 and the regression is not very strong because the proportion of the variation of the predictand de-scribed by the linear regression never reaches 25%. Pre-cipitation in western Calabria is more correlated with the NAO compared to eastern Calabria. A negative NAO im-plies, among other things, an increase in cyclones that de-velop in the lee of the Alps (Serreze et al., 1997), and the W sub-region is more exposed to these storms. The corre-lation weakens with increasing precipitation thresholds be-cause values have a larger year-to-year variability and their scatter around the regression line is larger. On the opposite side, the light precipitation threshold exhibits a lot of noise, which explains the low correlation with all indexes.
The MOI a/c has a negative correlation with precipitation over Calabria. Total rainfall has significant (99%) correla-tions with MOI for all sub-regions. The same result is ob-tained for the moderate, moderate-heavy, heavy, and severe categories. For some pairs of category/sub-region the ab-solute value of the correlation coefficient is larger than 0.6, showing a rather strong correlation. Sub-region E is partic-ularly well correlated with the MOI a/c (99% for all cate-gories). This is expected because the position of the MOI a/c poles, Algiers and Cairo, takes well into account the devel-opment of African storms that are important for the precipi-tation over eastern Calabria.
The correlation with the MOI i/g is similar to the MOI a/c, however the strength of the correlation is lower. This is expected because the poles of the MOI a/c are closer to the target area compared to the MOI i/g.
4 Conclusions
This short communication introduces a new quality-controlled daily precipitation database for the Calabria peninsula, presents the precipitation trend from 1970 to 2006, and studies the correlation of daily rainfall with large-scale patterns. Its aim is to improve the literature on pre-cipitation over the Central Mediterranean. After applying a data quality control apt to retain the largest number of sta-tions while preserving a reliable dataset, 61 of the 127 rain gauges were selected. The database consists of daily accu-mulated rainfall from 1 January 1970 to 31 December 2006. Its spatial resolution (11 km) and distribution are enough to study the differences between western and eastern Calabria.
As reported in several studies, the Mediterranean precip-itation shows a decrease over the last 50 years (20% of the yearly total amount for the latitude of Calabria). This pa-per confirms this trend for the 37 years analyzed, because we found a 17% reduction of the yearly mean value (1006 mm). We correlated, using the Spearman rank correlation co-efficient, the daily rainfall of the cold semester and DJF with the atmospheric patterns ENSO, EA, EA/WR, NAO, and MOI (a/c, Algiers-Cairo and i/g, Israel-Gibraltar). The NAO shows several significant (95–99%) negative
corre-lations with precipitation over Calabria, especially for the moderate category, which accounts for the largest propor-tion of the rainfall. The MOI i/g is well correlated with pre-cipitation over Calabria for all categories, with the excep-tion of light. However, the best (negative) correlaexcep-tion was found with the MOI a/c index. In particular, all sub-regions show significant correlations (99%) of their total rainfall with the MOI a/c and all sub-regions show significant correlation (95–99%) for moderate, moderate-heavy, heavy, and severe precipitation categories with the MOI a/c. Eastern Calabria rainfall is well correlated with the MOI a/c (99% for all cat-egories with the exception of light).
A significant negative correlation between the MOI a/c in-dex and the precipitation in southern Italy and the southern Mediterranean has already been found (Conte et al., 1989; Piervitali and Colacino, 2003). Our study confirms this re-sult for Calabria using a different dataset and a much greater number of rain gauges.
Acknowledgements. This work was realized in the project “ALPI: ALlerta Precoce Incendi boschivi” funded by the Calabria Re-gional government. We are grateful to the Regional Agency for Envirnomental Protection for the database. We also thank Carlo Perrimezzi for his help in managing the database.
Edited by: A. Mugnai
Reviewed by: two anonymous referees
References
Alpert, P., Ben-Gai, T., Baharad, A., Benjamini, Y., Yekutieli, D., Colacino, M., Diodato, L., Ramis, C., Homar, V., Romero, R., Michaelides, S., Manes, A., and Shay-El, Y.: The paradoxical increase of Mediterranean extreme daily rainfall in spite of de-crease in total values, Geophys. Res. Lett., 29(11), 31-1/31-4, 2002.
Conte, M., Giuffrida, A., and Tedesco, S.: The Mediterranean Os-cillation, in: Impact on precipitation and hydrology in Italy Cli-mate Water, Publications of the Academy of Finland, Helsinki, 1989.
Day, A., Fung, I. Y., and Del Genio, A. D.: Surface observed global land precipitation variations during 1900–1988, J. Climate, 10, 2943–2962, 1997.
Federico, S., Avolio, E., Pasqualoni, L., and Bellecci, C.: Atmo-spheric patterns for heavy rain events in Calabria, Nat. Hazards Earth Syst. Sci., 8, 1173–1186, 2008,
http://www.nat-hazards-earth-syst-sci.net/8/1173/2008/. Federico, S., Avolio, E., Pasqualoni, L., De Leo, L., Sempreviva,
A. M., and Bellecci, C.: Preliminary results of a 30-year daily rainfall data base in southern Italy, Atmos. Res., 94(4), 641–651, doi:10.1016/j.atmosres.2009.03.008, 2009.
Hurrell, J. W.: Decadal trends in the North Atlantic Oscillation: Regional temperatures and precipitation, Science, 269, 676–679, 1995.
Krichak, S. O. and Alpert, P.: Decadal trends in the East Atlantic– West Russia pattern and Mediterranean precipitation, Int. J. Cli-matol., 25, 183–192, 2005.
Kutiel, H. and Paz, S.: Sea level pressure departures in the Mediter-ranean and their relationship with monthly rainfall conditions in Israel, Theor. Appl. Climatol., 60, 93–109, 1998.
Moron, V. and Ward, M. N.: ENSO teleconnections with climate variability in the European and African sector,Weather, 53, 287– 295, 1998.
Paz, S., Steinberger, E. H., and Kutiel, H.: Variations in rainfall patterns along the eastern Mediterranean coast, in: Proceed-ings of the 4th Greek Scientific Conference in Meteorology-Climatology-Atmospheric Physics, Athens, 22–25 September 1998.
Piervitali, E., Colacino, M., and Conte, M.: Rainfall over the central-western Mediterranean Basin in the period 1951–1995. Part I: Precipitation trends, Nuovo Cimento, C, 21, 331–344, 1998.
Piervitali, E. and Colacino, M.: Precipitation scenarios in the Central-western Mediterranean Basin, in: Mediterranean Cli-mate – variability and trends, edited by: Bolle, H. J., Springer-Verlag, 2003.
Romero, R., Guijarro, J. A., Ramis, C., and Alonso, S.: A 30-year (1964–1993) daily rainfall data base for the Spanish Mediter-ranean regions: first exploratory study, Int. J. Climatol., 18, 541– 560, 1998.
Serreze, M. C., Carse, F., and Barry, R. G.: Icelandic Low cyclone activity: Climatological features, linkages with the NAO, and relationships with recent changes in the Northern Hemisphere circulation, J. Climate, 10, 453–464, 1997.
van Loon, H. and Madden, R. A.: The Southern Oscillation. Part I. Global associations with pressure and temperature in northern winter, Mon. Weather Rev., 109, 1150–1162, 1981.
Wallace, J. and Gutzler, D.: Teleconnections in the geopoten-tial height field during the Northern Hemisphere winter, Mon. Weather Rev., 109, 784–812, 1981.
Wilks, D. S: Statistical Methods in the Atmospheric Sciences, Aca-demic Press, 520 pp., 2005.