Effects of the Parkinson’s Disease Drug Candidate
ZM241385
Zhiyun Wang, Pao-Lin Che, Jian Du, Barbara Ha, Kevin J. Yarema*
Department of Biomedical Engineering, The Johns Hopkins University, Baltimore, Maryland, United States of America
Abstract
Background:This study was inspired by coalescing evidence that magnetic therapy may be a viable treatment option for certain diseases. This premise is based on the ability of moderate strength fields (i.e., 0.1 to 1 Tesla) to alter the biophysical properties of lipid bilayers and in turn modulate cellular signaling pathways. In particular, previous results from our laboratory (Wanget al., BMC Genomics, 10, 356 (2009)) established that moderate strength static magnetic field (SMF) exposure altered cellular endpoints associated with neuronal function and differentiation. Building on this background, the current paper investigated SMF by focusing on the adenosine A2A receptor (A2AR) in the PC12 rat adrenal pheochromocytoma cell line that displays metabolic features of Parkinson’s disease (PD).
Methodology and Principal Findings: SMF reproduced several responses elicited by ZM241385, a selective A2AR antagonist, in PC12 cells including altered calcium flux, increased ATP levels, reduced cAMP levels, reduced nitric oxide production, reduced p44/42 MAPK phosphorylation, inhibited proliferation, and reduced iron uptake. SMF also counteracted several PD-relevant endpoints exacerbated by A2AR agonist CGS21680 in a manner similar to ZM241385; these include reduction of increased expression of A2AR, reversal of altered calcium efflux, dampening of increased adenosine production, reduction of enhanced proliferation and associated p44/42 MAPK phosphorylation, and inhibition of neurite outgrowth.
Conclusions and Significance:When measured against multiple endpoints, SMF elicited qualitatively similar responses as ZM241385, a PD drug candidate. Provided that thein vitroresults presented in this paper applyin vivo, SMF holds promise as an intriguing non-invasive approach to treat PD and potentially other neurological disorders.
Citation:Wang Z, Che P-L, Du J, Ha B, Yarema KJ (2010) Static Magnetic Field Exposure Reproduces Cellular Effects of the Parkinson’s Disease Drug Candidate ZM241385. PLoS ONE 5(11): e13883. doi:10.1371/journal.pone.0013883
Editor:Howard E. Gendelman, University of Nebraska, United States of America
ReceivedFebruary 20, 2010;AcceptedOctober 18, 2010;PublishedNovember 8, 2010
Copyright:ß2010 Wang et al. This is an open-access article distributed under the terms of the Creative Commons Attribution License, which permits unrestricted use, distribution, and reproduction in any medium, provided the original author and source are credited.
Funding:Funding for this project was provided by the Arnold and Mabel Beckman Foundation, the Whitaker Biomedical Institute (through the Department of Biomedical Engineering at the Johns Hopkins University) and from the National Institutes of Health (NIBIB, 5R01EB5692). The funders had no role in study design, data collection and analysis, decision to publish, or preparation of the manuscript.
Competing Interests:The authors have declared that no competing interests exist.
* E-mail: [email protected]
Introduction
Parkinson’s disease (PD) is an age-related disorder arising from the degeneration of dopaminergic nigrostriatal neurons of the basal ganglia resulting in dykinesia, tremor and rigidity. Current therapy – exemplified by the dopaminergic agent L-3,4-dihy-droxy-phenylalanine (L-DOPA) – is restricted to symptomatic relief because agents capable of reversing or even effectively inhibiting neuronal degeneration have not yet been found. Compounding these limitations, L-DOPA therapy tends to lose effectiveness over time, L-DOPA-induced dyskinesias are a common complication of chronic dopaminergic therapy, and metabolites of this compound are neurotoxic [1]. The search for alternate, non-dopaminergic therapies to overcome these draw-backs has positioned adenosine A2Areceptor (A2AR) antagonists as
an attractive option for improved treatment of PD [2,3]. Despite the favorable features of A2AR antagonists, their
pharmacological properties (e.g., poor oral availability and a lack of BBB permeability) constitute a barrier to clinical use.
Consequently, alternative therapies including electromagnetic (EM) field exposure have been explored for PD. These efforts date back at least two decades when reports that high-frequency deep brain stimulation (DBS) could ablate certain aspects of neurological movement disorders were published [4]. Building on DBS, EM treatment modalities that fully penetrate the brain non-invasively have been pursued. For example, time invariant (i.e., static) magnetic fields of 1160 to 2600 gauss (0.116 to 0.260 T, similar to the field strength used in the current study) were shown to mimic the effect of caffeine, a nonspecific adenosine receptor antagonist that has inhibitory effects on neurons [5] and Sandyk and coworkers reported that magnetic fields ameliorated PD symptoms [6]. Interest in exploiting EM treatments for brain disorders continues today, exemplified by recent reports that EM radiation can reverse plaque formation in a murine model of Alzheimer’s disease [7].
range where effects on biological molecules and physiological endpoints of potential therapeutic relevance have been unambig-uously established. In particular, the current report builds on a genomics analysis of human embryoid body derived (hEBD) cells exposed to 0.23–0.28 T static magnetic fields that engaged signaling pathways related to neural function, broadly establishing relevance to PD [8]. More specifically, two facets of the study by Wang and coauthors [8] suggested relevance of SMF to PD. First, SMF exposure over short time periods increased IL-6 levels but suppressed IL-6 production over several days; similar responses – if they occurin vivo– could promote beneficial A1R activity over
the short term [9,10] and ameliorate the high levels of IL-6 found in the brains of Parkinson’s patients over the longer term [11]. Second, software analysis of metabolic pathways showed that SMF impinged upon amino acid metabolism, suggesting that this stimulus could modulate aberrant amino acid metabolism associated with brain dysfunction.
In the current study, we investigated whether SMF could modulate PD-relevant endpoints in the PC12 rat adrenal pheochromocytoma cell line [12]. PC12 cells are widely used as an in vitro model to study PD [13,14] because they possess intracellular substrates for dopamine (DA) synthesis, metabolism and transport and abundantly express adenosine A2A receptors
(e.g., A2AR) implicated in PD [15–20]. Using this model, we
compared the effects of SMF with the A2AR-specific antagonist
ZM241385 on PD-relevant parameters and found that SMF elicited similar responses against several endpoints. These results raise the intriguing possibility that this non-invasive stimulus could function as a substitute for small molecule A2AR antagonists under
development as PD drugs.
Results
Exposure to SMF alters calcium flux in PC12 cells
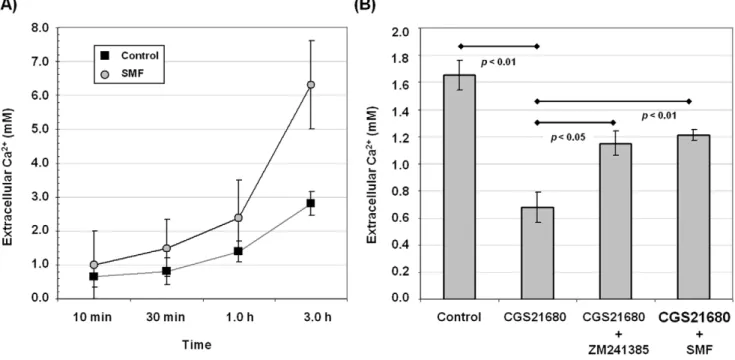
Altered calcium flux is a well established cellular hallmark of exposure to SMF [21]; the first objective of the current study was to verify that this endpoint – previously observed in lymphocytes, HepG2, U937, HeLa, COS7, and hEBD lines [8,21] – was affected by magnetic exposure in PC12 cells. As shown in Figure 1A, efflux of Ca2+
from SMF-treated cells, measured by the level of Ca2+
in the supernatant, diverged from untreated cells over a three hour period and, as described in our previous publication [8], reciprocal changes to intracellular Ca2+
levels occurred under these assay conditions (data not shown). A second objective was to verify that CGS21680, a selective adenosine A2A receptor (A2AR) agonist that reproduces
cellular responses that contribute to PD, inhibits calcium currents and related biological endpoints in PC12 cells in our assays as reported in other studies [15,22–24]. As shown in Figure 1B, CGS21680 substantially inhibited Ca2+
efflux in PC12 cells, decreasing extracellular Ca2+
levels by,50% compared to untreated controls.
Co-incubation of the CGS21680-treated cells with ZM241385, a potent, non-xanthine A2AR antagonist [25] under evaluation as a
drug candidate for PD [2,26] partially, but substantially, offset this inhibition. Importantly, foreshadowing subsequent endpoints inves-tigated in this study, the ability of ZM241385 to counteract the effects of CGS21680 was reproduced by SMF.
SMF exposure changes A2AR mRNA and protein levels
To investigate whether changes to Ca2+flux observed at early
time points in SMF-treated cells (Figure 1) impacted endpoints relevant to PD in PC12 cells over longer time periods, we
Figure 1. Calcium levels in PC12 cells exposed to SMF, the A2AR agonist CGS21680 or antagonist ZM241385.(A) Extracellular Ca2+was measured for cells maintained in calcium-free medium increased for time points up to 3.0 h in response to SMF exposure; p,0.05 for n = 3 independent experiments. (B) In a separate experiment cells were evaluated at the three hour time point when the largest difference between SMF-treated and unSMF-treated cells occurred but before cell integrity was compromised from the assay conditions (e.g., from using Ca2+
and Mg2+ free D-PBS). Cells treated with 1.0mM CGS21680 experienced decreased Ca2+release compared to control cells while co-treatment of the cells with this
agonist and either 1.0mM ZM241385 or SMF attenuated the CGS21680-induced decrease (pvalues for each comparison are shown on the chart for
measured A2AR mRNA and protein levels. In this experiment, the
A2AR agonist CGS21680 dramatically up-regulated A2AR mRNA;
this response was reversed by concurrent exposure to ZM241385 (Figure 2A). Consistent with the results shown in Figure 1 where ZM241385 was shown to reverse the impact of CGS21680 on calcium efflux, SMF was able to suppress the increased A2AR
mRNA levels engendered by CGS21680. To confirm that the changes in mRNA expression extended to protein levels of A2AR,
we used western blotting to compare A2AR in control and test cells
and found that the highly increased amounts of A2AR mRNA in
CGS21680-treated cells led to a similar (albeit quantitatively smaller) increase in A2AR protein levels. These increases in A2AR
were reduced to roughly control levels by co-treatment with ZM241385 and SMF (Figure 2B & C).
SMF mediated changes are consistent with L-type Ca2+channel modulators
To gain a better perspective whether long-lived changes (e.g., changes to gene expression, and endpoint previously observed for
SMF in our studies [8]) could have been initiated through the proposed modulation of calcium channel activity by SMF, an independent method to alter Ca2+
flux was evaluated. Specifically, Bay K8644 (an L-type Ca2+
channel activator) and nifedipine, (an L-type Ca2+channel blocker) were used to alter Ca2+flux in PC12
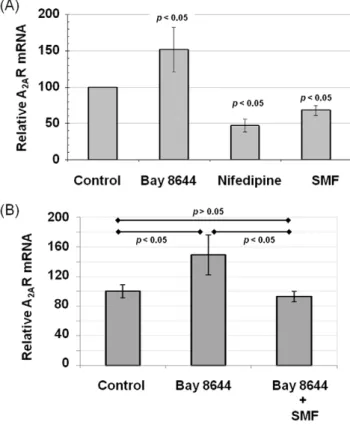
cells and A2AR mRNA levels were again evaluated. In this
experiment, Bay K8644 increased A2AR mRNA levels while
nifedipine treatment decreased transcription (Figure 3A); in essence Bay K8644 reproduced the effects of agonist CGS21680 and nifedipine mimicked antagonist ZM241385 (as shown in Figure 2A). To further strengthen the correlation between L-type Ca2+ channels, calcium flux, and A
2AR transcription, we
demonstrated that the increased levels of A2AR mRNA found in
Bay 8644 treated cells could be reduced to levels found in control cells by concomitant exposure to SMF (Figure 3B).
Overall, although detailed characterization of the intracellular flux of calcium in SMF-treated cells is beyond the scope of the current work (for example, real-time imaging methods that capture dynamic changes to organelle-specific calcium levels are not compatible with our SMF-treatment device) the experiments described in Figures 1 to 3 are consistent with a mechanism whereby SMF alters the biophysical properties of cellular membranes and embedded ion channels (see Discussion), thereby affecting Ca2+
flux in ways that mimic the A2AR antagonist
ZM241385. Based on this foundation, and the knowledge that calcium functions as a second messenger in numerous signaling
Figure 2. Effect of Ca2+ flux and adenosine activators and
blockers on A2AR mRNA and protein levels in PC12 cells.(A) The A2AR agonist CGS21680 increased A2AR mRNA levels by over 5-fold
while the antagonist ZM241385 as well as SMF decreased this agonist-enhanced A2AR transcription to close to control levels (pvalues for each
comparison are shown on the chart for n$3 independent experiments). (B) The A2AR agonist CGS21680 increased A2AR protein levels while the
antagonist ZM241385 as well as SMF decreased A2AR in western blots;
quantification of representative data is shown in (C); this experiment was repeated three times with similar results.
doi:10.1371/journal.pone.0013883.g002
Figure 3. Effect of L-type Ca2+channel activators and blockers
on A2AR mRNA and protein levels in PC12 cells.(A) The L-type Ca2+channel activator Bay K8644 increased A
2AR mRNA levels in PC12
cells compared to untreated controls while the L-type Ca2+ blocker Nifedipine, as well as SMF exposure, decreased A2AR mRNA levels after
6.0 h of exposure (p,0.05 for each test condition compared to control for n$3 independent experiments). (B) Increased A2AR mRNA resulting
pathways and – in neural cells – contributes to the excitatory state [27], the remainder of this report describes several endpoints of relevance to PD that respond to SMF in a manner similar to ZM241385 in PC12 cells.
SMF exposure modulates ATP and ADO levels
Upon establishing that CGS21680, ZM241385, and SMF modulate Ca2+ion channel flux and A
2AR transcription in PC12
cells (Figures 1–3) we investigated whether the effects of these stimuli extended to modulation of adenosine (ADO) metabolism. Specifically, because calcium is linked to adenosine (ADO) levels that, together with cAMP, modulate A2AR activity in PC12 cells to
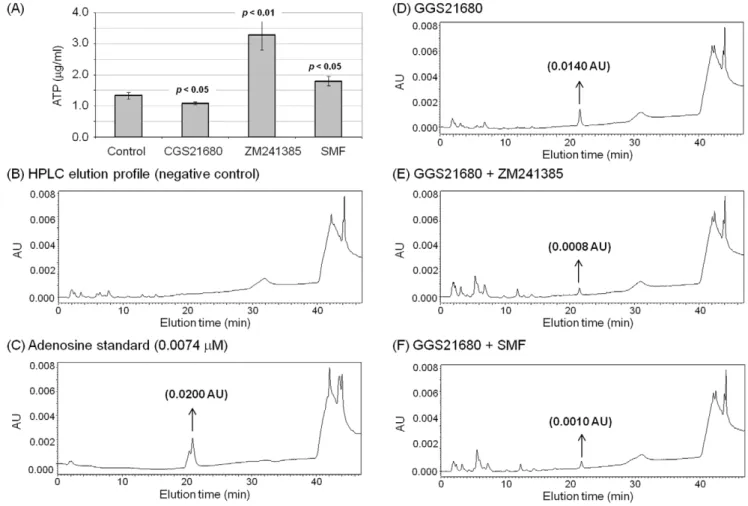
reproduce cellular aberrations found in PD [17–20] we first measured cellular levels of adenosine triphosphate (ATP), which provide energy to activate the plasma membrane Ca2+
ATPase (PMCA) and also is an upstream source of ADO. ATP levels were moderately (but statistically significantly) lower in PC12 cells incubated with CGS21680 compared to untreated controls (Figure 4A), consistent with a shift to an ADO producer phenotype that occurs during hypoxia in this cell model of PD [28]. By contrast, ATP levels were higher in ZM241385 and SMF treated cells than in the untreated controls.
Known metabolic connections between ATP and the down-stream metabolite ADO suggested that changes to ATP levels shown in Figure 4A would be reflected in changes to ADO, an important modulator of PD-related endpoints via adenosine receptors. Using an HPLC assay, we were unable to detect ADO release from untreated control cells (Figure 4B; an authentic ADO sample is shown in Figure 4C). By contrast, ADO release increased to readily detectable levels for CGS21680-treated cells (Figure 4D). The release of ADO from A2AR agonist-treated cells
was attenuated by,50% by concurrent treatment with the small
molecule antagonist ZM241385 (Figure 4E) as well as by SMF (Figure 4F).
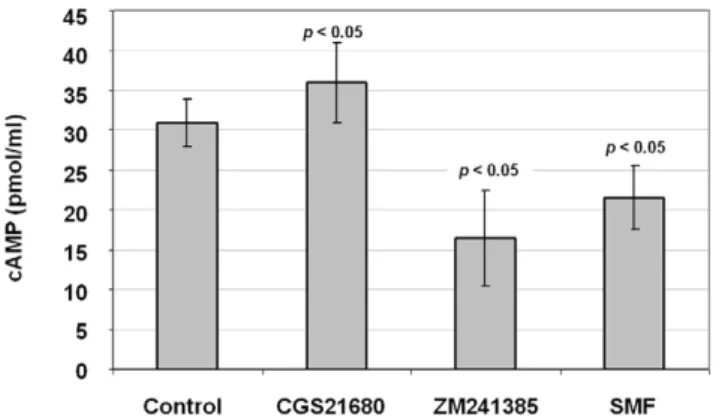
SMF exposure increases intracellular cAMP levels
Levels of cAMP are another parameter relevant to PD that can be interrogated in PC12 cells; this ubiquitous second messenger is linked to Ca2+
through a complex sequence of events mediated by A2AR [29] and Gas proteins [30]. To evaluate connections
between cAMP and A2AR in our experiments, we analyzed cAMP
levels in agonist (CGS21680) and antagonist (ZM241385) treated cells and found a modest increase in the former and a more substantial decrease in the latter (Figure 5). In these experiments
Figure 4. Cellular ATP and ADO levels in PC12 cells exposed to SMF, CGS21680 or ZM241385.(A) Cells were incubated with 1.0mM
CGS21680, ZM241385, or exposed to SMF for 6.0 h. The cells were harvested and an equal number from each sample were used to prepare extracts and to measure intracellular ATP levels (p,0.05 for n$3 independent experiments for each treatment condition compared to untreated control cells; a similar trend was observed for 3.0 h, but not all data points were statistically significant). (B) – (F) After 3.0 h incubation in D-PBS, the extracellular fluid was collected from PC12 cells and analyzed by HPLC to detect and quantify ADO. (B) ADO was not detected in samples from untreated control cells (elution of authentic ADO is shown in (C)) but was observed in samples from cells treated with (D) 1.0mM CGS21680, (E) 1.0mM CGS21680 plus
1.0mM ZM241385, or (F) 1.0mM CGS21680 plus exposure to SMF in (F). The HPLC assays were repeated three times with similar results;
SMF decreased cAMP levels, again showing that magnetic exposure can functionally reproduce the cellular effects of an A2AR antagonist.
SMF, like A2AR antagonists, inhibits nitric oxide
production in PC12 cells
Nitric oxide (NO) is a molecular mediator of many physiological processes, including mechanisms that contribute to neurological disorders such as Alzheimer’s disease and PD [31]. Therefore, because of reported connections between Ca2+
, cAMP, and NO ([29]), we measured nitrite concentrations (nitrate is formed by the spontaneous oxidation of NO under physiological conditions) in PC12 cells. Nitrite levels increased in cells incubated with agonist (CGS21680) after 24 h of exposure while they decreased in antagonist (ZM2412385) treated cells (Figure 6). Consistent with results reported above for other PD-related endpoints, SMF reduced nitrite levels, once again demonstrating that magnetic exposure can mimic responses elicited by an A2AR antagonist.
SMF impinges upon MAPK pathways and impacts PC12 cell proliferation
Stimulation of PC12 cells with CGS21680 increases the phosphorylation of p44/42 MAPK (Erk1/2) via cAMP-mediated signaling [19,32]. This prior observation, together with known links between NO production and phosphorylation of p44/42 MAPK [29], prompted us to test whether SMF and the A2AR
modulators CGS21680 and ZM241385 also affected p44/42 MAPK. Accordingly, we first investigated whether CGS21680 increased the phosphorylation of p44/42 MAPK and observed an increase by Western blot analysis after 30 min of exposure (Figure 7A & B) that was consistent with enhanced proliferation observed in the agonist-treated cells (Figure 7C). By contrast, pretreatment of the cells with the ZM241385 or co-treatment with SMF reversed CGS21680-induced p44/42 MAPK phosphoryla-tion resulting in levels lower than observed in untreated control cells (Figure 7A & B); the accelerated proliferation observed in CGS21680 treated cells also was not seen under these condition (Figure 7C). In these experiments, SMF by itself also reduced levels of phospho-p44/42 MAPK and proliferation.
SMF inhibits neurite outgrowth in PC12 cells
The reduced proliferation of PC12 cells exposed to SMF could result from several underlying causes including the onset of apoptosis. Magnetic fields, however, have been reported to be anti-apoptotic [33] and the SMF conditions used in this report have previously been shown to not have a negative impact on cell viability [8]. Another possibility, supported by our previous work where human embryonic cells gained expression of pre-oligoden-drocyte markers upon SMF exposure [8], was that the reduced proliferation we observed was a consequence of differentiation. To assess this possibility, changes to cell fate were monitored by measuring neurite outgrowth, which has been linked directly to A2AR (e.g., during hypoxia [34]) as well as indirectly (e.g., through
cAMP-mediated crosstalk between the MAPK pathway and A2AR
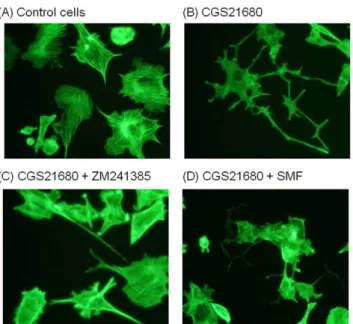
during exposure to the bacterial nucleoside N6-methyldeoxyade-nosine [35]). In these experiments it was necessary to treat the PC12 for three days with CGS21680 to enhance neurite sprouting [36]; CGS21680 caused PC12 cells to flatten and to sprout extended long processes indicative of neurite outgrowth to a much greater extent than untreated controls (Figure 8A & B). ZM241385 counteracted the A2AR agonist-induced increase in neurite
outgrowth (Figure 8C) and exposure of the CGS21680-treated cells to SMF had the same effect (Figure 8D).
SMF inhibits iron uptake in PC12 cells
Iron uptake, which can occur via a Ca2+
activated non-transferrin bound iron (NTBI) mechanism in PC12 cells [37–40], is associated with several neurodegenerative diseases including PD and Alzheimer’s [41] (in PD, oxidative stress hypothesis leads to increased iron concentration in the substantia nigra that induces progressive dopaminergic neuronal degeneration secondary to a high production of hydroxyl radicals by Fenton reaction [42]). Moreover, iron uptake varies between non-differentiated and NGF-induced differentiated PC12 cells [41]. These two factors – changes in Ca2+
flux (Figure 1) and indications of differentiation (i.e., neurite sprouting, Figure 8) – prompted us to investigate iron uptake in PC12 cells treated with CGS21680, ZM241385, or SMF. Exposure of PC12 cells to concentrations (50mM) of free
divalent iron (FeSO4) that ultimately lead to cell death showed that
CGS21680 significantly enhanced iron intake at early time points (i.e., when the cells were still viable) whereas ZM241385 or SMF exposure inhibited agonist-promoted uptake (Figure 9). In essence,
Figure 5. cAMP levels in SMF, CGS21680, and ZM241385 treated PC12 cells.Cells were exposed to each condition, harvested, lysed, and assayed for cAMP levels. Each test condition treatment condition varied from untreated control cells with p,0.05 for n = 3 independent experiments.
doi:10.1371/journal.pone.0013883.g005
Figure 6. Effect of CGS21680, ZM241385, and SMF on nitrite levels in PC12 cells.Levels of nitrite were measured after 24 h of incubation with 1.0mM of the A2AR agonist (CGS21680) or antagonist
SMF decreased the bioavailability of Fe2+thereby functioning in a
manner similar to neuroprotective iron chelating drugs [41].
Discussion
Numerous drawbacks with L-DOPA based therapy for PD (as reviewed elsewhere, [1,43]) have led to intense efforts to develop alternative treatments. One direction has been guided by epidemiological evidence that heavy coffee drinkers have a lower incidence of PD [44] with the benefits of coffee presumably resulting from caffeine’s interactions with adenosine receptors [45]. Consistent with this hypothesis, early clinical tests showed that non-specific adenosine receptor-antagonist theophylline provided significant benefits for PD patients [46]. Subsequent investigations that established that antagonistic interactions exist between A2AR and dopamine D2 receptors spurred the search for
A2AR-specific antagonists [47] such as KW-6002, a compound
that showed therapeutic value in MPTP-treated marmosets an animal model of PD [48]. In the past several years, highly selective A2AR antagonists – such as ZW241385 used in the current study –
have been developed.
In this report we combine the emergence of A2AR as a target
for PD drug development with the growing realization that magnetic exposure legitimately modulates physiological pro-cesses in vivo in ways that may be therapeutically beneficial [49–52] (overall, more than 40 randomized controlled trials of magnetic therapy for more than 30 clinical indications have been reported [53]) to show that SMF exposure reproduces the effects of A2AR antagonists over a gamut of PD-relevant
endpoints in PC12 cells. More specifically the current experi-ments demonstrate that SMF can reproduce the effects of A2AR
antagonist ZM241385 in PC12 cells or, in cases where an appropriate response could not be observed in naı¨ve cells (e.g., ADO release (Figure 4) or neurite sprouting (Figure 8)), SMF
Figure 7. Effect of CGS21680, ZM241385, and SMF on p44/42 MAPK phosphorylation and proliferation in PC12 cells.(A) Western blots show the phosphorylation of p44/42 MAPK after exposure to SMF or 1.0mM CGS21680 for 48 h, or after pretreatment with 1.0mM ZM241385 or
SMF for 30 min followed by the addition of 1.0mM CGS21680 and an additional 48 h of incubation (total p44/42 MAPK is also shown); quantification
by densitometry for a representative experiment (of n = 3 independent experiments) is shown in (B). (C) Proliferation of PC12 cells grown under the conditions indicated in (A), but for three days instead of 48 h, are given as measured by the MTT assay (pvalues for the various comparisons indicated on the figure are for n$3 independent experiments).
can counteract responses induced or exacerbated by the A2AR
agonist CGS21680.
The biological effects of ZM241385 result from direct binding to A2AR [54–56]. By contrast, SMF – not being a conventional
small molecule pharmacological agent – must elicit cellular responses through a fundamentally different mode of action. A plausible mechanism, consistent with the data shown in Figures 1– 3 and outlined in cartoon form in Figure 10, is that SMF alters the biophysical properties of lipid bilayers [57–60], which in turn modulates ion channel activity [61] and Ca2+levels [8,21]. Over
time periods of many hours to several days, SMF-initiated changes to Ca2+ can modulate signaling pathways, leading to significant
changes in gene expression, cell behavior, and phenotype [8]. As a caveat, intracellular flux of calcium has not been thoroughly characterized in our experiments; for example, nuances of calcium release from storage organelles (e.g., the sarcoplasmic reticulum, which is affected by A2AR [62]) in SMF-treated cells remain
largely undefined. In addition, calcium-initiated responses evoked
by SMF may be augmented by calcium-independent mechanisms. For example, relevant to the endpoints measured in this study, activation of p42/p44 MAPK has been reported to mediate adenosine-induced nitric oxide production by both calcium-dependent and calcium-insensitive mechanisms [63]. Therefore we emphasize that although our results are fully consistent with a calcium-mediated mechanism, additional experiments are re-quired to unequivocally establish ion channels as the ‘‘biosensor’’ that responds to magnetic exposure. Notwithstanding this ambiguity, SMF reproduced cellular effects of the A2AR antagonist
AM241385 in multiple assays in PC12 cells in the current study. Together, these results raise the intriguing hypothesis that SMF can reproduce the effects of a promising class of non-dopaminergic PD drugs in a non-invasive manner and, more broadly, hold potential for ameliorating additional neurological disorders such as Alzheimer’s and Huntington’s diseases through modulation of A2AR [64–66].
Materials and Methods
Cell culture
Rat pheochromocytoma (PC12) cells were purchased from the American Tissue Culture Collection (ATCC, Manassas, VA) and grown in RPMI medium (GIBCO) that contained 10% horse serum, 5.0% fetal bovine serum, and penicillin/streptomycin (100 U/ml and 100mg/ml, respectively). The cells were grown in
a water saturated incubator maintained at 5.0% CO2 and 37uC
and growth medium was changed twice a week. With the exception of the experiments evaluating neurite outgrowth (i.e., the results shown in Figure 8), the experiments described in this report used undifferentiated PC12 cells; this distinction is important because NGF-induced differentiated PC12 cells are less viable than undifferentiated cells [19] and undifferentiated PC12 cells have the capability to generate increased levels of cAMP (e.g., during early stages of anoxia) while NGF-induced PC12 cells have a diminished ability to produce cAMP [19].
Exposure of cells to SMF
A problem hindering the acceptance of magnetic therapy has been that many studies have used inadequately defined treatment devices leading to difficulties reproducing experimental
condi-Figure 8. Effect of CGS21680, ZM241385, and SMF on neurite sprouting in PC12 cells. Representative images of PC12 cells that were (A) untreated or treated with (B) CGS21680 (1.0mM), (C)
ZM241385 (1.0mM), or (D) SMF for three days are shown. (E) Neurite
outgrowth was quantified by counting the number of cells exhibiting neurites that were 1.5 times longer than the diameter of the cell and the proportion of cells with neurites was expressed as a percentage of the total number of cells; data is shown from counting at least 100 cells from each of five fields selected at random.
doi:10.1371/journal.pone.0013883.g008
Figure 9. Effect of CGS21680, ZM241385, and SMF on iron uptake in PC12 cells. Intracellular iron was quantified using a colorimetric assay one hour after the addition of 50mM FeSO4to the
medium (pvalues are shown comparing each test condition to controls for n$3 independent experiments).
tions from laboratory to laboratory [53]. Thus, in a previous publication [8] we carefully described our magnetic exposure conditions (using a device provided by the Advanced Magnetic Research Institute, International; AMRIi, Calgary, AB). Neo-dymium magnets are arranged in this device (shown at a publically available link: http://www.biomedcentral.com/imedia/ 1847435373293053/supp2.ppt) to provide a unidirectional field that varies between 0.23 and 0.28 T over several centimeters (#1 mT/mm). Consequently, the shallow nature of this gradient ensures that individual cells are essentially exposed to uniform fields and are not subject to spatial gradient effects observed in cells exposed to fields that varied by $20 mT/mm [67–70]. Moreover, no dose-dependency was observed between 0.23 and 0.28 T for the endpoints tested in this report (data not shown). Untreated control cells were maintained in a separate (but otherwise identical) tissue culture incubator where the ambient magnetic field was measured at ,52 mT, which is essentially
identical to the 52,359 nT field reported for a latitude of 39u199
350and a longitude of276u369170 (i.e., for United States zip code 21218) by the National Geophysical Data Center). Finally, we have tested whether orientation of the imposed field superimposed on – or opposing – the ambient geomagnetic field affects the endpoints being studied; field orientation was found to not have an effect (all experiments nonetheless were conducted using a superimposed field orientation).
Measurement of Ca2+
To measure Ca2+
, PC12 cells were grown in 12-well tissue culture plates for three days prior to the assay until they reached a confluency of 85 to 90%. For measuring extracellular Ca2+, PC12
cells were maintained in Ca2+and Mg2+free D-PBS (Dulbecco’s
phosphate buffered saline) for the indicated time intervals (e.g., as shown in Figure 1A) either with or without exposure to SMF. The supernatants were collected by centrifugation at 300 x g for 2.0 min and analyzed by using the Calcium Reagent Set (Pointe Scientific Inc., Canton, MI). For measuring intracellular Ca2+
, the cells were lysed by sonication on ice for 1.0 min at an amplitude setting of 40 using a GE130PB ultrasonic processor (GE, New York, NY). In certain experiments, the optimized time point for evaluating Ca2+efflux (i.e., 3.0 h) was used to evaluate the impact
of A2AR agonist and antagonist on Ca2+transport by pretreating
the cells with 1.0mM ZM241385 (4-(2-[7-amino-2-(2-furyl)[1,2,4]-triazolo[2,3-a][1,3,5]triazin-5-ylamino]ethyl)-phenol, an adeno-sine A2A receptor (A2AR)-specific antagonist, Tocris Bioscience,
St. Louis, MO) or SMF for 40 min in Ca2+
and Mg2+
free D-PBS and then incubating each set of cells with 1.0mM CGS21680 (4- [2-[[6-amino-9-(N-ethyl-b-D-ribofuranuronamidosyl)-9H-purin-2yl]amino]ethyl]benzenepropanoic acid hydrochloride, an aden-osine A2Areceptor (A2AR)-specific agonist; Tocris Bioscience) or
maintaining SMF exposure for an additional three hours before performing the assays described above.
Figure 10. Outline of the putative mechanism of SMF on lipid bilayers, Ca2+flux, A
2AR receptors, and downstream modulation of
multiple effector systems.(A) Phospholipid molecules possess diamagnetic anisotropy and align and reorient in the presence of moderate strength magnetic fields [60] thereby reducing the flexibility of the phospholipid acyl chains. The consequent stiffening of phospholipid molecules increases lateral compression and thickens the bilayer thereby altering the bulk biophysical properties of the membrane [79]. In turn, changes to membrane dynamics can affect the activity of embedded proteins ranging from signaling complexes (e.g., the toll like receptors [80]) to ion channels and membrane transporters [81]. (B) Specific examples of candidates for such SMF-mediated modulation include the sodium calcium exchanger (NCX) that transports Ca2+
out of a cell, the voltage gated L-type Ca2+
channel that transports Ca2+
into a cell, and the plasma membrane Ca2+ ATPase (PMCA) pump that hydrolyzes ATP to gain energy to remove Ca2+from a cell (data relating to Ca2+is given in Figure 1, concomitant changes to mRNA and proteins levels for A2AR in Figures 2 and 3, and ATP in Figure 4A). (C) ATP is linked to Ca2+flux in another way, namely through
metabolites such as adenosine (ADO, see Figure 4B-F). (D) ADO binds to adenosine receptors such as A2AR, which in turn can further modulate Ca2+
flux. (E) Calcium is a ubiquitous second messenger, leading to secondary responses that involve cAMP (Figure 5) or nitric oxide (Figure 6); in turn multiple effector systems (MES) can be engaged that affect additional endpoints including MAPK pathways (Figure 7), neurite outgrowth indicative of differentiation (Figure 8), and iron (Figure 9).
Quantitative real-time PCR (qRT-PCR) measurement of A2AR mRNA
PC12 cells were treated with L-type Ca2+
channel activator (10 nM Bay K8644) or L-type Ca2+
channel blocker (100 nM nifedipine) for 24 h; alternatively, they were incubated with CGS21680, ZM241385, or exposed to SMF as described above and used for qRT-PCR (described below) and western blot analysis (described in the following sections).
Forward and reverse primers for A2AR and the housekeeping
gene glyceraldehyde-3-phosphate dehydrogenase (GAPDH) were designed by using Primer3software [71] and were obtained from MWG-Biotech (High Point, NC). The sequences were as follows: A2AR 59-GGACTCGGATTTGGATT-39 (forward primer) and
59-TGTTGGCAGCGTATGT-39 (reverse primer); housekeeping genes glyceraldehyde-3-phosphate dehydrogenase (GAPDH): 59 -GCAAATTCCATGGCA CCGT-39 (forward primer) and 59 -TCGCCCCACTTGATTTTGG-39(reverse primer) were moni-tored in each experiment. The basic protocol followed for qRT-PCR experiments began with the isolation of total RNA from 5.06106cells with the RNeasy Mini Kit (Qiagen, Valencia, CA) or
by the TRIzol (Invitrogen) method. RNA quality was assessed by agarose gel electrophoresis (1.8% gels run with TAE buffer followed by nucleic acid band visualization under UV illumination after ethidium bromide staining) and quantified byA260/A280OD
readings. RNA integrity was confirmed using 18 S rRNA primers, and samples were standardized based on equal levels of b-actin cDNA. Quantitative real-time PCR was performed in an ABI Prism 7000 sequence detector (Applied Biosystems) using SYBR Green PCR Master Mix reagent (Applied Biosystems). Reactions were performed in 20ml of a mixture containing a 2.0-ml cDNA dilution, 1.0ml (10 pmol/ml) of each primer, and 10ml of 2x SYBR master mix containing Amplitaq Gold DNA polymerase, reaction buffer, a dNTP mixture with dUTP, passive reference, and the SYBR Green I. PCR conditions were as follows: one cycle at 2.0 min at 50uC, then 95uC for 10 min, followed by 40 cycles of 95uC for 15 s and 60uC for 1.0 min. Specific PCR products were detected with the fluorescent double-stranded DNA binding dye, SYBR Green [72]. PCR amplification was performed in triplicate and replicated in three independent experiments. Gel electropho-resis and melting curve analyses were performed to confirm correct PCR product sizes and the absence of nonspecific bands. The expression levels of each gene were normalized against GAPDH using the comparative CT method according to the manufacturer’s protocols [73].
Plasma membrane preparation
PC12 cells were seeded in 100 mm culture dishes and pretreated with 1.0mM CGS21680 for 30 min, then treated with 1.0mM ZM241385 or exposed to SMF for 48 h. The cells were harvested by scraping from the plates and then collected by centrifugation at 300 x g for 2.0 min at 4.0uC. The plasma membrane protein extraction kit (BioVision, Mountain View, CA) was used according to the manufacturer’s protocol to specifically isolate the plasma membrane from the total cellular membranes. The plasma membrane fraction was dissolved in 0.5% Triton X-100 in PBS, and plasma membrane protein concentration was measured using the BCA protein assay (Pierce) and then 40mg protein of each sample was used for western blot analysis.
Western blot analysis
An equal amount of protein from each sample (40mg) was incubated for 5.0 min at 100uC in Laemmli buffer (Bio-Rad), separated on an 11% SDS-polyacrylamide discontinuous gel, and
then electrophoretically transferred to a nitrocellulose membrane (Bio-Rad). The membrane was blocked with Tris-buffered saline containing 5.0% nonfat milk and 0.1% Tween 20 for 1.0 h at room temperature and then incubated overnight with rabbit phospho-p44/42 MAPK monoclonal antibody, p44/42 MAPK antibody (1:1000 dilution) (Cell Signaling Technology, Beverly, MA) and anti-adensosine A2A receptor rabbit antibody (Abcam
Inc, Cambridge, MA) at 4.0uC, followed by anti-rabbit IgG, horseradish peroxidase-linked antibody (1:2000) for 1.0 h. Bound antibody on the membrane was detected using the SuperSignal West Dura Extended Duration Substrate (Pierce) according to the protocols supplied by the manufacturer. Quantification of bands was performed by using the NIH ImageJ software (available on the World Wide Web at rsb.info.nih.gov/nih-image) following a published method [74].
Measurement of cellular ATP
ATP was measured using a chemiluminescence method employing a luciferin–luciferase reaction [75]; the assay reagents were purchased as a kit (ATP bioluminescent somatic cell assay kit, FL-ASC; Sigma) and prepared according to the manufacturer’s instructions. PC12 cells were plated on 35-mm-diameter dishes and left untreated, incubated with 1.0mM or CGS21680 or 1.0mM ZM241385, or exposed to SMF for 6.0 h cells and then harvested and suspended in 0.5 ml of RPMI. Cell samples (50ml)
were placed into a tube that contained 100ml of somatic cell releasing reagent and 50ml of sterile purified water (SAM) or an ATP standard (2.0 nmol/ml) as internal standard (IS) and swirled briskly. An portion of this mixture (100ml) was transferred to a reaction vial that contained 100ml of assay mix solution, and then the amount of light emitted,L, was immediately measured with a luminometer (Modulus, Turner Biosystem, Sunnyvale, CA). The amount of ATP in the cell sample was calculated by the following equation: ATPSAM = ATPIS X LSAM/(LSAM+IS-LSAM), where
ATPSAMstands for the ATP in the cell sample,ATPISfor the ATP
in the internal standard, LSAM for the light emitted by the cell
sample, andLSAM+ISfor the light emitted by the cell sample plus
the internal standard.
HPLC measurement of adenosine (ADO) levels
PC12 cells were plated in 35 mm tissue culture dishes. When the cells reached 90% confluency, the dishes were rinsed twice with 2.0 ml of Krebs solution that contained 135 mM NaCl,1.5 mM NaH2PO4, 5.0 mM KCl, 2.0 mM CaCl2,
2.0 mM MgCl2, 10 mM glucose, 15 mM HEPES, and the
ADO deaminase (ADA) inhibitor [erythro-9-(2-hydroxy-3-non-yl)adenosine (EHNA) at 1.0mM. To measure the release of ADO using a procedure that avoids the potential production of ADO via the degradation of endogenous adenine nucleotides, 0.5 ml of the prewarmed Krebs solution including 1.0mM EHNA was placed onto the plated cells (EHNA was included to inhibit extracellular degradation of ADO by ADA). After incubation for 3.0 h, the extracellular fluid was collected and the samples were processed to extract ADO as reported previously [28,76]; briefly, the extracellular fluids were rapidly collected into microcentrifuge tubes and centrifuged at 14,000 x g for 1.0 min. Supernatants (400ml) were placed into separate tubes and deproteinated with 20ml of 100% trichloroacetic acid. The acid-precipitated protein was removed by centrifugation at 14,000 x g for 5.0 min, and 300ml of supernatant was immediately neutralized with 40ml of 3.3 M KOH. The adenine nucleotides were precipitated by adding 200ml of 1.0 M zinc sulfate and 100ml of saturated
HPLC; separation of compounds was achieved using a 4-mm (i.d.), 15-cm-long prepacked Novapak C18 column. Samples were eluted from the column using a gradient (0–40%, 35 min) of low-strength eluent (0.02 mol/L potassium dihydrogen phosphate buffer, pH 5.5) and high-strength eluent [60:40 (vol/vol) mixture of methanol and water]. The flow rate was 1.0 ml/min, and the column temperature was ambient in all the determinations. Peaks were identified on the basis of retention times in comparison with an authentic standard of ADO.
cAMP assays
On the day of the cAMP assay, 5.06105cells were placed in fresh medium and incubated with 1.0mM CGS21680, 1.0mM
ZM241385, or SMF in the presence of 1.0 U/ml adenosine deaminase (ADA) for 3.0 h. Cells were then harvested, lysed in 500ml 0.1 M HCl for 20 min, centrifuged at 700x gfor 10 min,
and the supernatants were assayed for cellular cAMP accumulation using the cAMP enzyme immunoassay system kit (Sigma-Aldrich, St. Louis, MO) following protocols supplied by the manufacturer.
Nitrite assays
Nitric oxide (NO) production was assessed by measuring the amount of nitrite, a stable metabolic product of NO that provides an indirect measurement of NO, by using the Griess diazotization reaction [77]. Briefly, after 24 h after incubation with 1.0mM CG21680 or 1.0mM ZM241385 or exposure to SMF, samples of medium (150ml) were collected from cells and mixed with 130ml
dH2O and with 20ml Griess reagent using instruction supplied by the manufacturer (Cat. No. G-7921, Invitrogen-Molecular Probes, Carlsbad, CA). After a 30 min incubation period at room temperature, the samples were evaluated spectrophotometrically at 548 nm and OD values – in comparison with a standard curve was determined in culture medium by using serial dilutions of sodium nitrite – represented total stable metabolites of NO.
Measurement of neurite outgrowth
PC12 cells grown on coverslips were changed into differenti-ation medium (1.0% horse serum with 25 ng/ml NGF) 24 h after being passaged. The cells were then pretreated with 1.0mM CGS21680 for 30 min followed by the addition of 1.0mM
ZM241385 or exposure to SMF for an additional three days followed by staining with F-actin conjugated with Oregon Green488 phalloidin (1:100) (Molecular Probes, now Invitrogen, Eugene, OR). The coverslips were mounted using ProLong GoldH
anti-fade reagent (Molecular Probes, Cat. No. P36934) and
imaged by using a Zeiss 510 Meta confocal microscope. From each slide at least 100 cells from five randomly selected fields were counted. Cells were classed as differentiated if they exhibited an outgrowth extending from the cell which was at least 1.5 times the diameter of the cell. Measurements were carried out using NIH Scion image software.
Quantification of intracellular iron
Intracellular iron was quantified using a colorimetric assay described by Riemer et al [78]. Briefly, stimulus-treated or control PC12 cells grown in 48-multiwell cell culture plates were incubated in the presence of 50mM FeSO4for 2.0 h. The culture
medium was removed and cells were washed twice with ice-cold PBS. Cells were frozen in the culture plates and stored at220uC. Cells were lysed with 50 mM NaOH for 2.0 h on a shaker in a humidified atmosphere. Aliquots of these samples were incubated with equal amounts of 10 mM HCl and a 1:1 solution of 1.4 M HCl/4.5% (wt/vol) KMnO4for 2.0 h in a 60uC prewarmed water
bath under the fume hood to release all intracellular protein-bound iron. The cells were allowed to cool to room temperature before 60ml of a 60uC detection solution containing 6.5 mM ferrozine (Sigma), 6.5 mM neocuproine (Sigma), 2.5 M ammoni-um acetate, and 1.0 M ascorbic acid (Sigma) was added. Color reading of the supernatant was done in an ELISA reader at 550 nm. For quantification, an appropriate standard curve was prepared by using a 10 mM FeSO4stock solution.
Statistical analysis
Results are expressed as mean values of three or more independent experiments and error bars represent standard error of the mean (S.E.M.) calculations; statistical analyses were made using the Student unpaired t-test or ANOVA followed by the appropriate post hoc tests.
Acknowledgments
We are grateful for helpful discussions with Dr. Wayne Bonlie and for the gift of the treatment device from AMRI International (Calgary, AB, Canada).
Author Contributions
Conceived and designed the experiments: ZW KY. Performed the experiments: ZW PLC JD BH. Analyzed the data: ZW JD KY. Contributed reagents/materials/analysis tools: ZW. Wrote the paper: ZW KY.
References
1. Hattoria N, Wanga M, Taka H, Fujimura T, Yoritaka A, et al. (2009) Toxic effects of dopamine metabolism in Parkinson’s disease. Parkinsonism Relat Disord 15: S35–S38.
2. Mandel S, Grunblatt E, Riederer P, Gerlach M, Levites Y, et al. (2003) Neuroprotective strategies in Parkinson’s disease: an update on progress. CNS Drugs 17: 729–762.
3. Belcastro V, Tozzi A, Tantucci M, Costa C, Di Filippo M, et al. (2009) A2A adenosine receptor antagonists protect the striatum against rotenone-induced neurotoxicity. Exp Neurol 217: 231–234.
4. Benabid AL, Chabardes S, Mitrofanis J, Pollak P (2009) Deep brain stimulation of the subthalamic nucleus for the treatment of Parkinson’s disease. Lancet Neurol 8: 67–81.
5. Azanza MJ (1989) Steady magnetic fields mimic the effect of caffeine on neurons. Brain Res 489: 195–198.
6. Sandyk R, Anninos PA, Tsagas N, Derpapas K (1992) Magnetic fields in the treatment of Parkinson’s disease. Int J Neurosci 63: 141–150.
7. Arendash GW, Sanchez-Ramos J, Mori T, Mamcarz M, Lin X, et al. (2010) Electromagnetic field treatment protects against and reverses cognitive impairment in Alzheimer’s disease mice. J Alzheimers Dis 19: 191–210.
8. Wang Z, Sarje A, Che P-L, Yarema KJ (2009) Moderate strength (0.23-0.28 T) static magnetic fields (SMF) modulate signaling and differentiation in human embryonic cells. BMC Genomics 10: 356.
9. Biber K, Lubrich B, Fiebich BL, Boddeke HW, van Calker D (2001) Interleukin-6 enhances expression of adenosine A(1) receptor mRNA and signaling in cultured rat cortical astrocytes and brain slices. Neuropsychopharmacology 24: 86–96.
10. Olah ME, Stiles GL (1995) Adenosine receptor subtypes: characterization and therapeutic regulation. Annu Rev Pharmacol Toxicol 35: 581–606.
11. Theodosis DT, Bonhomme R, Vitiello S, Rougon G, Poulain DA (1999) Cell surface expression of polysialic acid on NCAM is a prerequisite for activity-dependent morphological neuronal and glial plasticity. J Neurosci 19: 10228–10236. 12. Greene LA, Tischler AS (1976) Establishment of a noradrenergic clonal line of rat adrenal pheochromocytoma cells which respond to nerve growth factor. Proc Natl Acad Sci USA 73: 2424–2428.
13. Blum D, Torch S, Nissou MF, Benabid AL, Verna JM (2000) Extracellular toxicity of 6-hydroxydopamine on PC12 cells. Neurosci Lett 283: 193–196. 14. Meng H, Li C, Feng L, Cheng B, Wu F, et al. (2007) Effects of Ginkgolide B on
15. Kobayashi S, Conforti L, Pun RY, Millhorn DE (1998) Adenosine modulates hypoxia-induced responses in rat PC12 cells via the A2Areceptor. J Physiol 508: 95–107.
16. Ferre S, O’Connor WT, Fuxe K, Ungerstedt U (1993) The striopallidal neuron: a main locus for adenosine-dopamine interactions in the brain. J Neurosci 13: 5402–5406.
17. Beitner-Johnson D, Leibold J, Millhorn DE (1998) Hypoxia regulates the cAMP-and Ca2+
/calmodulin signaling systems in PC12 cells. Biochem Biophys Res Commun 242: 61–66.
18. Kobayashi S, Beitner-Johnson D, Conforti L, Millhorn DE (1998) Chronic hypoxia reduces adenosine A2Areceptor-mediated inhibition of calcium current in rat PC12 cells via downregulation of protein kinase A. J Physiol 512: 351–363. 19. Arslan G, Kull B, Fredholm BB (2002) Anoxia redistributes adenosine A2A receptors in PC12 cells and increases receptor-mediated formation of cAMP. Naunyn Schmiedebergs Arch Pharmacol 365: 150–157.
20. Vajanaphanich M, Schultz C, Tsien RY, Traynor-Kaplan AE, Pandol SJ, et al. (1995) Cross-talk between calcium and cAMP-dependent intracellular signaling pathways. Implications for synergistic secretion in T84 colonic epithelial cells and rat pancreatic acinar cells. J Clin Invest 96: 386–393.
21. Tenuzzo B, Chionna A, Panzarini E, Lanubile R, Tarantino P, et al. (2006) Biological effects of 6 mT static magnetic fields: A comparative study in different cell types. Bioelectromagnetics 27: 560–577.
22. Park TJ, Chung S, Han MK, Him UH, Kim KT (1998) Inhibition of voltage-sensitive calcium channels by the A2A adenosine receptor in PC12 cells. J Neurochem 71: 1251–1260.
23. Regaya I, Pham T, Andreotti N, Sauze N, Carrega L, et al. (2004) Small conductance calcium-activated K+channels, SkCa, but not voltage-gated K+
(Kv) channels, are implicated in the antinociception induced by CGS21680, a A2A adenosine receptor agonist. Life Sci 76: 367–377.
24. Mori Y, Higuchi M, Masuyama N, Gotoh Y (2004) Adenosine A2A receptor facilitates calcium-dependent protein secretion through the activation of protein kinase A and phosphatidylinositol-3 kinase in PC12 cells. Cell Struct Funct 29: 101–110.
25. Poucher SM, Keddie JR, Singh PK, Stoggall SM, Caulkett PW, et al. (1995) The in vitro pharmacology of ZM 241385, a potent, non-xanthine A2a selective adenosine receptor antagonist. Br J Pharmacol 115: 1096–1102.
26. Vu CB, Peng B, Kumaravel G, Smits G, Jin X, et al. (2004) Piperazine derivatives of [1,2,4]triazolo[1,5-a][1,3,5]triazine as potent and selective adenosine A2a receptor antagonists. J Med Chem 47: 4291–4299.
27. Chan SL, Mayne M, Holden CP, Geiger JD, Mattson MP (2000) Presenilin-1 mutations increase levels of ryanodine receptors and calcium release in PC12 cells and cortical neurons. J Biol Chem 275: 18195–18200.
28. Kobayashi S, Zimmermann H, Millhorn DE (2000) Chronic hypoxia enhances adenosine release in rat PC12 cells by altering adenosine metabolism and membrane transport. J Neurochem 74: 621–632.
29. Jang JH, Surh YJ (2005) AP-1 mediatesb-amyloid-induced iNOS expression in PC12 cells via the ERK2 and p38 MAPK signaling pathways. Biochem Biophys Res Commun 331: 1421–1428.
30. Arslan G, Kontny E, Fredholm BB (1997) Down-regulation of adenosine A2A receptors upon NGF-induced differentiation of PC12 cells. Neuropharmacology 36: 1319–1326.
31. Zhang L, Dawson VL, Dawson TM (2006) Role of nitric oxide in Parkinson’s disease. Pharmacol Ther 109: 33–41.
32. Narkar VA, Hussain T, Pedemonte C, Lokhandwala MF (2001) Dopamine D(2) receptor activation causes mitogenesis via p44/42 mitogen-activated protein kinase in opossum kidney cells. J Am Soc Nephrol 12: 1844–1852.
33. Tenuzzo B, Vergallo C, Dini L (2009) Effect of 6 mT static magnetic field on the bcl-2, bax, p53 and hsp70 expression in freshly isolated and in vitro aged human lymphocytes. Tiss Cell 41: 169–179.
34. O’Driscoll CM, Gorman AM (2005) Hypoxia induces neurite outgrowth in PC12 cells that is mediated through adenosine A2Areceptors. Neuroscience 131: 321–329.
35. Charles MP, Adamski D, Kholler B, Pelletier L, Berger F, et al. (2003) Induction of neurite outgrowth in PC12 cells by the bacterial nucleoside N6-methyldeoxyadenosine is mediated through adenosine A2a receptors and via cAMP and MAPK signaling pathways. Biochem Biophys Res Commun 304: 795–800.
36. Cheng H-C, Shih H-M, Chern Y (2002) Essential role of cAMP-response element-binding protein activation by A2A adenosine receptors in rescuing the nerve growth factor-induced neurite outgrowth impaired by blockage of the MAPK cascade. J Biol Chem 277: 33930–33942.
37. Wright TL, Brissot P, Ma WL, Weisiger RA (1986) Characterization of non-transferrin-bound iron clearance by rat liver. J Biol Chem 261: 10909–10914. 38. Sturrock A, Alexander J, Lamb J, Craven CM, Kaplan J (1990) Characterization
of a transferrin-independent uptake system for iron in HeLa cells. J Biol Chem 265: 3139–3145.
39. Mwanjewe J, Martinez R, Agrawal P, Samson SE, Coughlin MD, et al. (2000) On the Ca2+
dependence of non-transferrin-bound iron uptake in PC12 cells. J Biol Chem 275: 33512–33515.
40. Mwanjewe J, Grover AK (2004) Role of transient receptor potential canonical 6 (TRPC6) in non-transferrin-bound iron uptake in neuronal phenotype PC12 cells. Biochem J 378: 975–982.
41. Schonfeld E, Yasharel I, Yavin E, Brand A (2007) Docosahexaenoic acid enhances iron uptake by modulating iron transporters and accelerates apoptotic death in PC12 cells. Neurochem Res 32: 1673–1684.
42. Gatto EM, Riobo N, Carreras MC, Poderoso JJ, Micheli FE (2002) Neuroprotection in Parkinson’s disease; a commentary. Neurotoxic Res 4: 141–145.
43. LeWitt PA (2008) Levodopa for the treatment of Parkinson’s disease. New Engl J Med 359: 2468–2476.
44. Herna´n MA, Takkouche B, Caaman˜o-Isorna F, Gestal-Otero JJ (2002) A meta-analysis of coffee drinking, cigarette smoking, and the risk of Parkinson’s disease. Ann Neurol 52: 276–284.
45. Karcz-Kubicha M, Antoniou K, Terasmaa A, Quarta D, Solinas M, et al. (2003) Involvement of adenosine A1and A2Areceptors in the motor effects of caffeine after its acute and chronic administration. Neuropsychopharmacology 28: 1281–1291.
46. Mally J, Stone TW (1994) The effect of theophylline on parkinsonian symptoms. J Pharm Pharmacol 46: 515–517.
47. Moreau JL, Huber G (1999) Central adenosine A(2A) receptors: an overview. Brain Res Rev 31: 65–82.
48. Kanda T, Tashiro T, Kuwana Y, Jenner P (1998) Adenosine A2Areceptors modify motor function in MPTP-treated common marmosets. Neuroreport 9: 2857–2860.
49. Pilla AA, Markov MS (1994) Bioeffects of weak electromagnetic fields. Rev Environ Health 10: 155–169.
50. McKay JC, Prato FS, Thomas AW (2007) A literature review: the effects of magnetic field exposure on blood flow and blood vessels in the microvasculature. Bioelectromagnetics 28: 81–98.
51. Taniguchi N, Kanai S, Kawamoto M, Endo H, Higashino H (2004) Study on application of static magnetic field for adjuvant arthritis rats. Evid Based Complement Alternat Med 1: 187–191.
52. Morris CE, Skalak TC (2007) Chronic static magnetic field exposure alters microvessel enlargement resulting from surgical intervention. J Appl Physiol 103: 629–636.
53. Colbert AP, Wahbeh H, Harling N, Connelly E, Schiffke HC, et al. (2009) Static magnetic field therapy: a critical review of treatment parameters. Evid Based Complement Alternat Med 6: 133–139.
54. Cunha RA, Constantino MD, Ribeiro JA (1997) ZM241385 is an antagonist of the facilitatory responses produced by the A2A adenosine receptor agonists CGS21680 and HENECA in the rat hippocampus. Br J Pharmacol 122: 1279–1284.
55. Jaakola V-P, Griffith MT, Hanson MA, Cherezov V, Chien EYT, et al. (2008) The 2.6 angstrom crystal structure of a human A2Aadenosine receptor bound to an antagonist. Science 322: 1211–1217.
56. Yang M, Soohoo D, Soelaiman S, Kalla R, Zablocki J, et al. (2007) Characterization of the potency, selectivity, and pharmacokinetic profile for six adenosine A2A receptor antagonists. Naunyn Schmiedebergs Arch Pharmacol 375: 133–144.
57. Nuccitelli S, Cerella C, Cordisco S, Albertini MC, Accorsi A, et al. (2006) Hyperpolarization of plasma membrane of tumor cells sensitive to antiapoptotic effects of magnetic fields. Ann New York Acad Sci 1090: 217–225.
58. De Nicola M, Cordisco S, Cerella C, Albertini MC, D’Alessio M, et al. (2006) Magnetic fields protect from apoptosis via redox alteration. Ann New York Acad Sci 1090: 59–68.
59. Rosen AD (2003) Mechanism of action of moderate-intensity static magnetic fields on biological systems. Cell Biochem Biophys 39: 163–173.
60. Braganza LF, Blott BH, Coe TJ, Melville D (1984) The superdiamagnetic effect of magnetic fields on one and two component multilamellar liposomes. Biochim Biophys Acta 801: 66–75.
61. Rosen AD (2003) Effect of 125 mT static magnetic field on the kinetics of voltage activated Na+
channels in GH3 cells. Bioelectromagnetics 24: 517–523. 62. Hove-Madsen L, Prat-Vidal C, Llach A, Ciruela F, Casado V, et al. (2006)
Adenosine A2A receptors are expressed in human atrial myocytes and modulate spontaneous sarcoplasmic reticulum calcium release. Cardiovasc Res 72: 292–302.
63. Wyatt AW, Steinart JR, Wheeler-Jones CP, Morgan AJ, Sugden D, et al. (2002) Early activation of the p42/p44MAPK pathway mediates adenosine-induced nitric oxide production in human endothelial cells: a novel calcium-insensitive mechanism. FASEB J 16: 1584–1594.
64. Brambilla R, Cottini L, Fumagalli M, Ceruti S, Abbracchio MP (2003) Blockade of A2A adenosine receptors prevents basic fibroblast growth factor-induced reactive astrogliosis in rat striatal primary astrocytes Glia 43: 190–194. 65. Popoli P, Blum D, Martire A, Ledent C, Ceruti S, et al. (2007) Functions,
dysfunctions and possible therapeutic relevance of adenosine A2Areceptors in Huntington’s disease. Prog Neurobiol 81: 81.
66. Takahashi RN, Pamplona FA, Prediger RDS (2008) Adenosine receptor antagonists for cognitive dysfunction: a review of animal studies. Front Biosci 13: 2614–2632.
67. Engstro¨m S, Markov MS, McLean MJ, Holcomb RR, Markov JM (2002) Effects of non-uniform static magnetic fields on the rate of myosin phosphorylation. Bioelectromagnetics 23: 475–479.
69. Okano H, Tomita N, Ikada Y (2007) Effects of 120 mT static magnetic field on TGF-b1-inhibited endothelial tubular formation in vitro. Bioelectromagnetics 28: 497–499.
70. Okano H, Tomita N, Ikada Y (2008) Spatial gradient effects of 120 mT static magnetic field on endothelial tubular formation in vitro. Bioelectromagnetics 29: 233–236.
71. Rozen S, Skalesky HJ (2000) Primer3 on the WWW for general users and for biologist programmers. In: Krawetz S, Misener S, eds. Bioinformatics Methods and Protocols: Methods in Molecular Biology. Totowa, NJ: Humana Press. pp 365–386.
72. Wang Z, Sun Z, Li AV, Yarema KJ (2006) Roles for GNE outside of sialic acid biosynthesis: modulation of sialyltransferase and BiP expression, GM3 and GD3 biosynthesis, proliferation and apoptosis, and ERK1/2 phosphorylation. J Biol Chem 281: 27016–27028.
73. Livak KJ, Schmittgen TD (2001) Analysis of relative gene expression data using real-time quantitative PCR and the 2-DDCT
method. Methods 25: 402–408. 74. Cen S, Guo F, Niu M, Saadatmand J, Deflassieux J, et al. (2004) The interaction
between HIV-1 Gag and APOBEC3G. J Biol Chem 279: 33177–33184.
75. Strehler BL (1974) Adenosine-59-triphosphate and creatine phosphate determi-nation with luciferase. In: Bergemeyer HU, ed. Methods of Enzyme Analysis. New York, New York: Academic Press. pp 2112–2113.
76. Zhang Y, Geiger JD, Lautt WW (1991) Improved high-pressure liquid chromatographic-fluorometric assay for measurement of adenosine in plasma. Am J Physiol 260: G658–G664.
77. Tracey WR, Linden J, Peach MJ, Johns RA (1990) Comparison of spectrophotometric and biological assays for nitric oxide (NO) and endotheli-um-derived relaxing factor (EDRF): nonspecificity of the diazotization reaction for NO and failure to detect EDRF. J Pharmacol Exp Ther 252: 922–928. 78. Riemer J, Hoepken HH, Czerwinska H, Robinson SR, Dringen R (2004)
Colorimetric ferrozine-based assay for the quantitation of iron in cultured cells. Anal Biochem 331: 370–375.
79. Petrov E, Martinac B (2007) Modulation of channel activity and gadolinium block of MscL by static magnetic fields. Eur Biophys J 36: 95–105.
80. Triantafilou M, Morath S, Mackie A, Hartung T, Triantafilou K (2004) Lateral diffusion of Toll-like receptors reveals that they are transiently confined within lipid rafts on the plasma membrane. J Cell Sci 17: 4007–4014.
81. Zhang X, Min X, Yang F (1998) Conformational basis of the phospholipid requirement for the activity of SR Ca2+