Conformational Sampling and Binding Site
Assessment of Suppression of Tumorigenicity
2 Ectodomain
Chao-Yie Yang1*, James Delproposto2, Krishnapriya Chinnaswamy2, William Clay Brown2, Shuying Wang3, Jeanne A. Stuckey2,4, Xinquan Wang5
1Department of Internal Medicine, Hematology and Oncology Division, University of Michigan, Ann Arbor, Michigan, 48109, United States of America,2Life Sciences Institute, University of Michigan, Ann Arbor, Michigan 48109, United States of America,3Department of Microbiology and Immunology, National Cheng Kung University Medical College, Tainan 701, Taiwan; and Center of Infectious Disease and Signaling Research, National Cheng Kung University, Tainan 701, Taiwan,4Biological Chemistry, University of Michigan, Ann Arbor, Michigan 48109, United States of America,5Ministry of Education Key Laboratory of Protein Science, Center for Structural Biology, School of Life Sciences, Tsinghua University, Beijing 100084, China
Abstract
Suppression of Tumorigenicity 2 (ST2), a member of the interleukin-1 receptor (IL-1R) fam-ily, activates type 2 immune responses to pathogens and tissue damage via binding to IL-33. Dysregulated responses contribute to asthma, graft-versus-host and autoinflammatory diseases and disorders. To study ST2 structure for inhibitor development, we performed the principal component (PC) analysis on the crystal structures of IL1-1R1, IL1-1R2, ST2 and the refined ST2 ectodomain (ST2ECD) models, constructed from previously reported small-angle X-ray scattering data. The analysis facilitates mapping of the ST2ECDconformations to PC subspace for characterizing structural changes. Extensive coverage of ST2ECD con-formations was then obtained using the accelerated molecular dynamics simulations started with the IL-33 bound ST2ECDstructure as instructed by their projected locations on the PC subspace. Cluster analysis of all conformations further determined representative conformations of ST2ECDensemble in solution. Alignment of the representative conforma-tions with the ST2/IL-33 structure showed that the D3 domain of ST2ECD(containing D1-D3 domains) in most conformations exhibits no clashes with IL-33 in the crystal structure. Our experimental binding data informed that the D1-D2 domain of ST2ECDcontributes predomi-nantly to the interaction between ST2ECDand IL-33 underscoring the importance of the D1-D2 domain in binding. Computational binding site assessment revealed one third of the total detected binding sites in the representative conformations may be suitable for binding to potent small molecules. Locations of these sites include the D1-D2 domain ST2ECDand modulation sites conformed to ST2ECDconformations. Our study provides structural models and analyses of ST2ECDthat could be useful for inhibitor discovery.
OPEN ACCESS
Citation:Yang C-Y, Delproposto J, Chinnaswamy K, Brown WC, Wang S, Stuckey JA, et al. (2016) Conformational Sampling and Binding Site Assessment of Suppression of Tumorigenicity 2 Ectodomain. PLoS ONE 11(1): e0146522. doi:10.1371/journal.pone.0146522
Editor:Claudio M Soares, Instituto de Tecnologica Química e Biológica, UNL, PORTUGAL
Received:November 2, 2015
Accepted:December 20, 2015
Published:January 6, 2016
Copyright:© 2016 Yang et al. This is an open access article distributed under the terms of the
Creative Commons Attribution License, which permits unrestricted use, distribution, and reproduction in any medium, provided the original author and source are credited.
Data Availability Statement:All relevant data are within the paper and its Supporting Information file.
Introduction
Suppression of Tumorigenicity 2 (ST2), is a member of the interleukin-1 receptor (IL-1R) fam-ily[1]. Two ST2 isoforms, i.e. the membrane-bound ST2[2] and the alternatively spliced soluble ST2 (sST2)[3,4], have been well studied. Binding of the membrane-bound ST2 with IL-33 (the only known ligand) leads to their association with IL-1RAcP; thereby, activating the down-stream MyD88, p38 and NF-κB regulated genes[5] known as the ST2/IL-33 axis. Soluble ST2 circulates in blood and contains the same ectodomain as ST2 that binds with IL-33. Activation of ST2/IL-33 axis on T helper 2 (TH2) cells results in the release of TH2 associated cytokines including IL-4, IL-5, IL-13 and IL-9[6]. The TH2 associated cytokines cause accumulation of eosinophil and promote TH2 cells polarization[7]. While ST2/IL-33 signaling is important for TH2 immune response to tissue repair and helminth infection[8], it has been associated with immunity-related diseases including asthma, allergy, cardiovascular disease, central nervous system disease, pain and arthritis[9]. For example, an excessive TH2 cells immune response from ST2/IL-33 signaling[10] was found in some type of asthma patients[11]. In another case, Miller et. al. [12] showed exogenous administration of IL-33 shifts TH1 to TH2 response via the ST2/IL-33 axis which alleviated inflammation in a mouse model of atherosclerosis. In alloge-neic hematopoietic stem cell transplantation, elevated level of sST2 in plasma is a predicted risk factor to the graft-versus-host disease (GVHD) mortality[13]. For GVHD, sST2 (as a decoy receptor) attenuates the IL-33 pool available for the membrane-bound ST2 to dampen TH2 response. The resulting polarization towards the TH1 population contributes to severe gas-trointestinal tract damages in acute GVHD[14] and mortality.
Because ST2/IL-33 signaling is associated with multiple pathological diseases, the pathway has emerged as a novel therapeutic target[9,15]. Direct intervention of ST2 and IL-33 binding by inhibitors can prevent downstream signaling activation of TH2 response. Alternatively, the molecules can alter the pool of IL-33 in plasma by releasing IL-33 from sST2 to bind with the membrane-bound ST2 in different tissues and modulate TH2 response. Currently, no small molecules or protein-based therapeutics to inhibit IL-33 binding with ST2 have been reported or approved, likely due to the late discovery of IL-33[6]. In comparison, many antibody-based therapies to target IL-1R1 (a founding member of IL-1R family)/IL-1βsignaling pathway have
been reported[16]. They include FDA-approved Anakinra (an analog of the IL-1R antagonist, IL-1Ra)[17] and Canakinumab (an anti-IL-1βmonoclonal antibody)[18] for treating
rheuma-toid arthritis and cryopyrin-associated periodic syndromes. Therapeutic options to target the ST2/IL-33 axis can be anticipated in near future.
In inhibitor development, target structures provide insights to identify important interac-tions with their ligands and rationales to design inhibitors[19,20]. ST2 and sST2 both share the same ectodomain (sequence: 1–323, denoted as ST2ECD) which consists of three immunoglob-ulin-like domains called D1, D2, and D3. Only one structure of the ST2/IL-33 complex is avail-able which shows ST2ECDinteracts with IL-33 using all D1-D3 domains[21]. We analyzed the structure and found the contact surface area between ST2 and IL-33 is 3631.5 Å2(typical for protein-protein interaction[22] but challenging for small molecule inhibitor development). Although site-directed mutagenesis experiments indicated that two residues (D149, E165) of IL-33 at the interface contribute significantly to ST2/IL-33 interaction[21,23], yet it remains to be determined if the site interacting with D149 and E165 can bind with potent small molecules. Besides the ST2/IL-33 crystal structure, previous studies[21,23] also suggested that the D1-D2 domain of ST2 is rigid whereas the D3 domain is highly mobile. This was supported by that the D3 domain of the ST2ECDmodels derived from small-angle X-ray scattering (SAXS) data by Liu et. al. [21] displays three different orientations but not the D1-D2 domain. We examined these ST2ECDmodels and found an unfavorable interaction between a loop and the D3 domain CA046592) by the use of the following Cancer Center
Core: Center of Structural Biology.
which prohibits follow-up investigation. While these data elucidate structural information of ST2, feasibility of binding between ST2 and small molecule ligands has not been explored. Recently, we reported that the flexible inter-domain motion in IL-1R type 1 (IL-1R1) ectodo-main is ectodo-mainly between the D2 and the D3 doectodo-main of IL-1R1[24]. Our previous study impli-cated a full structural characterization of ST2ECDensemble conformations will be necessary to identify and assess potential small molecule binding sites of ST2ECD.
In this work, we generated conformational ensemble of ST2ECDusing the efficient acceler-ated molecular dynamics (aMD) conformational sampling method starting with the well-defined IL-33-bound ST2ECDstructure. ST2ECDconformations were analyzed based on princi-pal component analysis (PCA) of the IL-1R1/2, ST2 crystal structures and the refined ligand-free ST2ECDmodels using previously collected small-angle X-ray scattering (SAXS) data. Clus-ter analysis of the conformations was then carried out to select representative ST2ECDmodels. Comparison of the representative conformations with ST2/IL-33 and the experimental binding data both suggested that the D1-D2 domain of ST2 plays a dominant role to interact with IL-33. Computational binding site assessment of the representative conformations further deter-mined locations in ST2ECDthat may interact with small molecules. Finally, we discussed the strategies to discover small molecule inhibitors targeting ST2ECD.
Materials and Methods
Crystal structures used in this study
All protein structures labeled with PDBIDs were obtained from the Protein Data Bank[25]. They included the protein complex structures of ST2/IL-33 (PDBID: 4KC3[21]), IL-1R1/IL-1β
(PDBID: 1ITB[26]), IL-1R1/IL-1β/IL-1RAcP (PDBID: 4DEP[27]), IL-1R1/IL-1Ra
(PDBI-D:1IRA[28]), IL-1R1/EBI-005 (PDBID: 4GAF[29]), IL-1R1/AF10847 (PDBID: 1G0Y[30]), and IL-1R2/IL-1β/IL-1RAcP (PDBID: 3O4O[31]). Among them, EBI-005 is an IL-1βchimera and
binds more potently to IL-1R1 than IL-1ß[29]. The ectodomains of IL-1R1/2 and ST2 were extracted from each structure for analysis. In the ST2 ectodomain structure, residues Q52-K55, E224-A231, Q272-N278 were unresolved. We modeled these missing segments using default parameters in the MOE[32] program. All proteins shown in the figures were prepared by UCSF Chimera program[33].
Generation of ST2
ECDmodels using AllosMod-FoXS
The ST2 crystal structure corresponding to K19-N323 was used as the template structure to construct the SAXS derived ST2ECDmodels. Missing residues in the crystal structure and the C-terminal Histag (six Histidine residues) were built using the MOE[32] program. All ST2ECD models were generated by the AllosMod-FoXS web server[34] by fitting to the SAXS data. The most probable models setting was selected in the model calculations. Single state and ensemble models of up to 4 states determined by MultiFoXS and Minimal Ensemble Search (denoted as MES) algorithms were saved for analysis. Theχvalues of fitting to the SAXS profile in
Multi-FoXS were 1.96, 1.87, 1.78, 1.76 and those in MES were 1.58, 1.43, 1.43, 1.43 in the one-, two-, three-, and four-state models respectively.
MD simulation setup
state of ionizable groups in ST2ECDunder the pH 7.4 physiological condition. The Amber 99SB force field parameters[35] were used for the amino acids and the TIP3P[36] model for water molecules. The physiological salt concentration at 150 mM of NaCl was adopted in the simula-tion. The protein was embedded in an octahedron water box in which the distance between any protein atom to the edge of the box was set at 15 Å. The overall charge of the system was set neutral. The GPU modification to PMEMD[37] from Amber (version 12)[38] was used in all MD simulations.
Preparation of the system for production run used the following procedures. A 3000-step minimization (steps 1–1000 using conjugated gradient followed by 2000 steps steepest decent) was first carried out. After minimization, a 50 ps constant volume and constant temperature (NVT) simulation was performed to raise the temperature of the system to 298K while con-straining all heavy atoms with a 5 kcal/mol/Å2force constant with reference to the starting conformation. Using a 1 kcal/mol/Å2force constant to constrain all heavy atoms, the system underwent eight additional simulating annealing type of temperature changes under isobaric (P = 1 atm) conditions. The procedures included series of 50 ps runs by changing the tempera-tures from 298K to 350K, 350K to 400K, 400K to 450K, 450K to 500K, 500K to 550K respec-tively. Then, a 100 ps run was done at T = 550K followed by 50 ps runs with the temperature decreasing from 550K to 425K and 425K to 298K. Finally, a one ns pre-equilibration run with T = 298K without any constraint to protein atoms was performed in the isobaric isothermal environment (NPT, T = 298K and P = 1 atm) before the production run. The SHAKE[39] algo-rithm was used to fix bonds involving hydrogen atoms. The Particle mesh Ewald method[40] was used and the non-bonded cutoff distance was set at 10 Å. The time step was 2 fs, and neighboring pairs list was updated every 20 steps.
For performing the accelerated MD (aMD) simulations, the first 2 ns production run based on the conventional MD (no modification of the potential energy function) was used to deter-mine the average values of the potential energy for the total system (Vtotal) and the dihedral angle energy of the proteins (Vdih). The threshold potential energy was defined as Vtotal + Natoms/5 (Natoms: total number of atoms in the system). Four threshold potential energies for the dihedral angle motion were used called AMD1, AMD2, AMD3 and AMD4 which were equal to Vdih + (number of residues) × 3.5, 4.2, 4.9, and 5.6 respectively. These parameters were taken as suggested by previous work[41]. A total simulation time of 120 ns was collected from 30 ns runs of aMD using AMD1-AMD4 parameters.
Principal component analysis and mean shift cluster analysis
The crystal structures of IL-1R1, IL-1R2, ST2 ectodomains used in the PCA were extracted from the complex structures of IL-1R1 with IL-1β(PDBID: 1ITB, chain B), IL-1Ra (PDBID: 1IRA, chain Y), AF10847 (PDBID: 1G0Y, chain R), EBI-005 (PDBID: 4GAF, chain B), IL-1β
and IL-1RAcP (PDBID: 4DEP, chains B and E), IL-1R2 with IL-1βand L-1RAcP (PPDBID: 3O4O, chain C), and ST2 with IL-33 (PDBID: 4KC3, chain B). ST2 models included in the PCA were the 1- and 3-state models determined from the MultiFoXS and MES algorithms in this work. A total of 15 structures were analyzed using the PCA implemented in the Bio3D ver-sion 2.0[42]. Detailed procedures of the PCA can be found at the Bio3D website (http:// thegrantlab.org/bio3d/) and our previous report[24].
The first seven PCs were then used in the mean shift cluster analysis provided in the Scikit-Learn program[43]. Mean shift cluster analysis is a nonparametric clustering method[44–46]. Unlike k-mean clustering method, the mean shift clustering requires no prior knowledge of the number of clusters in the multidimensional data. The algorithm classifies data points by mov-ing the data point via the density gradient defined by a kernel density estimator function with an assigned bandwidth until it reaches the maximum of a local density distribution called mode in pattern recognition. In our application here, each mode is the center of a cluster group. To perform the mean shift cluster analysis, snapshots of ST2ECDconformations at every 10 ps from the aMD simulations were included. The quantile value was varied from 0.01 to 0.20 in the bandwidth estimation to analyze the stability of the numbers of cluster groups. Con-formations closest to the centroid of each cluster group were selected to represent each cluster and denoted as representative conformations.
Sitemap analysis
We used Sitemap program[47] to perform small molecule binding site analysis on the protein conformations. The Sitemap program developed by Halgren[47] is an in silico method that detects the cavities in proteins and calculates their sizes, physicochemical properties (hydro-phobic surface, hydrogen bond acceptors, donors) probed by chemical atoms, solvent exposure that are important to analyze protein-ligand interaction. These properties were weighted to derive scoring functions (including Dscore) for evaluating the binding sites by training and testing to a dataset with known protein-ligand crystal structures and associated binding ties. The correlation between the calculated Dscore values and the experimental binding affini-ties of known ligands to their target proteins gives a measure to predict the likelihood of novel protein binding sites to bind with potent small molecules and the druggability of proteins.
Representative conformations determined by the cluster analysis were used in the Sitemap program[47] to identify potential small molecule binding sites. Each conformation was first pro-cessed in the Glide program[47] from the Maestro 9.7 program suite (Release 2014–1)[47] fol-lowed by the Sitemap analysis using default parameters. Up to five binding sites were saved for binding sites analysis. Druggability index of each binding site was based on the Dscore value in the Sitemap program. The volume of each binding site was calculated by the Sitemap program.
Protein expression and purification
Oligos for PCR construction were designed using Clone-manager (Scientific and Educational Software). IL-33 (residues 112–270) was cloned into an N-terminal His6-TEV expression vec-tor, which was then transformed into Rosetta2™(DE3) cells. Cultures were grown at 37°C to an
OD600of 1.2 in Terrific Broth, induced with 0.4 mM IPTG and expressed overnight at 20°C. Cells were lysed by sonication in 10 mM HEPES, pH 7.5, 150 mM NaCl, 0.1%β
-mercaptoetha-nol with protease inhibitors and cellular debris pelleted by centrifugation. The resulting super-natant was incubated with Ni-NTA resin (Qiagen) equilibrated with 10 mM HEPES, pH 7.5, 150 mM NaCl, 10 mM imidazole for 1 hr at 4°C and eluted with same buffer containing 300 mM imidazole. Tag removal occurred by dialyzing the eluate against 10 mM HEPES, pH 7.5, 150 mM NaCl and 1 mM DTT overnight at 4°C in the presence of TEV protease and incubat-ing the protein with an additional Ni-NTA column. The flow through containincubat-ing the protein was concentrated and loaded on to a Superdex 75 column (GE Heathcare) equilibrated with 10 mM HEPES, pH 7.5, 150 mM NaCl. The purified protein was stored at -80°C in the same buffer containing 10% glycerol.
Expression trials indicated that High-five cells infected for 72 hours displayed the best yield of secreted protein. The conditioned media from two 1 L infection cultures for each construct was pooled for purification. All ST2 constructs were purified with the protocol described below. Media containing the expressed ST2 constructs were incubated with Ni-NTA resin (Roche) pre-washed with 10 mM HEPES, pH 7.2 and 150 mM NaCl (denoted Buffer A) for 4 hours at 4°C using a magnetic stirrer. Bound media was collected in a column and washed with Buffer A. The ST2 proteins eluted with Buffer A contained 300 mM imidazole and were dialyzed over-night at 4°C against Buffer A with TEV protease. The protein solution was then reapplied to a Ni-NTA column to remove the tag, then concentrated and applied to a Superdex 200 column (GE Healthcare) equilibrated with Buffer A.
For Bio-layer interferometry, the purified ST2 proteins and IL-33 were biotinylated by dilut-ing the protein to 0.5 mg/mL in Buffer A, adddilut-ing an equimolar ratio of Biotin-PEO4 linker (Pierce PN 21329) and incubating on ice for 2 hours. Unbound linker was removed via dialysis against 50mM sodium phosphate and 300 mM NaCl, pH 7.5.
Bio-layer Interferometry
BLI experiments were performed using an OctetRED96 instrument from ForteBio. All experi-ments were conducted at 25°C using 10 mM HEPES, pH 7.5, 150 mM NaCl, 0.005% Tween 20, 100μM EDTA as the assay buffer. Assays were conducted in Greiner 96 well black flat-bottom
microplates and were continuously shaken at 1000 RPM before measurements. Biotinylated ST2 was first loaded onto the Streptavidin (SA) sensors for 10 minutes at 20μg/mL to achieve
complete loading saturation. Complete loading reduced nonspecific binding which occurred on unloaded sensors. Serial dilutions of IL-33 were prepared on the Greiner plates. For ST2ECD, new sensors were used for every IL-33 concentration due to slow dissociation. For ST2D1-D2, dissociation was complete in a short amount of time and sensors were reused between different IL-33 concentrations. In each sensorgram measurement, sensors loaded with ST2 were first equilibrated in the reference buffer for 10 minutes, then associated with IL-33 for 1 minute and dissociated for 1 minute for ST2D1-D2whereas the association and dissocia-tion times for ST2ECDwere 15 minutes, and 15 minutes up to 2 hours, respectively. 50
μg/mL
of biotinylated IL-33 was loaded onto sensors to serve as a negative-control parallel reference sensor. Raw kinetic data collected were processed using ForteBio data analysis software 7.1 and then analyzed in Prism 6.0 (GraphPad Software, La Jolla, California USA). Analysis of the data based on a 1:1 binding model gave konand koffvalues which yielded the calculated KDvalues.
Results and Discussions
Refined models of ST2
ECDbased on the SAXS data
A ST2 homology model was used previously[21] to derive three structural models by fitting to the SAXS data of ST2ECDemploying the minimum ensemble search (MES) algorithm in BIL-BOMD[49]. Examination of these models showed that a flexible loop (Q272 to N278, unre-solved in the ST2/IL-33 crystal structure) penetrated into the D3 domain. Further, the
distances between C238 and C282 in all three models were 21 Å which are incompatible with a disulfide bond distance observed in the crystal structure. The large distance separation between C238 and C282 originated from the ST2 homology model template and the lack of distance constraint between C238 and C282 in the model construction.
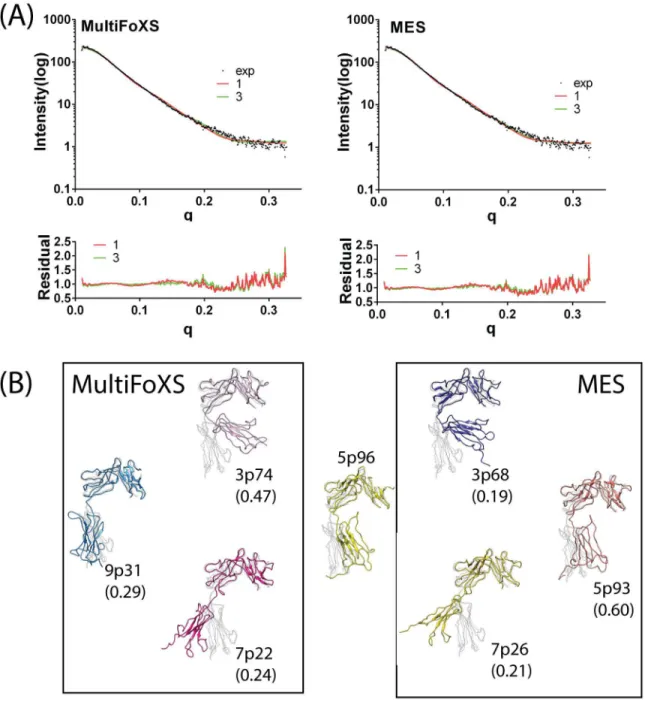
minimum ensemble search algorithm (denoted as MultiFoXS and MES respectively). Both independently developed algorithms were considered in our analysis to derive dominant ST2ECDconformations in the ensemble that fit with the SAXS data. The flexibility of ST2ECDin solution has been discussed previously. The Porod-Debye plot showed the loss of plateau (S1 Fig) and the Porod exponent is 3.5 at the linear region further suggested some degrees of flexi-bility in ST2ECD[50]. Because theχvalues between 3- and 4- state models improved only mar-ginally for MultiFoXS and MES, we adopted the 3-state models as the ensemble model for ST2ECDto avoid data overfitting in the 4-state models. Theχvalues of the 3-state model deter-mined by MultiFoXS and MES are similar (1.78 versus 1.43). The fitting curves and residual values between 1- and 3-state models from MultiFoXS and MES are provided inFig 1A.
The SAXS-derived 1- and 3-state models of ST2ECDdetermined by MultiFoXS and MES are shown inFig 1B. 5p96 represents the dominant 1-state model fit to the SAXS data. The 3-state models selected by MultiFoXS are 3p74(47%), 9p31(29%), and 7p22(24%) whereas those by MEM are 3p68(19%), 5p93(60%), and 7p26(21%). Visual inspection of the models suggested that similar conformations were found in the models determined by MultiFoXS and MES. For exam-ples, 3p74 and 3p68, 7p22 and 7p26 are similar, and 9p31 and 5p93 exhibit similar conformations to each other and to 5p96. More quantitative comparison will be discussed in the following sec-tion. Convergence of the backbone conformations derived from the SAXS data by two algorithms gave confidence that the models are representative ST2ECDconformations in solution.
Most models also showed reasonably close distances between matching pairs of 10 cysteine residues forming disulfide bonds. Exceptions were found in three models (9pm31, 3pm68, 5pm93) in which distances between C111 and C151 were 8.1, 8.1 and 11.2 Å. C111 and C151 are both in loop regions and have largest solvent accessible surface areas than the other eight cysteine residues according to the ST2 crystal structure. The bonding between C111 and C151 is expected to constrain the D1 and D2 domains in the dynamical motion of ST2 but not the overall backbone conformation of the three models. Alignment of these models with the ST2 crystal structure (Fig 1B) demonstrated that the flexibility of ST2ECDobserved in solution can be attributed to the orientational motion of the D3 domain with respect to the D1-D2 domain mediated by a loop (sequence: K203–S209) between the D2 and D3 domains similar to the IL-1R1 ectodomain[24]. Most models also resemble three previous models[21] except 7p22 and 7p26 in which the D3 domain swings further away from the D1-D2 domain.
Characterization of ST2
ECDconformations based on the principal
component analysis
conformations projected to the first three principal components (PC123) are displayed in all fig-ures despite that all PCs were included in the analysis.
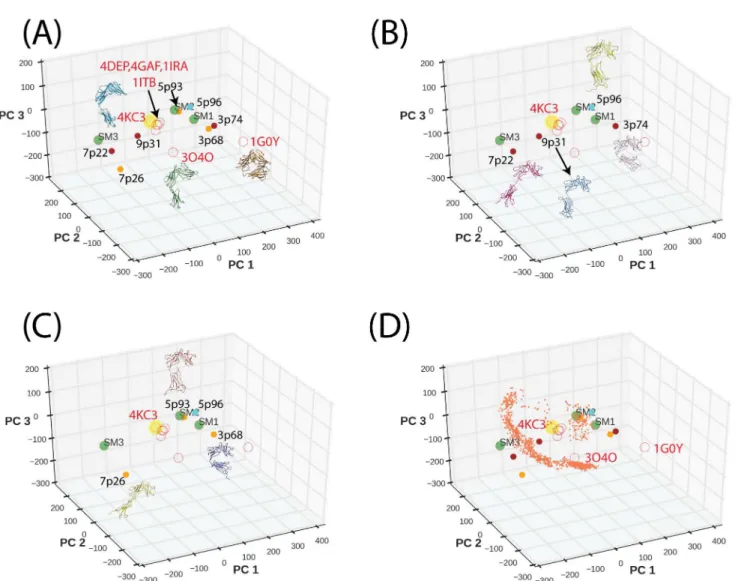
InFig 2A, we show that conformations of IL-1R1/2 and ST2 bound to IL-1β(PDBIDs:
1ITB, 4GAF) or 33 (PDBID: 4KC3) are mapped to the same region and the presence of IL-1RAcP did not influence the IL-1R1 conformation bound with IL-1β(PDBID: 4DEP). For the
antagonist IL-1Ra-bound IL-1R1 (PDBID: 1IRA), the D3 domain oriented slightly different from that in the IL-1β-bound IL-1R1 and was mapped to a nearby location. In comparison, the
IL-1R2 conformation (bound with IL-1RAcP and IL-1β(PDBID: 3O4O) was mapped further Fig 1. Models of ST2 fitted to the SAXS data using MultiFoXS and MES algorithms.(A) Fitting curves and residual plots of the 1-state and 3-state models based on MultiFoXS and MES. (B) ST2ECDmodels determined by MultiFoXS and MES. 5p96 is the 1-state model. Each model was aligned with the
IL-33 bound ST2 structure (grey). The number in the parentheses corresponds to the weight of each conformation in the 3-state model.
away from both ST2 and IL-1R1 along the PC2 degree of freedom. Our structural alignment indicated the D3 domain of IL-1R2 deviates more from that of IL-1R1. It is unclear whether the difference is associated with the IL-1RAcP binding because no other IL-1R2 structure is available. For the AF10847-bound IL-1R1 conformation (PDBID: 1G0Y), the D1 and D3 domains make close contact and its conformation was mapped to another location involving changes in PC1 and PC2 degrees of freedom.
The conformations and the projected locations of SAXS models determined by MultiFoXS and MES are shown inFig 2B and 2C. Their locations differ from the known crystal structures and cover a wider range of PC subspaces. Based on the proximity in location, we identified simi-lar conformations in 7p22/7p26, 3p74/3p68 and 5p93/5p96. Although three previous models were not included in the PCA, projection of their conformations to the PC subspace (green cir-cles) indicated that SM1 and SM2 are close to 5p93 and 3p74. This suggests that SM1 and SM2 captured major conformational shapes because 5p93 and 3p74 have the largest weights in the Fig 2. Projection of IL-1R1/2, ST2 crystal structures and ST2ECDmodels to the first three principal components subspace.(A) Projected locations of the crystal structures and the SAXS-derived ST2ECDmodels are shown in open and filled circles respectively. Brown circles are from MultiFoXS (B) and orange circles are from MES (C). PDBIDs of the crystal structures and the ST2ECDmodels are labeled close to the symbols. The yellow and green filled
circles denote the IL-33 bound ST2ECDstructure and three previously reported ST2ECDmodels respectively. (D) Projection of the ST2ECDconformations
obtained from 22 ns of MD simulations.
3-state models. We next projected the ST2ECDconformations collected from 22 ns of MD simu-lation to the PC subspace inFig 2D(orange circles). The data showed that the IL-33-bound ST2ECDquickly relaxed from the initial conformation and underwent circular motion mostly along the PC2 degree of freedom.Fig 2also demonstrated the complementarity between the crystal structures and the SAXS-derived ST2ECDmodels to characterize ST2ECDconformations.
Conformational sampling of ST2
ECDusing the accelerated MD method
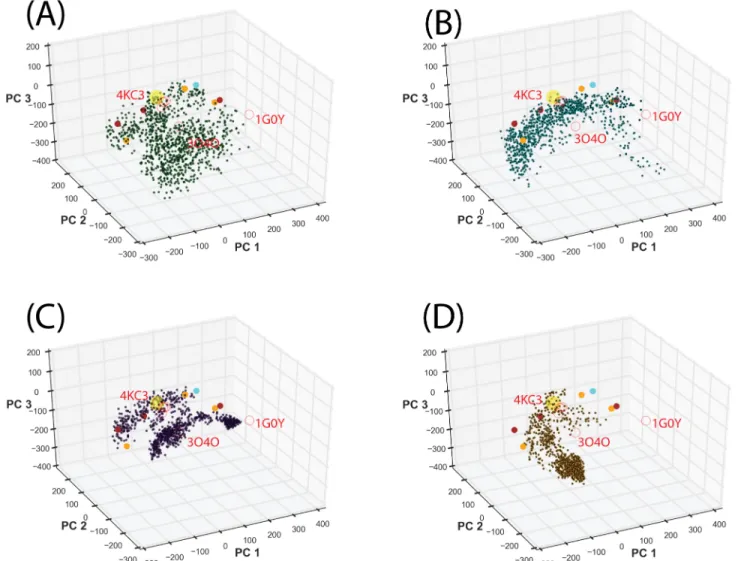
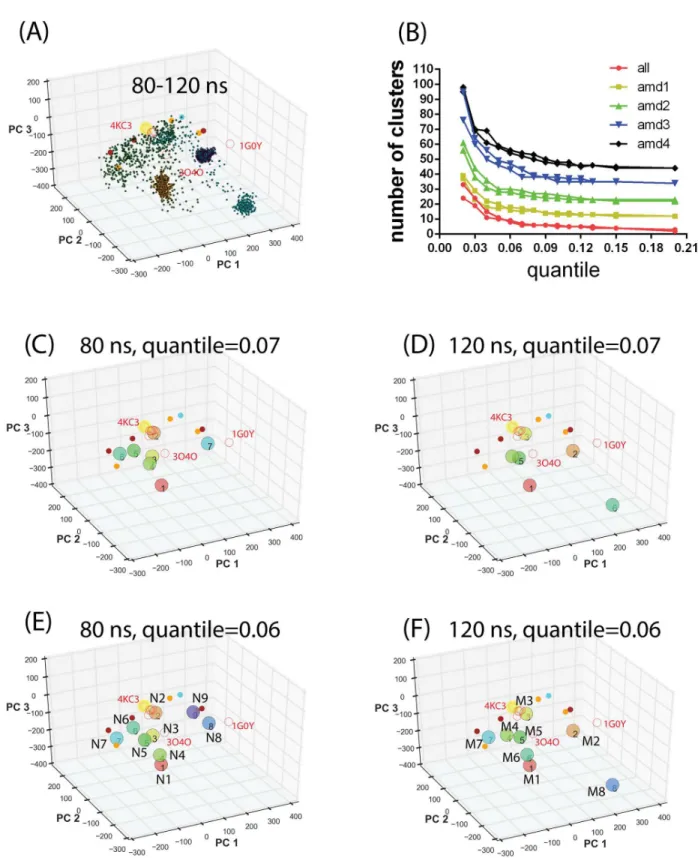
Fig 2Ddemonstrated an example of limited conformational sampling using conventional MD simulations. To overcome local conformational sampling and access higher energy states com-patible with ligand binding[55], we performed the accelerated MD (aMD) sampling[41] start-ing with the IL-33 bound ST2ECDcrystal structure. We have previously shown that aMD allows more efficient conformational sampling of IL-1R1 ectodomain than the conventional MD simulations for the same length of simulation time[24]. This was attributed to the adjust-ment of the potential energy function which allows the protein to cross energy barriers during simulations. Here, we used four sets of parameters in the aMD simulations, denoted by AMD1-4, to progressively produce shallower energy wells and access conformations separated by higher energy barriers in the energy landscape.Fig 3Ashows that the AMD1 parameters allowed efficient and diverse conformational sampling when compared with those obtained from conventional MD simulations (cf.Fig 2D). Although parameters based on AMD2-4 pro-vided conformational sampling of ST2ECDin different PC subspaces, yet they are more local-ized. Combining ST2ECDconformations from all 4 sets of parameters indicated that they provide broad coverage of PC subspace guided by the locations of the crystal structures and the SAXS-derived models. While the crystal structures cover some of the ligand-bound conforma-tions, the SAXS-derived models represent the ligand-free ST2ECDconformations in solution.Each aMD simulation was extended by another 10 ns to determine the convergence of the sampling. Projections of the conformations from the extended simulations, shown inFig 4A, indicated that the sampling using the AMD1 parameters remains diverse in the PC subspace while the conformations sampled using the AMD2-4 parameters were trapped to three separate localized regions. This suggested that conformations collected from a total of 80 ns simulations using AMD1-4 parameters covered the majority of the PC subspace and the extended 40 ns simulations gave only minor additional coverage of the PC subspace. To visualize the diverse ST2ECDconformations obtained from the aMD sampling, we performed the mean shift cluster analysis to group similar conformations in the PC subspace into the same cluster. Each cluster group in the conformational ensemble of ST2ECDis represented by the conformations corre-sponding to the centroid of the cluster.
and 6 inFig 4Cor clusters 1, 4 and 5 inFig 4D. The change of theM2location and emergence ofM8betweenFig 4F and 4Ecan be attributed to increased conformational populations in the
PC subspaces from the extended sampling simulations as shown inFig 4A. Comparison betweenFig 4E and 4Findicated variations in the locations ofN8,N9, M2,andM8but not
other cluster groups. This reflects that increased population of certain localized states in the extended aMD simulations may bias the mean shift cluster analysis to select these stationary states. To retain the diversity of representative conformations, we includedN1-N9andM1
-M8in the subsequent analysis.
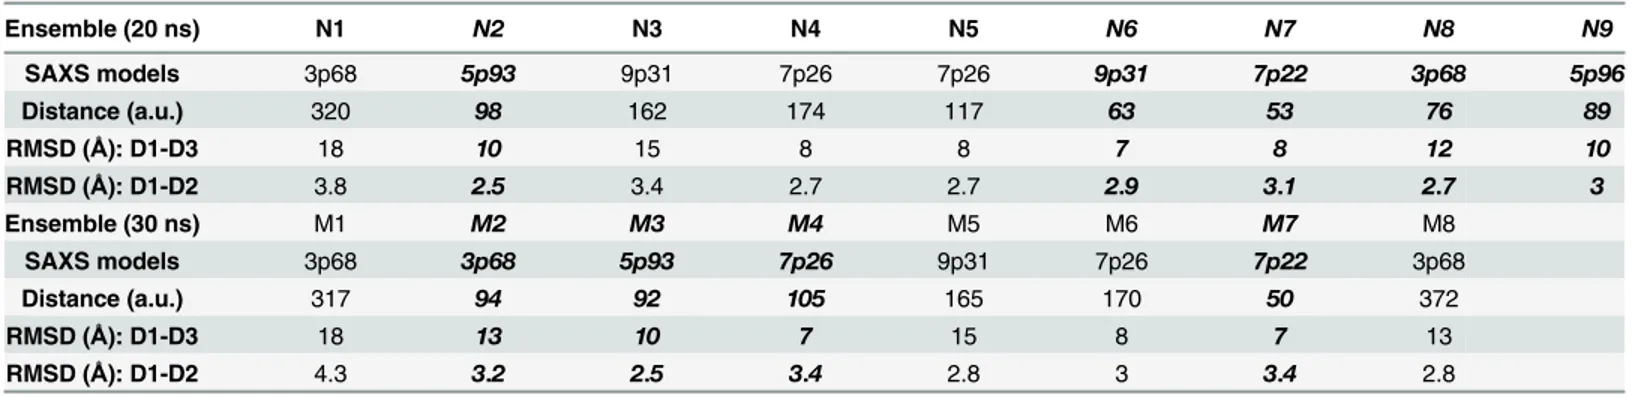
To determine the relation between these representative conformations with the SAXS mod-els, we calculated the Euclidean distances between them as listed inTable 1. Because these con-formations are projected to the PC subspace, the Euclidean distance is not directly related to distance in angstrom for interpretation. However, if we use the distance of less than 100 a.u. in Table 1to infer the closeness between conformations, we found that 9 of 17 representation con-formations are close to some of the SAXS derived models (shown in bold italic fonts in
Fig 3. Projection of ST2ECDconformations obtained from a total of 80 ns aMD simulations to the PC subspace.Projections of ST2ECDconformations
obtained from the aMD simulations using (A) AMD1, (B) AMD2, (C) AMD3, (D) AMD4 parameters. Yellow, red and filled circles represent the projected locations of ST2/IL-33, IL-1R1/2 crystal structures and the SAXS-derived models respectively.
Fig 4. Projection of ST2ECDconformations obtained from aMD simulations and the mean shift cluster analysis.(A) Projection of conformations corresponding to 20–30 ns of each aMD simulations colored according to different sets of parameters (seeFig 3). (B) Stability analysis of the number of cluster groups determined by the mean shift cluster analysis. (C-F) Centroids of cluster groups determined by the mean shift clustering using conformations from a total of 80 or 120 ns aMD simulations and the quantile values of 0.06 and 0.07. Yellow circles, red circles and filled circles denote the projected locations of ST2/IL-33, IL-1R1/2 crystal structures and the SAXS-derived models. The centroids of cluster groups 1–9 and 1–8 in (E) and (F) are relabeled as
N1-N9andM1-M8respectively.
Table 1). Based on this analysis, the ensemble of conformations obtained from aMD recapitu-lates the states represented by most of the SAXS derived models except 3p74. Backbone RMSD values of the D1-D3 domain between the Ensemble and the SAXS models also parallel their distances in PCA subspace. The backbone RMSD values of the D1-D2 domain between the models are between 2.5 and 4.3 Å comparable to dynamical fluctuation. Larger RMSD values of the D1-D3 domain (seeTable 1) are attributed to the twisted D3 domain relative to the D1-D2 domain. A small twisted angle between domains tends to give a larger RMSD value. Furthermore, aMD sampled additional conformational spaces presumably lower populated ST2 conformations not characterized by either the crystal structures or SAXS derived models.
The conformational ensemble of ST2
ECDand their binding with IL-33
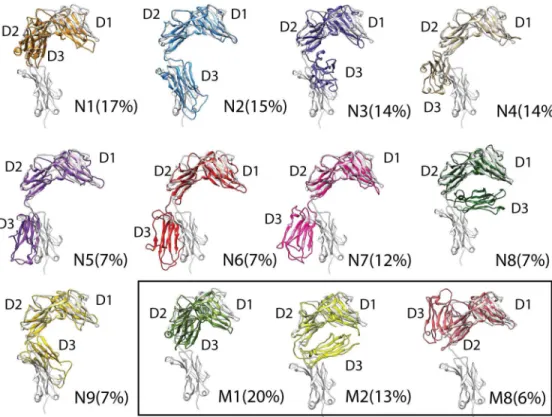
Alignment of ST2ECDconformations corresponding toN1-N9, M1, M2,andM8with the IL-33 bound ST2 crystal structure are shown inFig 5. The comparison further reaffirmed that the flexibility of ST2ECDis attributed to the relative motion of the D3 domain to the D1-D2 domain. Three conformations (M1,M2,M8) corresponding to the trapped regions in the extended simulations from 80 to 120 ns (Fig 4A) are also provided. Of note, the D3 domain in
N1andM2are in opposite orientation relative to the D1-D2 domain. AlthoughN8,N9and
M8are close to each other in the PC subspace, the D3 domain exhibits substantial differences in orientation. This partly reflects the ruggedness of the energy landscape in this location of the PC subspace.
Fig 5gives a depiction of the conformational ensemble of ST2ECDand theoretical pre-exist-ing conformations without ligand bindpre-exist-ing. Visualization of these conformations inspired us to investigate if some of them may bind with IL-33. Alignment of the D1-D2 domain ofN1-N9
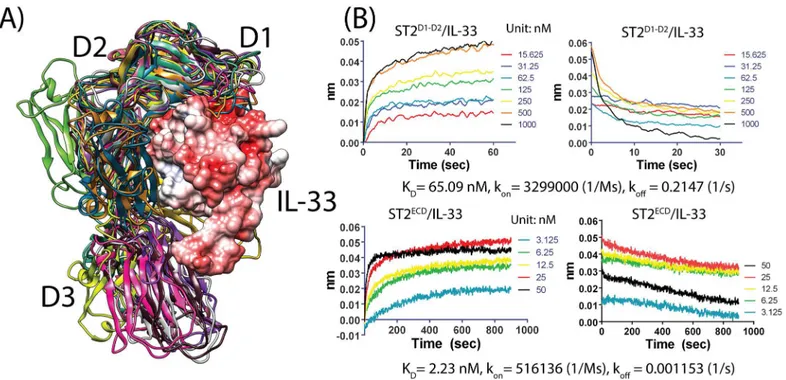
andM1-M8to the ST2ECD/IL-33 crystal structure showed that the D3 domain of 11 models
(N1,N4,N5,N6,N7, N9, M1, M4, M6, M7,andM8) exhibited minimal clashes with IL-33
from the ST2ECD/IL-33 structure (seeFig 6A). The observation led us to study the contribution of the D1-D2 domain to the binding between ST2ECDand IL-33. Using the Bio-Layer Interfer-ometry (BLI)-based assay, we measured the binding affinities of IL-33 with ST2 containing the D1-D3 domain (sequence: 19–323, ST2ECD) and the D1-D2 domain only (sequence: 19–206, ST2D1-D2). We determined that the KDvalues of ST2ECD/IL-33 and ST2D1-D2/IL-33 are 2.23 and 65.09 nM corresponding to binding free energies of -11.79 and -9.80 kcal/mol respectively. Our KDvalue between ST2ECDand IL-33 is comparable to 5 nM and 0.5
–0.8 nM previously determined by the isothermal titration calorimetry assay[23] and the Biacore assay[21,23]. Table 1. Euclidean distances between N1-N9, M1-M8 and the SAXS derived model conformations in the PC subspace.The distance in PCA sub-space is calculated using the coefficients of the PC vectors of each conformation projected to the PC subsub-space and is in arbitrary units (a.u.). RMSD calcula-tions are based on the Cα, C and N atoms of the protein backbone. The states shown in bold italic font are close to nearby SAXS derived models with
distances of less than 100.
Ensemble (20 ns) N1 N2 N3 N4 N5 N6 N7 N8 N9
SAXS models 3p68 5p93 9p31 7p26 7p26 9p31 7p22 3p68 5p96
Distance (a.u.) 320 98 162 174 117 63 53 76 89
RMSD (Å): D1-D3 18 10 15 8 8 7 8 12 10
RMSD (Å): D1-D2 3.8 2.5 3.4 2.7 2.7 2.9 3.1 2.7 3
Ensemble (30 ns) M1 M2 M3 M4 M5 M6 M7 M8
SAXS models 3p68 3p68 5p93 7p26 9p31 7p26 7p22 3p68
Distance (a.u.) 317 94 92 105 165 170 50 372
RMSD (Å): D1-D3 18 13 10 7 15 8 7 13
RMSD (Å): D1-D2 4.3 3.2 2.5 3.4 2.8 3 3.4 2.8
Based on our data, the D1-D2 domain of ST2ECDcontributed 83% to the binding free energy between ST2ECDand IL-33. We also observed 6 versus 186 fold differences in konand koffrate between ST2ECD, ST2D1-D2and IL-33 (ST2ECD: kon= 5.161051/Ms, koff= 0.001153 1/s, ST2D1-D2: kon= 3.2991061/Ms, koff= 0.2147 1/s (seeFig 6B). The much closer association rates between ST2ECD, ST2D1-D2and IL-33 support the hypothesis that relatively abundant ST2ECDconformations in thermodynamic equilibrium can bind effectively with IL-33 via the D1-D2 domain initially. The adaptation of the D3 domain to IL-33 follows to achieve a high affinity between ST2ECDand IL-33.
Binding sites analysis of the representative conformations of ST2
ECDusing Sitemap
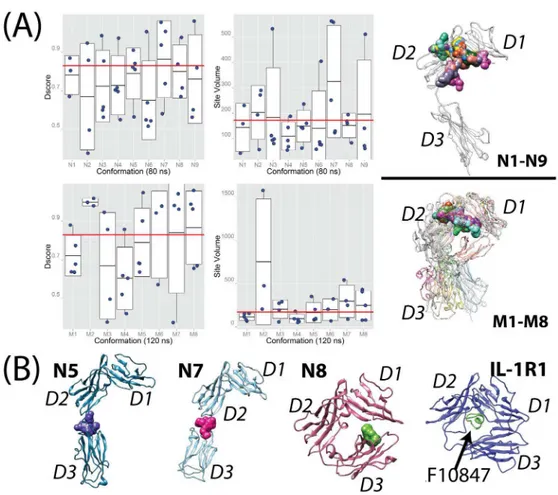
Structures of the representative conformations permit identification and assessment of small molecule binding sites in ST2ECD. For this analysis, we used the Sitemap[56] program. Sitemap has been used to identify potential allosteric modulator sites in IL-1R1 in our previously report [24], in the druggability analysis of Bromodomain proteins[57], and in the protein-protein interaction sites evaluation[58]. Here, we examined two indexes from the Sitemap analysis, i.e. Dscore (defined below) and the volume of the binding sites (Site Volume) as shown inFig 7A. The Dscore value is an overall assessment of the likelihood that the identified binding site can interact with small molecules. Previous evaluation of Sitemap on a set of co-crystal structures with known inhibitor affinities suggested that a binding site assessed with a Dscore0.83 is "druggable"[56]. Although this measure does not account for the adaptability of the binding site to ligand binding, it prioritizes binding sites for follow-up investigation. Using this value, Fig 5. Conformations closest to the centroids of the cluster groups from mean shift cluster analysis.
Each conformation was aligned to the IL-33 bound ST2 structure (grey color). The D1, D2, D3 domains of each conformation are labeled.
we found that 15 of 41 sites inN1-N9and 18 of 34 sites inM1-M8were classified as druggable sites (seeFig 7A) corresponding to 37% and 53% of all detected sites respectively. Greater than 50% of these druggable sites have site volumes less than 300 Å3. Nine druggable sites have vol-umes between 400 and 550 Å3. Three druggable sites detected in M2 have much higher Dscore values and larger site volumes. This is attributed to that M2 adopts a conformation similar to the AF10847-bound IL-1R1 structure in which D3 is in close contact with D1. BecauseN1-N9
andM1-M8are representative ST2ECDconformations from the conformations obtained from the aMD simulations, we expect that at least a third of detected small molecule binding sites are druggable in the conformational ensemble of ST2ECD.
Analysis of the druggable binding sites revealed two common locations in ST2ECD. Majority of the druggable sites are located at the interface between the D1 and D2 domains for all con-formations analyzed as shown inFig 7A. Two conformations,N5andN7, in which the D3 domain adopted a stretched orientation revealed a potential druggable site at the interface between the D2 and D3 domains (Fig 7B). Besides the two common locations, the D1 domain is close to the D3 domain inN8and formed a binding site suitable for small molecule binding (green envelop shape inFig 7B). Conformation ofN8is similar to the AF10847-bound IL-1R1 structure and the location of the druggable site between the D1 and D3 domains inN8 resem-bles that identified in IL-1R1[24]. Whether antagonistic peptides analogous to AF10847 or small molecules can be found to bind with ST2ECDadopting theN8conformation remains to be determined. Among these druggable sites, the sites at the interface between the D1 and D2 domains frequently gave the highest Dscore value and were also larger in size. The shape of the sites at the interface between the D2 and D3 domains however show greater variability and are dictated by the relative orientation between the D2 and D3 domains.
Fig 6. Alignment of the 12 representative conformations with ST2/IL-33 and the binding data of ST2 with IL-33.(A) The D3 domains of the 11 conformations exhibit few clashes with IL-33 after alignment with the ST2/IL-33 structure. IL-33 is shown in surface representation and colored according to the electrostatic charge map where red and white color correspond to negative and neutral charged regions. (B) Binding data between ST2D1-D2, ST2ECDand IL-33 using Octet RED biolayer interferometry. Concentrations of IL-33 in nM used in the experiment, KD, konand koffare provided.
Conclusion
Small-angle X-ray scattering has been widely used to investigate protein conformations in solu-tion[59,60]. Structural models constructed by fitting to the SAXS data gave additional informa-tion of the protein conformainforma-tions in soluinforma-tion to corroborate with crystal structures or NMR data. They can be particularly valuable to provide architectures of protein conformations in solution when NMR structures are unavailable for large proteins or protein complexes. In this study, we incorporated the backbone conformations from the SAXS-derived models (ligand-free) with crystal structures (ligand-bound) in the PCA to construct the conformational space of ST2ECDfor analyzing the conformations obtained from MD simulations. Four sets of param-eters were used in the aMD simulations to efficiently sample the ST2ECDconformations start-ing with the IL-33 bound ST2ECDstructure. Examination of the conformations projected to the first three principal components confirmed the extensive coverage of ST2ECDconformational space from simulations. Application of the mean shift cluster analysis to all conformations identified cluster groups to represent the conformational ensemble of ST2ECD. Comparison of Fig 7. Binding sites evaluation of the representative conformations of ST2ECD.(A) Dscore values and Site volumes detected inN1-N9andM1-M8where the red lines represent Dscore = 0.83 (the druggable value) and Site Volume = 172Å3(the average value for the sites in the IL-33 bound ST2ECDcrystal structure)
respectively. Druggable sites detected at the interface between the D1 and D2 domains are shown as surface shapes. The upper structure shows the druggable sites found inN1-N9using the IL-33 bound ST2 structure as a reference, and the lower one shows those found inM1-M8where all conformations were aligned. (B) Locations of druggable sites at the D2-D3 interface identified inN5andN7are colored as blue and pink. A unique site (green) between the D1 and D3 domains found inN8is shown and compared with the AF10847-bound IL-1R1 crystal structure.
conformations at the centroid of each cluster group with ST2/IL-33 structure depicted the high mobility between the D1-D2 and D3 domains.
Alignment of ST2/IL-33 structure with the representative conformations further suggested that D3 of ST2ECDin solution may not interfere with the initial binding between IL-33 and the D1-D2 domain. Experimental binding affinity measurement demonstrated that the D1-D2 domain of ST2ECDcontributes 83% of binding free energy between ST2ECDand IL-33. We pro-posed a model of the binding event in which the D1-D2 domain of ST2ECDinitially recognizes IL-33 followed by the adaptation of the D3 domain mediated by the loop between the D2 and D3 domains. IL-1R1, another member of IL-1R family, also has the D1-D3 domains, and previous studies reported that the binding affinities (KD) of the D1-D2 domain of IL-1R1 to IL-1α, IL-1β
and IL-1Ra are 7μM,>10μM and 28 nM respectively[28] whereas the KDof the D1-D3 domain of IL-1R1 with IL-1βis 2 nM[29]. IL-1Ra was further shown to interact primarily with the D1-D2 domain of IL-1R1 in a crystal structure[28]. The D1-D2 domain of IL-1R1 contributed only 58% in binding free energy with its endogenous activating cytokine IL-1βmuch less than that between ST2ECDand IL-33. This cannot be attributed to the inability of the D1-D2 domain of IL-1R1 to potently bind with cytokines as it binds with antagonistic IL-1Ra using primarily the D1-D2 domain at a KDof 28 nM. There appears to be functional differences in the cytokine signaling and regulation between IL-1R1/IL-1βand ST2/IL-33. Our hypothesis of recognition between ST2ECDand IL-33 does not preclude that the membrane-bound ST2 binds to IL-33 using a differ-ent mechanism. The D3 domain of the membrane-bound ST2 is restrained at the cell membrane and can potentially modulate inter-domain motion between the D2 and D3 domains. Differences in the IL-33 recognition between membrane-bound ST2 and ST2ECDremain to be determined.
Our binding site identification and assessment determined two major locations in ST2ECD that are suitable for small molecule binding. Druggability evaluation informed that a third of all detected binding sites in the representative conformations have Dscore values0.83 imply-ing druggability. The primary and most frequently detected location (Site 1) is at the interface between the D1 and D2 domains whereas the second location (Site 2) is between the D2 and D3 domains. Site 1 yields a higher Dscore value and adopts a relatively rigid conformation as observed in simulations. Our binding data also show that the D1-D2 domain of ST2ECD inter-acts with IL-33 potently. Compounds bound to this site can impact the inter-domain motion between D1 and D2 and interfere directly with IL-33 binding. Thus, Site 1 is an attractive loca-tion to seek small molecule inhibitors with high potencies. Higher variability in the binding site conformations was found at Site 2 because it engages the flexible D3 domain. Ligands bound to Site 2 can potentially trap the orientation of the D3 domain and cause ineffective binding between ST2ECDand IL-33 similar to the strategy suggested in our study of IL-1R1[24]. Another unique site was found inN8when the D1 and D3 domains make close contacts. Small molecules binding to this site inN8can potentially stabilizeN8similar to the antagonistic action of the AF10847 peptide imposed on IL-1R1[30,61]. Given the interest to selectively inhibit sST2 or membrane-bound ST2 to attenuate TH2 response, binding sites besides Site 1 need to be explored. Although we only showed representative conformations from the cluster groups in this work, other conformations in each cluster group can be exploited inin silicohit
discovery. Computational simulations have been instrumental to facilitate the discovery of transient and cryptic pockets in proteins permissible for ligand binding in mutant p53[62], TEM-1β-latamase[63], IL-2, Rnase H[64] and Bcl-xL[65] employing different approaches. These transient protein conformations are difficult to identify by experimental means alone. In this work, we reported another example of discovering potential small molecule binding sites in ST2 exhibiting large interdomain motion. Follow-up studies will be reported in due course.
with pathological diseases including asthma, rheumatoid arthritis, atherosclerosis and GVHD [9,13,15,66]. Therapeutic interventions in the ST2/IL-33 axis will provide novel treatment options to these immunity-related diseases or disorders. Although antibodies are widely used to block the extensive interactions between cytokine receptors and cytokines[67], small mole-cule inhibitors/modulators targeting membrane-bound receptors including TLR-8[68] and FGFR[69] have been reported. In summary, our study characterized ST2ECDconformations and assessed their small molecule binding sites that can be useful to discover small molecules targeting ST2ECD. The approach could potentially be applied to other cytokine receptors exhib-iting similar domain architectures and inter-domain flexibility.
Supporting Information
S1 Fig. The Porod-Debye plot of the ST2 SAXS data.The curve continues to increase without
reaching plateau at high q values (not shown). (TIF)
Acknowledgments
We acknowledge the generous computational resources support in part by the National Science Foundation through Extreme Science and Engineering Discovery Environment (XSEDE) Sci-ence Gateway (to C.Y.). We are also grateful for the financial support in part from the National Institute of Health, National Cancer Institute, USA, (R01 CA174667 to C.Y.) and from the National Institutes of Health through the University of Michigan’s Cancer Center Support Grant (P30 CA046592) by the use of the following Cancer Center Core: Center of Structural Biology. We thank Shaomeng Wang for providing computing resources for this work and help-ful comments on the manuscript from Denzil Bernard and Sophie Paczesny.
Author Contributions
Conceived and designed the experiments: CY. Performed the experiments: CY JD KC WB JS. Analyzed the data: CY JD. Contributed reagents/materials/analysis tools: SW XW. Wrote the paper: CY WB JS SW.
References
1. Garlanda C, Dinarello CA, Mantovani A (2013) The interleukin-1 family: back to the future. Immunity 39: 1003–1018. doi:10.1016/j.immuni.2013.11.010PMID:24332029
2. Tominaga S-i (1989) A putative protein of a growth specific cDNA from BALB/C-3T3 cells is highly simi-lar to the extracellusimi-lar portion of mouse interleukin 1 receptor. FEBS Letters 258: 301–304. PMID: 2532153
3. Yanagisawa K, Takagi T, Tsukamoto T, Tetsuka T, Tominaga S (1993) Presence of a novel primary response gene ST2L, encoding a product highly similar to the interleukin 1 receptor type 1. FEBS Lett 318: 83–87. PMID:7916701
4. Klemenz R, Hoffmann S, Werenskiold AK (1989) Serum- and oncoprotein-mediated induction of a gene with sequence similarity to the gene encoding carcinoembryonic antigen. Proc Natl Acad Sci U S A 86: 5708–5712. PMID:2527364
5. Bulek K, Swaidani S, Aronica M, Li X (2010) Epithelium: the interplay between innate and Th2 immu-nity. Immunol Cell Biol 88: 257–268. doi:10.1038/icb.2009.113PMID:20065993
6. Schmitz J, Owyang A, Oldham E, Song Y, Murphy E, McClanahan TK, et al. (2005) IL-33, an interleu-kin-1-like cytokine that signals via the IL-1 receptor-related protein ST2 and induces T helper type 2-associated cytokines. Immunity 23: 479–490. PMID:16286016
8. Molofsky AB, Savage AK, Locksley RM (2015) Interleukin-33 in Tissue Homeostasis, Injury, and Inflammation. Immunity 42: 1005–1019. doi:10.1016/j.immuni.2015.06.006PMID:26084021
9. Liew FY, Pitman NI, McInnes IB (2010) Disease-associated functions of IL-33: the new kid in the IL-1 family. Nat Rev Immunol 10: 103–110. doi:10.1038/nri2692PMID:20081870
10. Endo Y, Hirahara K, Iinuma T, Shinoda K, Tumes DJ, Asou HK, et al. (2015) The interleukin-33-p38 kinase axis confers memory T helper 2 cell pathogenicity in the airway. Immunity 42: 294–308. doi:10. 1016/j.immuni.2015.01.016PMID:25692703
11. Fahy JV (2015) Type 2 inflammation in asthma [mdash] present in most, absent in many. Nat Rev Immunol 15: 57–65. doi:10.1038/nri3786PMID:25534623
12. Miller AM, Xu D, Asquith DL, Denby L, Li Y, Sattar N, et al. (2008) IL-33 reduces the development of ath-erosclerosis. J Exp Med 205: 339–346. doi:10.1084/jem.20071868PMID:18268038
13. Vander Lugt MT, Braun TM, Hanash S, Ritz J, Ho VT, Antin JH, et al. (2013) ST2 as a marker for risk of therapy-resistant graft-versus-host disease and death. N Engl J Med 369: 529–539. doi:10.1056/ NEJMoa1213299PMID:23924003
14. Hill GR, Ferrara JL (2000) The primacy of the gastrointestinal tract as a target organ of acute graft-ver-sus-host disease: rationale for the use of cytokine shields in allogeneic bone marrow transplantation. Blood 95: 2754–2759. PMID:10779417
15. Kakkar R, Lee RT (2008) The IL-33/ST2 pathway: therapeutic target and novel biomarker. Nat Rev Drug Discov 7: 827–840. doi:10.1038/nrd2660PMID:18827826
16. Dinarello CA, van der Meer JW (2013) Treating inflammation by blocking interleukin-1 in humans. Semin Immunol 25: 469–484. doi:10.1016/j.smim.2013.10.008PMID:24275598
17. Fleischmann RM, Tesser J, Schiff MH, Schechtman J, Burmester GR, Bennett R, et al. (2006) Safety of extended treatment with anakinra in patients with rheumatoid arthritis. Ann Rheum Dis 65: 1006–1012. PMID:16396977
18. Lachmann HJ, Kone-Paut I, Kuemmerle-Deschner JB, Leslie KS, Hachulla E, Quartier P, et al. (2009) Use of canakinumab in the cryopyrin-associated periodic syndrome. N Engl J Med 360: 2416–2425. doi:10.1056/NEJMoa0810787PMID:19494217
19. Kirchmair J, Markt P, Distinto S, Schuster D, Spitzer GM, Liedl KR, et al. (2008) The Protein Data Bank (PDB), its related services and software tools as key components for in silico guided drug discovery. J Med Chem 51: 7021–7040. doi:10.1021/jm8005977PMID:18975926
20. Lounnas V, Ritschel T, Kelder J, McGuire R, Bywater RP, Foloppe N (2013) Current progress in Struc-ture-Based Rational Drug Design marks a new mindset in drug discovery. Computational and Structural Biotechnology Journal 5: e201302011. doi:10.5936/csbj.201302011PMID:24688704
21. Liu X, Hammel M, He Y, Tainer JA, Jeng US, Zhang L, et al. (2013) Structural insights into the interac-tion of IL-33 with its receptors. Proc Natl Acad Sci U S A 110: 14918–14923. doi:10.1073/pnas. 1308651110PMID:23980170
22. Lo Conte L, Chothia C, Janin J (1999) The atomic structure of protein-protein recognition sites. J Mol Biol 285: 2177–2198. PMID:9925793
23. Lingel A, Weiss TM, Niebuhr M, Pan B, Appleton BA, Wiesmann C, et al. (2009) Structure of IL-33 and its interaction with the ST2 and IL-1RAcP receptors—insight into heterotrimeric IL-1 signaling com-plexes. Structure 17: 1398–1410. doi:10.1016/j.str.2009.08.009PMID:19836339
24. Yang CY (2015) Identification of potential small molecule allosteric modulator sites on IL-1R1 ectodo-main using accelerated conformational sampling method. PLoS One 10: e0118671. doi:10.1371/ journal.pone.0118671PMID:25706624
25. Berman HM, Westbrook J, Feng Z, Gilliland G, Bhat TN, Weissig H, et al. (2000) The Protein Data Bank. Nucl Acids Res 28: 235–242. PMID:10592235
26. Vigers GP, Anderson LJ, Caffes P, Brandhuber BJ (1997) Crystal structure of the type-I interleukin-1 receptor complexed with interleukin-1beta. Nature 386: 190–194. PMID:9062193
27. Thomas C, Bazan JF, Garcia KC (2012) Structure of the activating IL-1 receptor signaling complex. Nat Struct Mol Biol 19: 455–457. doi:10.1038/nsmb.2260PMID:22426547
28. Schreuder H, Tardif C, Trump-Kallmeyer S, Soffientini A, Sarubbi E, Akeson A, et al. (1997) A new cyto-kine-receptor binding mode revealed by the crystal structure of the IL-1 receptor with an antagonist. Nature 386: 194–200. PMID:9062194
29. Hou J, Townson SA, Kovalchin JT, Masci A, Kiner O, Shu Y, et al. (2013) Design of a superior cytokine antagonist for topical ophthalmic use. Proc Natl Acad Sci U S A 110: 3913–3918. doi:10.1073/pnas. 1217996110PMID:23431173
31. Wang D, Zhang S, Li L, Liu X, Mei K, Wang X (2010) Structural insights into the assembly and activation of IL-1beta with its receptors. Nat Immunol 11: 905–911. doi:10.1038/ni.1925PMID:20802483
32. MOE. Montreal, Quebec, Canada: Chemical Computing Group.
33. Pettersen EF, Goddard TD, Huang CC, Couch GS, Greenblatt DM, Meng EC, et al. (2004) UCSF Chi-mera—a visualization system for exploratory research and analysis. J Comput Chem 25: 1605–1612. PMID:15264254
34. Schneidman-Duhovny D, Hammel M, Sali A (2010) FoXS: a web server for rapid computation and fitting of SAXS profiles. Nucleic Acids Res 38: W540–544. doi:10.1093/nar/gkq461PMID:20507903
35. Wang J, Cieplak P, Peter A. Kollman (2000) How well does a restrained electrostatic potential (RESP) model perform in calculating conformational energies of organic and biological molecules? Journal of Computational Chemistry 21: 1049–1074.
36. Jorgensen WL, Chandrasekhar J, Madura JD, Impey RW, Klein ML (1983) Comparison of simple potential functions for simulating liquid water. The Journal of Chemical Physics 79: 926–935.
37. Salomon-Ferrer R, Götz AW, Poole D, Le Grand S, Walker RC (2013) Routine Microsecond Molecular Dynamics Simulations with AMBER on GPUs. 2. Explicit Solvent Particle Mesh Ewald. Journal of Chemical Theory and Computation 9: 3878–3888. doi:10.1021/ct400314yPMID:26592383
38. Case DA, Darden TA, Cheatham T.E. I, Simmerling CL, Wang J, Duke RE, et al. (2012) AMBER 12. San Francisco: University of California.
39. Ryckaert J-P, Ciccotti G, Berendsen HJC (1977) Numerical integration of the cartesian equations of motion of a system with constraints: molecular dynamics of n-alkanes. Journal of Computational Phys-ics 23: 327–341.
40. Darden T, York D, Pedersen L (1993) Particle Mesh Ewald—an N.Log(N) Method for Ewald Sums in Large Systems. Journal of Chemical Physics 98: 10089–10092.
41. Hamelberg D, Mongan J, McCammon JA (2004) Accelerated molecular dynamics: a promising and effi-cient simulation method for biomolecules. J Chem Phys 120: 11919–11929. PMID:15268227
42. Grant BJ, Rodrigues AP, ElSawy KM, McCammon JA, Caves LS (2006) Bio3d: an R package for the comparative analysis of protein structures. Bioinformatics 22: 2695–2696. PMID:16940322
43. Pedregosa F, Varoquaux G, Gramfort A, Michel V, Thirion B, Grisel O, et al. (2011) Scikit-learn: Machine Learning in Python. Journal of Machine Learning Research 12: 2825–2830.
44. Comaniciu D, Meer P (2002) Mean shift: A robust approach toward feature space analysis. Ieee Trans-actions on Pattern Analysis and Machine Intelligence 24: 603–619.
45. Cheng YZ (1995) Mean Shift, Mode Seeking, and Clustering. Ieee Transactions on Pattern Analysis and Machine Intelligence 17: 790–799.
46. Fukunaga K, Hostetler LD (1975) Estimation of Gradient of a Density-Function, with Applications in Pat-tern-Recognition. Ieee Transactions on Information Theory 21: 32–40.
47. Halgren TA, Murphy RB, Friesner RA, Beard HS, Frye LL, Pollard WT, et al. (2004) Glide: a new approach for rapid, accurate docking and scoring. 2. Enrichment factors in database screening. J Med Chem 47: 1750–1759. PMID:15027866
48. Brown WC, DelProposto J, Rubin JR, Lamiman K, Carless J, Smith JL (2011) New ligation-independent cloning vectors compatible with a high-throughput platform for parallel construct expression evaluation using baculovirus-infected insect cells. Protein Expression and Purification 77: 34–45. doi:10.1016/j. pep.2011.01.007PMID:21262364
49. Pelikan M, Hura GL, Hammel M (2009) Structure and flexibility within proteins as identified through small angle X-ray scattering. Gen Physiol Biophys 28: 174–189.
50. Rambo RP, Tainer JA (2011) Characterizing flexible and intrinsically unstructured biological macromol-ecules by SAS using the Porod-Debye law. Biopolymers 95: 559–571. doi:10.1002/bip.21638PMID: 21509745
51. Grant BJ, McCammon JA, Caves LS, Cross RA (2007) Multivariate analysis of conserved sequence-structure relationships in kinesins: coupling of the active site and a tubulin-binding sub-domain. J Mol Biol 368: 1231–1248. PMID:17399740
52. Amadei A, Linssen ABM, Berendsen HJC (1993) Essential dynamics of proteins. Proteins: Structure, Function, and Bioinformatics 17: 412–425.
53. David C, Jacobs D (2014) Principal Component Analysis: A Method for Determining the Essential Dynamics of Proteins. In: Livesay DR, editor. Protein Dynamics: Humana Press. pp. 193–226.
55. Carroll MJ, Mauldin RV, Gromova AV, Singleton SF, Collins EJ, Lee AL (2012) Evidence for dynamics in proteins as a mechanism for ligand dissociation. Nat Chem Biol 8: 246–252. doi:10.1038/nchembio. 769PMID:22246400
56. Halgren TA (2009) Identifying and Characterizing Binding Sites and Assessing Druggability. J Chem Inf Model.
57. Vidler LR, Brown N, Knapp S, Hoelder S (2012) Druggability analysis and structural classification of bromodomain acetyl-lysine binding sites. J Med Chem 55: 7346–7359. doi:10.1021/jm300346w PMID:22788793
58. Xu D, Wang B, Meroueh S (2015) Structure-Based Computational Approaches for Small-Molecule Modulation of Protein-Protein Interactions. In: Meyerkord CL, Fu H, editors. Protein-Protein Interac-tions: Springer New York. pp. 77–92.
59. Mertens HD, Svergun DI (2010) Structural characterization of proteins and complexes using small-angle X-ray solution scattering. J Struct Biol 172: 128–141. doi:10.1016/j.jsb.2010.06.012PMID: 20558299
60. Rambo RP, Tainer JA (2013) Super-resolution in solution X-ray scattering and its applications to struc-tural systems biology. Annu Rev Biophys 42: 415–441. doi:10.1146/annurev-biophys-083012-130301 PMID:23495971
61. Akeson AL, Woods CW, Hsieh LC, Bohnke RA, Ackermann BL, Chan KY, et al. (1996) AF12198, a novel low molecular weight antagonist, selectively binds the human type I interleukin (IL)-1 receptor and blocks in vivo responses to IL-1. J Biol Chem 271: 30517–30523. PMID:8940020
62. Wassman CD, Baronio R, Demir O, Wallentine BD, Chen CK, Hall LV, et al. (2013) Computational iden-tification of a transiently open L1/S3 pocket for reactivation of mutant p53. Nat Commun 4: 1407. doi: 10.1038/ncomms2361PMID:23360998
63. Bowman GR, Bolin ER, Hart KM, Maguire BC, Marqusee S (2015) Discovery of multiple hidden alloste-ric sites by combining Markov state models and experiments. Proc Natl Acad Sci U S A 112: 2734– 2739. doi:10.1073/pnas.1417811112PMID:25730859
64. Bowman GR, Geissler PL (2012) Equilibrium fluctuations of a single folded protein reveal a multitude of potential cryptic allosteric sites. Proc Natl Acad Sci U S A 109: 11681–11686. doi:10.1073/pnas. 1209309109PMID:22753506
65. Eyrisch S, Helms V (2007) Transient pockets on protein surfaces involved in protein-protein interaction. J Med Chem 50: 3457–3464. PMID:17602601
66. Nelson RP Jr., Khawaja MR, Perkins SM, Elmore L, Mumaw CL, Orschell C, et al. (2014) Prognostic Biomarkers for Acute Graft-versus-Host Disease Risk after Cyclophosphamide-Fludarabine Nonmye-loablative Allotransplantation. Biol Blood Marrow Transplant 20: 1861–1864. doi:10.1016/j.bbmt.2014. 06.039PMID:25017764
67. Broughton SE, Hercus TR, Lopez AF, Parker MW (2012) Cytokine receptor activation at the cell sur-face. Curr Opin Struct Biol 22: 350–359. doi:10.1016/j.sbi.2012.03.015PMID:22521507
68. Tanji H, Ohto U, Shibata T, Miyake K, Shimizu T (2013) Structural reorganization of the Toll-like recep-tor 8 dimer induced by agonistic ligands. Science 339: 1426–1429. doi:10.1126/science.1229159 PMID:23520111