Identification of Potential Small Molecule
Allosteric Modulator Sites on IL-1R1
Ectodomain Using Accelerated
Conformational Sampling Method
Chao-Yie Yang*
Department of Internal Medicine, Hematology and Oncology Division, University of Michigan, Ann Arbor, Michigan, United States of America
Abstract
The interleukin-1 receptor (IL-1R) is the founding member of the interleukin 1 receptor family which activates innate immune response by its binding to cytokines. Reports showed dysre-gulation of cytokine production leads to aberrant immune cells activation which contributes to auto-inflammatory disorders and diseases. Current therapeutic strategies focus on utiliz-ing antibodies or chimeric cytokine biologics. The large protein-protein interaction interface between cytokine receptor and cytokine poses a challenge in identifying binding sites for small molecule inhibitor development. Based on the significant conformational change of IL-1R type 1 (IL-1R1) ectodomain upon binding to different ligands observed in crystal struc-tures, we hypothesized that transient small molecule binding sites may exist when IL-1R1 undergoes conformational transition and thus suitable for inhibitor development. Here, we employed accelerated molecular dynamics (MD) simulation to efficiently sample conforma-tional space of IL-1R1 ectodomain. Representative IL-1R1 ectodomain conformations de-termined from the hierarchy cluster analysis were analyzed by the SiteMap program which leads to identify small molecule binding sites at the protein-protein interaction interface and allosteric modulator locations. The cosolvent mapping analysis using phenol as the probe molecule further confirms the allosteric modulator site as a binding hotspot. Eight highest ranked fragment molecules identified fromin silicoscreening at the modulator site were evaluated by MD simulations. Four of them restricted the IL-1R1 dynamical motion to inac-tive conformational space. The strategy from this study, subject toin vitroexperimental vali-dation, can be useful to identify small molecule compounds targeting the allosteric
modulator sites of IL-1R and prevent IL-1R from binding to cytokine by trapping IL-1R in inactive conformations.
OPEN ACCESS
Citation:Yang C-Y (2015) Identification of Potential Small Molecule Allosteric Modulator Sites on IL-1R1 Ectodomain Using Accelerated Conformational Sampling Method. PLoS ONE 10(2): e0118671. doi:10.1371/journal.pone.0118671
Academic Editor:Miguel Machuqueiro, Faculdade de Ciências da Universidade de Lisboa, PORTUGAL
Received:November 10, 2014
Accepted:January 12, 2015
Published:February 23, 2015
Copyright:© 2015 Chao-Yie Yang. This is an open access article distributed under the terms of the
Creative Commons Attribution License, which permits unrestricted use, distribution, and reproduction in any medium, provided the original author and source are credited.
Data Availability Statement:All relevant data are within the paper and the Supporting Information files.
Introduction
The interleuk1 (IL-1) family of ligands and receptors are important regulators of innate in-flammatory and immune responses[1]. Currently, eleven IL-1 ligands (or cytokines) and recep-tors were identified respectively [2]. These IL-1 ligands function as agonists and antagonists to IL-1 signaling by binding to IL-1 receptors including ten single pass transmembrane proteins and IL-18BP which lacks transmembrane domain[3]. Regulation of inflammatory signaling via IL-1 family of receptors can be mediated either by its binding to the activating cytokines or an-tagonistic ligands such as IL-1Ra which inhibit downstream signaling [4]. Some members of the IL-1 receptors are decoy receptors such as IL-1 receptor type 2 (IL-1R2) which lacks the cy-toplasmic element to recruit downstream effector proteins. Additional level of regulation is controlled via the cleavage of the ectodomain of IL-1 receptors such as that found in IL-1 re-ceptor type 1 (denoted sIL-1R1)[5] or the alternatively spliced soluble Suppressor of Tumorige-nicity 2 (sST2) protein[6]. sIL-1R1 and sST2 have only the ectodomain of their respective receptors, IL-1R1 and ST2. They circulate in the extracellular milieu to modulate their respec-tive binding cytokines concentrations and attenuate the inflammatory responses mediated by these ligands [5,7,8].
Roles of many members in the IL-1 family play in inflammatory diseases and auto-inflam-matory diseases or disorders have been reported[9]. In one case, loss of function homozygous mutation in the endogenous IL-1 receptor antagonist (IL-1Ra) has been identified in infants with early death due to overwhelming systemic inflammation found in skins, joints and bones [10]. Contribution of the IL-1 family of proteins to cardiovascular diseases, Type-2 diabetes, rheumatoid arthritis and chronic inflammatory diseases have also been reported[9]. Current available therapy for treating IL-1 family related diseases is limited to Canakinumab, Gevokizu-mab and LY2189102 which are mainly anti-IL-1βmonoclonal antibodies[9]. No small orally available drugs are available. In recent years, the expanding roles of the member proteins in IL-1 family play in multiple diseases have been discovered [2,IL-1IL-1]. One example is that the elevated level of soluble ST2 in the plasma of patients receiving allogeneic hematopoietic stem cell trans-plantation predicted their graft-versus-host disease (GVHD) mortality [12,13]. The prognostic value of soluble ST2 was attributed to its role as a decoy receptor of IL-33. Binding of sST2 and IL-33 decreases the level of unbound IL-33 in plasma which drives type-2 T cells towards a type-1 T cell response during transplantation. Thus, there are needs to discover and develop new therapy targeting this important cytokine family of proteins for treating inflammatory and immune-mediated diseases.
Currently, FDA approved specific IL-1 targeting therapies are monoclonal antibodies. Oral-ly available small molecule drugs have advantages in several aspects including ease of adminis-tration, cost effectiveness and flexible dosage schedule design. Given the chronic nature of the inflammatory disorders and diseases associated with IL-1 family of proteins[14], efficacious orally available drugs will benefit patients in their long-term treatment. To develop small mole-cule inhibitors for the IL-1 family of proteins, we focus on targeting the ectodomain of IL-1 re-ceptor type 1 (IL-1R1) protein, the first cytokine rere-ceptor in the family discovered[15], in this work. Binding of IL-1R1 with IL-1αor IL-1βleads to subsequent recruitment of IL-1RAcP at
the cell membrane [16] and downstream cytosolic NF-κB activation. A small molecule probe (NP1) was reported recently to inhibit the association between IL-1R and TLR4 and the down-stream NF-κB activation[17]. However, it was suggested to bind to the cytosolic component of the cytokine receptor protein complex without clear indication of the protein target.
Available crystal structures of IL-1R1 indicated that IL-1R1 binds with IL-1βusing three do-mains (D1,D2 and D3) and their contact interface (4180.5 Å2) is much larger than those in
typ-ical small molecule binding sites (1500–3000 Å2)[18]. While IL-1R1 binds with IL-1Ra
involving small conformational changes of the D3 domain [19], significant changes were found when IL-1R1 binds with a peptide antagonist (AF10847)[20]. We hypothesized that the flexi-bility of IL-1R1 ectodomain observed from crystal structures may indicate the existences of multiple conformations that can potentially be exploited by small molecule inhibitors develop-ment. To investigate this inhibitor development strategy, we employed computational methods to first sample extensively IL-1R1 conformations based on accelerated molecular dynamics simulation algorithm[21]. Selected represented conformations determined by the hierarchy cluster method were analyzed by the Sitemap program[22] to identify“druggable”small mole-cule binding sites. Potential small molemole-cule binding sites, denoted as allosteric modulator sites, not at the cytokine receptor/cytokine interaction interface were determined. The druggable binding sites were further assessed as binding hotspots via our recently developed cosolvent mapping method [23–25] which incorporated binding site flexibility. Anin silicoscreening of a
commercial fragment library was then used to target one modulator site in an unreported inac-tive IL-1R1 conformation. From the eight top-ranked compounds, we found four compounds bound to the allosteric modulator site for extended period of time and restricted the IL-1R1 dy-namical motion to an inactive conformational space during the 8 ns MD simulations. The ap-proach described here can be an attractive strategy to discover small molecule inhibitors targeting the challenging cytokine receptor proteins.
Materials and Methods
Protein structures of IL-1R1 used in this study
Five crystal structures of protein complexes containing IL-1R1 ectodomain have been deposit-ed in the protein databank (PDB entries: 4DEP[26], 4GAF[19], 3O4O[27], 1G0Y[20], 1IRA [28], 1ITB[29]). They include IL-1R1/IL-1β(1ITB), IL-1R1/IL-1β/IL-1RAcP (4DEP), IL-1R1/
IL-1Ra (1IRA), IL-1R1/EBI-005 (4GAF) and IL-1R1/AF10847 (1G0Y). EBI-005 is an IL-1β
chimera and binds more potently to IL-1R1 than IL-1β[19]. The backbone structures of IL-1R1
underwent minor changes in IL-1R1/IL-1β, IL-1R1/IL-1β/IL-1RAcP and IL-1R1/EBI-005 in which the root-mean-square deviations between them are 0.8 Å. We selected the IL-1R1 in the IL-1R1/EBI-005 as the initial conformation for our conformational sampling simulation be-cause of its highest structural resolution (2.15Å) and more amino acid structures resolved at the N-terminus. This IL-1R1 structure contains sequence D21-P330 of the extracellular do-main (or ectododo-main) with no missing atoms between D21 and P330. Among the crystal struc-tures, four asparagines were glycosylated except the structure in 1ITB[29]. The glycosylated asparagines do not interact directly with the endogenous cytokine ligands. During our simula-tions, the sugar molecules on IL-1R1 were removed. Simulations of the IL-1Ra and AF10847-bound IL-1R1 conformations were also performed using the sequences of D21-V331 and C23-T332 respectively for comparison purpose. Five disulfide bonds in IL-1R1 were maintained in all simulations.
MD simulation setup
(NVT) simulation was performed to raise the temperature of the system to 298K while con-straining backbone atoms with a 5 kcal/mol/Å2force constant with reference to the crystal structure. A second 200 ps constant pressure and constant temperature (NPT) simulation at 298 K was performed while constraining backbone atoms with a 2 kcal/mol/Å2force constant with reference to the crystal structure. The system was then equilibrated for 1 ns at 298K with-out any constraints followed by the production run. All the MD simulations were in the isobar-ic isothermal (NPT, T = 298K and P = 1 atm) ensemble. The SHAKE[34] algorithm was used to fix bonds involving hydrogen. The PME method[35] was used and the non-bonded cutoff distance was set at 10Å. The time step was 2 fs, and neighboring pairs list was updated every 20 steps.
For performing accelerated MD simulations, a 2 ns conventional MD (no modification of the potential energy function) was conducted to determine the average values of the potential energy for the total system (Vtotal) and the dihedral angles energy of the proteins (Vdih). The
threshold potential energy was defined as Vtotal+ Natoms/5 (Natoms: total number of atoms in
the system). Three threshold potential energies of the dihedral angle motion were used called AMD1, AMD2 and AMD3 with Vdih+ (number of residues) times 3.5, 4.2 and 4.9 respectively.
These parameters were taken as suggested by previous works[21]. The Vtotaland Vdih
parame-ters used in each machine were based on the averaged potential energy values calculated re-spectively. A total simulations time of 118 ns were collected from 2 ns equilibrium production run, 40 ns run of AMD1 parameters, 10 ns run of AMD2 parameters, 10 ns run of AMD3 pa-rameters performed at the GORDON cluster supported by XSEDE, 30 ns run of AMD1 param-eters in a local GPU machine and 26 ns run of AMD1 in an eight cores local machine. The lengths of the simulations performed at the GORDON cluster were limited by the computation times allocated to this work by XSEDE. Additional simulation runs performed at the local machines were included to ensure the coverage of the conformational space guided by the pro-jections of conformations to the principal component spaces discussed later in the Methods section.
The procedures of performing cosolvent mapping simulation and analysis have been re-ported previously [23–25]. In this work, we used phenol as the probe molecule because the phe-nol group is frequently found in the fragment screening against proteins involved in protein-protein interaction[36]. Cosolvent mapping analyses were done using the trajectories of 4 ns cosolvent MD simulations.
Force field parameters of the small molecules were derived using the Antechamber module in the Amber program suite. The protocol for generating the point charge parameters is as fol-lows: The docked pose of each molecule was minimized at the RHF level using a 6–31Gbasis
set with Gaussian09 [37]. The electrostatic field potential calculated from Gaussian09 was used to derive the point charges at each atom site based on the RESP fitting procedure[38].
Principal component analysis and hierarchy cluster analysis of the
conformations
Five crystal structures of IL-1R1 bound to different ligands were used in the principal compo-nent analysis (PCA) implemented in the Bio3D version 2.0[39]. In the PCA, amino acid se-quences of the crystal structures were aligned and gaps detected based on MUSCLE[40]. Cα
matrix gives eigenvectors and eigenvalues. The eigenvectors are referred as principal compo-nents (PCs) and the coefficients of the eigenvectors characterize the collective atomic displace-ments for each principle component. The eigenvalues of the matrix gives the contribution of each eigenvector to the overall displacements in the covariance matrix. Such an analysis can be considered as the linear transformation of the coordinate system from Cartesian bases to col-lective movement bases. The PC gave the physical representation of collection motion in the protein dynamics because the Cαatoms were connected (or correlated) via backbone peptide
bonds. Detailed procedures can be found in the Bio3d website. Snapshots of conformations ob-tained from each MD simulation were then first aligned to the initial conformation and the conformational changes in the simulated trajectory were mapped to the associated principal components shown in figures. The PCA using the five crystal structures showed the first three principal components contributed 94, 4.6 and 0.7% to the overall structural displacements. Mapping of conformations from the trajectory to two principal components informed a two di-mensional subspace characterization of the conformational changes and/or transition.
For hierarchy cluster analysis, a second PCA of 1180 aMD generated IL-1R1 conformations taken at every 100 ps from the 118 ns trajectory were first performed without including the crystal structures. For this hierarchy cluster analysis, we used the first 38 PCs, which accounted for 90% of backbone structural variation of the 1180 IL-1R1 conformations. In the cluster anal-ysis, the Euclidean distances between the 38 PCs were used to construct the dendrogram as implemented in the hclust function of the R program[41]. By using a cutoff value of 40 Å at the dendrogram, we obtained 25 cluster groups. The conformation closest to the center of each cluster group was used to represent each cluster group, also called representative conformation.
Sitemap Analysis
Three crystal structures (chain A from 4GAF[19], chain R from 1IRA[28], chain B from 1G0Y [20]) and twenty five representative conformations of IL-1R1 determined from the hierarchy cluster analysis were used in the Sitemap program [22] to identify potential small molecule binding sites in each conformation. Each conformation was first processed in the Glide pro-gram[42] from the Maestro 9.7 program suite (Release 2014-1)[42] followed by the Sitemap analysis using default parameters. Up to five binding sites were saved. Among the twenty five MD generated conformations, only conformation399gave four binding sites. Druggability index of each binding site was based on the Dscore value in the Sitemap program.
In silico
screening and the fragment library
Conformation289was used in thein silicofragment library screening. The virtual screening
workflow procedure in the Glide program was adopted in the screening calculation. Val117 of IL-1R1 (P2 site) was selected as the center of the docking site and the inner and outer rectangu-lar box sizes were set to 10 and 30 Å respectively in the grid generation. The Maybridge frag-ment library satisfied the rule of three[43] were obtained from the Maybridge website with a total of 2783 compounds. Structures of the Maybridge fragment library were prepared using the Ligprep program in the Maestro program suite using the default setting. Two compounds (both adamantine derivatives) failed in the Ligprep program and were fixed manually. A total of 4409 compound conformations were obtained and used in thein silicoscreening
Results and Discussions
Crystal structures between IL-1R1 and different ligands
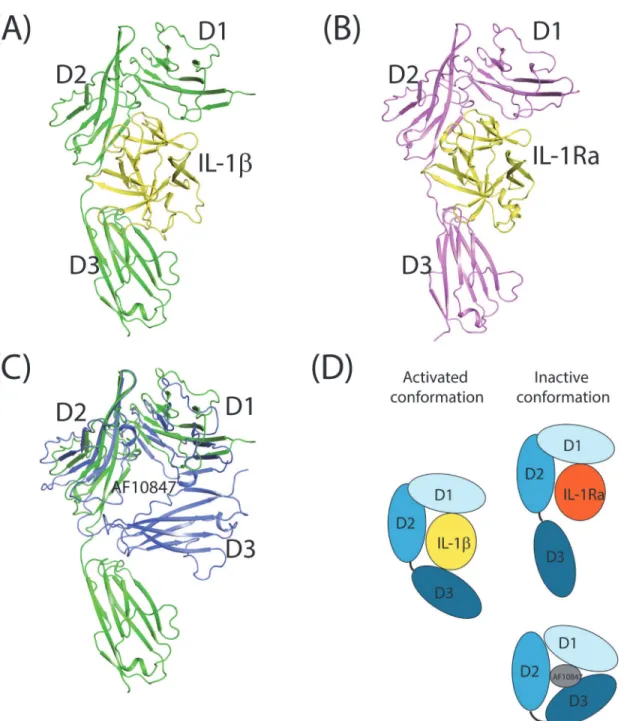
Three different conformations of IL-1R1 ectodomain have been determined via X-ray crystal-lography including the complexes of IL-1R1/IL-1β, IL-1R1/IL-1Ra and IL-1R1/AF10847
(Fig. 1). While IL-1βis a cytokine that activates IL-1R, IL-1Ra is an IL-1 receptor antagonist and AF10847 is a peptide antagonist [20,44]. The crystal structure of IL-1R1/IL-1β(Fig. 1A)
Fig 1. Crystal structures of IL-1R1 with three different ligands.(A) IL-1R1/IL-1β(PDB entry: 4DEF), (B) IL-1R1/IL-1Ra (PDB entry: 1IRA), and (C) IL-1R1/ AF10847 (PDB entry: 1G0Y) superimposed with IL-1R1 from IL-1R1/IL-1β. (D) Cartoon depiction of activated and inactive conformations of IL-1R1 with three types of ligands, i.e. IL-1β, IL-1Ra and AF10847. AF10847 was not shown for clarity.
showed that three domains of IL-1R1 (D1-D3 domains) interact with IL-1βusing extensive
surface contacts. Their contact surface area (contributed from both proteins) is 4180.5 Å2 based on the structure of PDB entry: 4DEP calculated by NACCESS[45]. The interaction inter-face between IL-1R1/IL-1βwith IL-1RAcP is less with a surface area of 2971.1 Å2. As reported, the antagonistic cytokine, IL-1Ra, interacts primarily with D1 and D2 domains of IL-1R1 but much less with the D3 domain of IL-1R1 (Fig. 1B)[19,28,46]. From our analysis, the D3 do-main of IL-1R1 rotates 30 degrees away from that in the IL-1βbound IL-1R1 conformation;
thus, making little contacts with IL-1Ra. The rotation of the D3 domain led to less contact in-terface area between IL-1R1 and IL-1Ra (3367.4 Å2). In both cytokine bound structures, the
IL-1R1 ectodomain adopts a clamp form to bind with the spherical shape cytokine ligands that fold into a conserved 12 stranded beta sheet structure. Although the antagonistic helical pep-tide, AF10847, is much smaller in size (21 amino acids), a dramatic conformational change in the D3 domain of IL-1R1 facilitated via the loop between the D2 and D3 domains occurred and resulted in favorable interaction between IL-1R1 and AF10847 (Fig. 1C). Based on the structure of IL-1R1/AF10847, the contact interface area is 2505.4 Å2. The large interaction
in-terfaces between IL-1R1 and different ligands also correlate with their high binding affinities. For examples, the IC50 values between IL-1Ra, AF10847 and IL-1R1 were reported to be 1.6 and 2.6 nM respectively [47]. Using a surface plasma resonance (SPR) based kinetic binding assay, the KDvalues for IL-1R1 and IL-1β, IL-1Ra were reported to be 2.0 and 0.33 nM
respec-tively [19]. Comparison of these three ligand-bound IL-1R1 structures (Fig. 1D) also suggested the loop between the D2 and D3 domains is much flexible than that between the D1 and D2 domains. This flexible loop permits the variation of the relative orientation between the D1-D2 domains and D3 domain and allows recognition of IL-1R1 to different ligands.
Conformational sampling of IL-1R1 based on conventional and
accelerated MD simulations
The crystal structures of IL-1R1 with IL-1β, IL-1Ra and AF10847 gave static representations
of IL-1R1 conformations stabilized by each ligand molecule. To explore and sample the confor-mational spaces of IL-1R1 extensively, we performed conventional and accelerated MD simula-tions of IL-1R1 using the IL-1R1 conformation in the IL-1R1/EBI-005 crystal structure. EBI-005 is an IL-1βchimeric protein that binds to IL-1R1 ectodomain at a higher affinity than
IL-1β(KD=<0.014 versus 2.0 nM) [19]. To analyze the conformations of IL-1R1 obtained
from the MD simulations, we first performed the principal component analysis (PCA) of the five available crystal structures of IL-1R1. Based on the PCA analysis, the first two principal components (PC1 and PC2) account for 98.6% of backbone conformational variations associ-ated with the five crystal structures. As shown inFig. 2, projections of the five IL-1R1 structures onto PC1 and PC2 subspace gave a clear distinction of the IL-1β- and IL-1Ra-bound IL-1R1
conformations from the AF10847-bound IL-1R1 conformation. Specifically, IL-1β-, IL-1Ra-bound IL-1R1 conformations were mapped to a similar region (PC1 = -70, PC2 = -20) whereas the AF10847-bound IL-1R1 conformation was projected to a further out region (PC1 = 330, PC2 = 4).
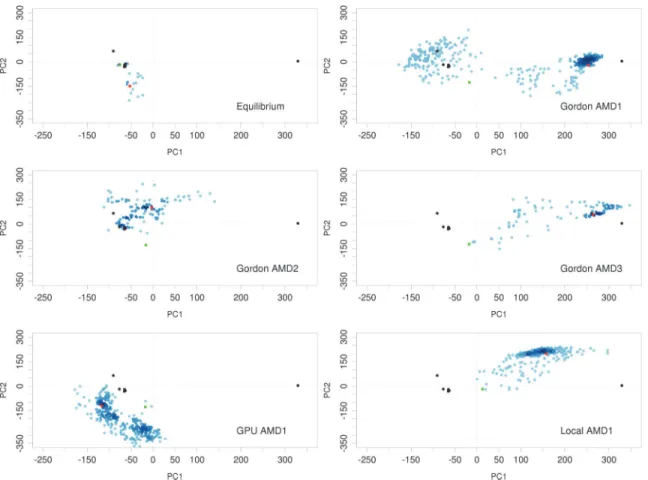
IL-1R1 conformations overlap with part of the region visited by the EBI-005-bound IL-1R1 simulation. Results of cMD simulations indicated their limitation to overcome free energy barriers between different conformational microstates of IL-1R1 ectodomain because no over-lapping conformations were found between EBI-005-bound and AF10847-bound IL-1R1 simulations.
In the aMD simulation, the potential energy wells were modified or raised to facilitate the barrier crossing of protein conformations between different microstates. Here, we used three different parameters denoted as AMD1, AMD2 and AMD3 where the modified potential wells become progressively shallower from AMD1 to AMD3. InFig. 2B-D, we found the parameters used for AMD1 and AMD3 allowed sampling of IL-1R1 conformations to the proximity of the AF10847-bound IL-1R1 structure but not those using the AMD2 parameters. IL-1R1 confor-mations obtained from the GPU machine were found to map to different conformational spaces not accessed by other trajectories. Results from the aMD simulations indicated that the modifications to the potential energy wells permits extensive conformational sampling of IL-1R1 in a relatively short simulations times (118 ns in total). Projection of the IL-IL-1R1 conforma-tions from aMD simulaconforma-tions to the three dimensional subspace (PC1, PC2 and PC3) was pro-vided inS2 Fig.which showed the extensive coverage of the conformational spaces including all ligand-bound conformations from the crystal structures.
Fig 2. Mapping of IL-1R1 ectodomain conformations obtained from cMD and aMD simulations to the PC1 and PC2 subspace.Six crystal structures from five PDB entries: 4GAF, 1G0Y, 4DEP (2 chains), 1ITB and 1IRA (denoted by black circles), were used in the PCA to determine the first two principal components. Green and red circles denote the first and final conformations from each simulation.
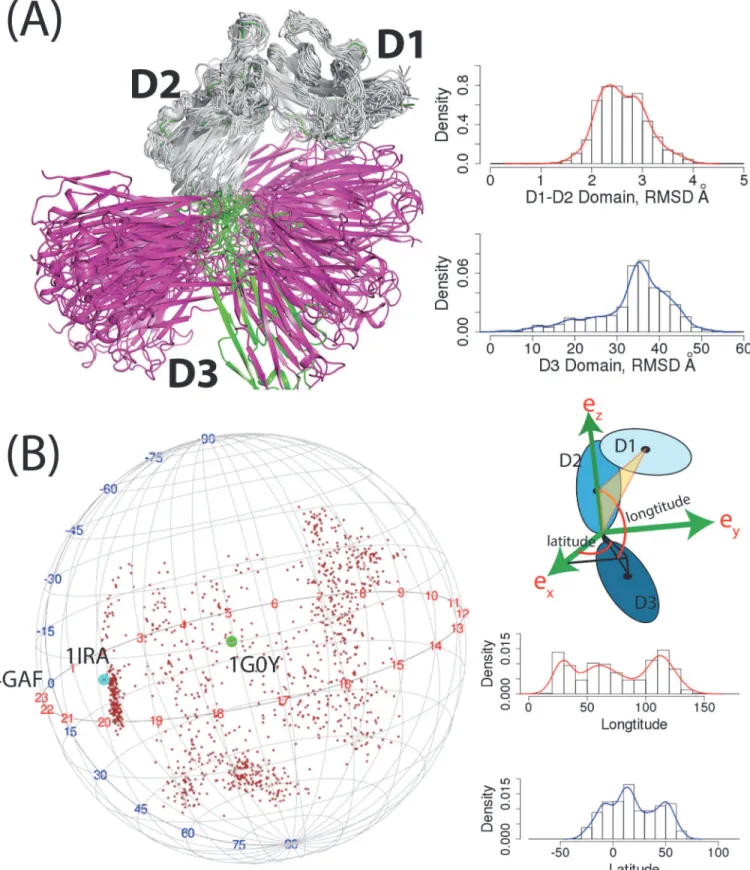
We further analyzed the conformational changes of IL-1R1 from the aMD simulations by studying backbone fluctuation of the D1, D2 and D3 domains. In all IL-1R1 conformations, the D1 and D2 domains of IL-1R1 showed very limited backbone variations where the root-mean-square deviations (RMSD) of the backbone atoms vary between 2–3 Å from the crystal structure (Fig. 3A). Larger backbone motions of IL-1R1 were observed in the D3 domain where the distribution of RMSDs peaks at 35 Å from the EBI-005-bound IL-1R1 crystal struc-ture. The large RMSD values in the D3 domain do not result from the structural unfolding. It is attributed to the large rotation of the D3 domain anchored by the flexible loop between the D2 and D3 domains of IL-1R1. To characterize the rotational motion of the D3 relative to the D1-D2 domain, we defined a coordinate system as the following (Fig. 3B). The Cαatom of T217 at the C-terminus of the D2 domain is selected as the origin. The z-axis is defined as the vector connecting the origin and the center-of-mass of the D2 domain. The y-z plane is defined as the plane both the z-axis and the vector between the origin and the center-of-mass of the D1 do-main lie on. Thus, the origin, the center-of-mass of the D1 and D2 dodo-main are on the y-z plane. The x-axis is the axis perpendicular to the y-z plane. Relative orientation of the D3 do-main to the D1-D2 dodo-main is then represented by the vector connecting the origin and the cen-ter-of-mass of the D3 domain (Fig. 3B). Based on this coordinate system, the longitudinal motion of the D3 domain encompassed 110 degree (20─130) while the latitudinal motion cov-ered a similar range of 100 degree (-30─70). The vectors from the origin to the center-of-mass of the D3 domain were mapped to a sphere shown inFig. 3Bto elucidate the large conforma-tional variations of the D3 domain in the aMD simulation. Conformations of the IL-1Ra (1IRA)-, EBI-005(4GAF)- and AF10847(1G0Y)-bound IL-1R1 mapped on the sphere con-firmed that they were included among those in the aMD simulations.
Small molecule binding site analysis of IL-1R1 using Sitemap
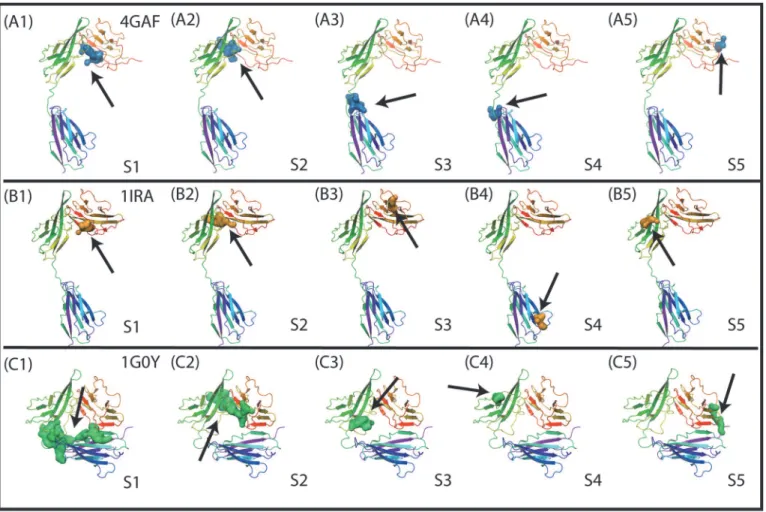
We first performed the Sitemap analysis to identify the small molecule binding sites in the crys-tal structures of three different ligand-bound IL-1R1 conformations. Two common binding sites were identified in the EBI-005- and IL-1Ra-bound IL-1R1 structures (cf.Fig. 4A1, 4A2, 4B1, 4B2). Both sites are located at the interface between D1 and D2 domains. A similar bind-ing site at the same location was detected in the AF10847-bound IL-1R1 structure (Fig. 4C2). Two smaller binding sites close to the loop between D2 and D3 domains were detected in the EBI-005-bound IL-1R1 structure (Figs. 4A3 and 4A4). The top two ranked binding sites based on the Dscore values in the AF10847-bound IL-1R1 are much larger in sizes (volume: 738 and 439 respectively) than most other binding sites with the typical volume of less than 200 (Table 1). For inhibitor development consideration, small molecules bound to S1, S2 in EBI-005- and IL-1Ra-bound IL-1R1 conformations may directly inhibit IL-1R1 binding with the endogenous proteins that required the D1-D2 domains for high binding affinity such as IL-1Ra [28]. In contrast, small molecules bound to S3 and S4 of IL-IL-1Ra can potentially impact on the relative orientation of D3 domain to the D1-D2 domains of IL-1R1. Because AF10847 an-tagonizes IL-1R1 by stabilizing IL-1R1 in an alternative conformation, small molecules bound to S1 of the AF10847-bound IL-1R1 may act as gluing molecules to trap Il-1R1 at this alterna-tive conformation. To assess the potential of developing small molecule inhibitors targeting these sites, we used a druggability index discussed by Halgren’s Sitemap paper[22] which sug-gested undruggable binding sites have Dscore values<0.83. Among the 15 binding sites
To investigate the small molecule binding sites in IL-1R1 conformations sampled by the aMD simulations, a manageable number of conformations are necessary for additional anal-yses. First, a total of 1180 conformations taken at every 100 ps from the combined 118 ns tra-jectory were selected ordered accordingly in the combined tratra-jectory file. Characterization of the structural variations in the 1180 IL-1R1 conformations was analyzed by a second PCA of all 1180 conformations without including the crystal structures. Projection of the 1180 con-formations to the first two PCs of this PCA were shown inFig. 5A. In this PCA, the first two PCs accounted for only 40% of structural variations in all 1180 conformations and were in-sufficient to separate the crystal structures in distinct region. As a comparison, the projection of all 1180 conformations to PC1 and PC2 based on the PCA of the crystal structures was shown inFig. 5B. To account for 90% of structural variations for conformational characteri-zation, the first 38 PCs were included to construct the dendrogram in the hierarchy cluster analysis (seeMethods). Second, 25 cluster groups were obtained by using a cutoff value of 40 Å at the dendrogram. Conformation at the center of each cluster group was used to represent each group whereas members in the same group have similar structural variations based on
provided. Distributions of longitudinal and latitudinal angles were calculated based on the coordinate system. Conformations correspond to three crystal structures were labeled by their PDB entry names.
doi:10.1371/journal.pone.0118671.g003
Fig 4. Small molecule binding site determined by the Sitemap analysis in three different IL-1R1 conformations extracted from the crystal structures.S1-S5 denote the binding site number in each conformation and the arrows point to their locations.
the cutoff values. Finally, the 25 representative conformations from each cluster group were used to represent the structurally different conformations obtained from the aMD simulation.
Table 1. Dscore values, volume sizes, hydrophilic and hydrophobic areas of thefive binding sites in three IL-1R1 crystal structures (PDB entries: 4GAF, 1IRA and 1G0Y) identified by the Sitemap program.
S1 S2 S3 S4 S5
Dscore
4GAF 1.07 0.62 0.66 0.49 0.39
1IRA 0.71 0.93 0.55 0.54 0.47
1G0Y 0.94 1.00 0.74 0.54 0.47
Volume
4GAF 162.58 114.56 160.52 61.06 61.07
1IRA 152.64 120.39 72.72 87.81 72.72
1G0Y 787.19 439.38 117.99 75.46 87.81
Hydrophilic area
4GAF 738.00 560.00 891.00 406.00 462.00
1IRA 755.00 545.00 431.00 598.00 587.00
1G0Y 3970.00 3621.00 482.00 532.00 929.00
Hydrophobic area
4GAF 116.00 43.00 25.00 16.00 10.00
1IRA 91.00 81.00 29.00 9.00 13.00
1G0Y 265.00 219.00 74.00 9.00 67.00
doi:10.1371/journal.pone.0118671.t001
Fig 5. Mapping of IL-1R1 conformations to the first two principal components derived from two different PCAs.(A) PCA is based on the 1180 conformations generated from aMD simulations. Crystal structures were shown in blue circles. (B) The PCA is based on six crystal structures from five PDB entries: 4GAF, 1G0Y, 4DEP (2 chains), 1ITB and 1IRA (denoted by black circles). Representative conformations of the 25 cluster groups were shown in purple circles. Conformations discussed in the text were shown in green circles and labeled.
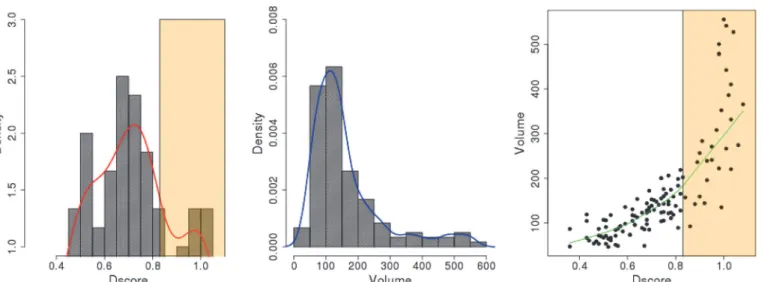
Subsequent Sitemap analysis was performed on the 25 representative conformations to identify small molecule binding sites. As shown inTable 2, 32 of the 121 detected binding sites (27%) gave the Dscore0.83 which is the same as those detected using the three crystal
struc-tures (27%). The distribution of the Dscore values for all binding sites was found to peak at 0.7 inFig. 6. When analyzing the volume of each binding site, conformation490has a very large binding site with a volume of 1330 Å3which is an outlier when compared with the sizes of the binding sites in all other conformations. The average volume of the druggable binding sites (Dscore0.83) detected from the 25 representative conformations is 285.54 Å3which is
great-er than those in the EBI-005- and IL-1Ra-bound IL-1R1 conformations (137.54 Å3). The
differ-ences of the binding site volumes are equivalent to a ligand of 34 versus 11 atoms. Although the peak of the volume distribution is at 150 Å3, an extended tail population between 300
–500
Å3can be found (Fig. 6). The volume sizes at the binding sites may be helpful for selecting ap-propriate sizes of compounds when building a library of compounds for screening. The Dscore value is also linearly proportional to the volume of the binding site although a steeper increase was seen after Dscore = 0.83 inFig. 6. For the druggable binding sites with Dscore0.83, the
binding site volumes are around 200 Å3and higher.
Table 2. Dscore values, Volume sizes of up tofive binding sites identified by the Sitemap program in 25 representative IL-1R1 conformations determined by the hierarchy cluster analysis of 1180 aMD generated conformations.
Conf. S1 S2 S3 S4 S5 Conf. S1 S2 S3 S4 S5
# Dscore # Volume
39 0.98 0.71 0.43 0.56 0.53 39 479.17 151.26 104.62 48.71 61.06
44 1.01 0.77 0.50 0.53 0.55 44 266.51 206.14 67.23 117.65 51.11
65 0.78 0.68 0.56 0.53 0.52 65 123.48 144.06 87.12 66.89 46.65
110 0.82 0.89 0.59 0.74 0.51 110 165.33 236.33 135.83 200.31 71.34
161 0.57 0.86 0.69 0.58 0.55 161 92.61 92.61 172.19 81.29 71.34
184 1.03 0.75 0.69 0.68 0.55 184 220.55 105.30 134.80 97.41 84.38
193 0.66 0.79 0.70 0.68 0.52 193 88.84 159.15 152.64 128.28 64.83
289 1.06 0.99 0.59 0.72 0.48 289 274.40 352.26 98.10 147.83 86.78
291 1.08 0.83 0.67 0.70 0.62 291 365.64 202.37 85.75 138.57 117.31
322 0.50 0.93 0.82 0.64 0.51 322 107.02 195.85 127.94 153.66 90.90
399 0.49 0.81 0.71 0.36 399 69.97 198.60 129.31 47.33
450 0.95 0.80 0.74 0.61 0.51 450 241.13 138.23 123.48 73.40 53.51
490 0.95 0.94 0.77 490 270.89 1331.18 148.18
496 0.98 0.92 0.81 0.75 0.62 496 500.44 144.40 89.18 159.84 130.68
524 1.03 0.91 0.63 0.66 0.63 524 331.68 283.66 115.59 123.14 96.04
562 0.90 0.75 0.51 0.36 0.46 562 159.15 143.03 105.99 86.78 54.19
674 0.93 0.77 0.69 0.63 0.44 674 239.07 141.66 126.57 95.70 60.71
787 1.00 0.98 0.76 0.69 0.57 787 555.66 478.14 165.67 85.06 92.95
854 1.04 0.81 0.74 0.67 854 527.53 183.51 200.31 48.71
903 1.01 0.82 0.84 0.68 0.61 903 442.47 218.83 157.09 123.14 73.75
931 1.03 0.68 0.43 0.48 0.47 931 410.23 107.02 119.02 53.51 59.00
952 0.90 1.02 0.77 0.75 0.74 952 256.56 386.22 121.77 124.51 155.04
1006 0.97 0.73 0.64 0.48 0.43 1006 308.01 140.63 112.85 72.03 66.89
1015 1.01 0.79 0.75 0.62 0.74 1015 541.60 118.34 175.96 104.62 103.93
1151 0.99 0.88 0.98 0.78 0.78 1151 135.14 142.35 222.26 174.59 110.79
Binding sites with the Dscore value0.83 are shown in bold font.
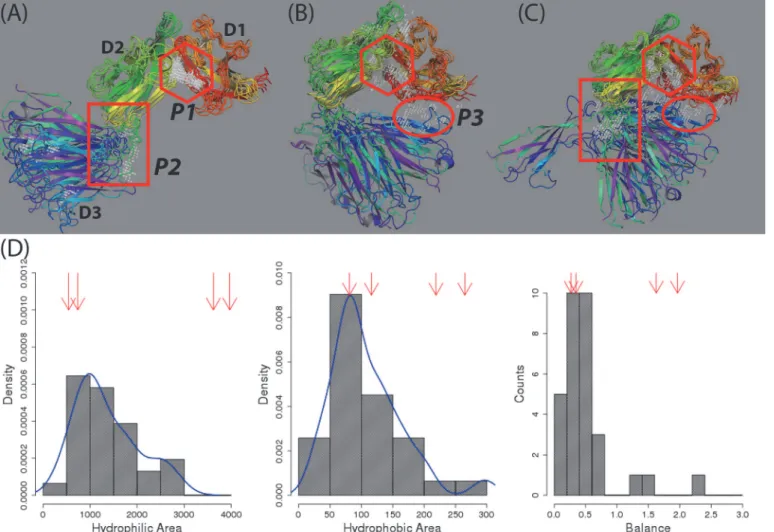
All probe points in the druggable sites of the 25 conformations from Sitemap were shown in grey color in three figures inFig. 7. Most points were found clustered at three common regions (labeled P1, P2 and P3 inFig. 7) which may be useful for developing inhibitors to prevent its binding with known ligands or small molecule modulators to affect the IL-1R1 ectodomain conformation (cf.Fig. 1). For example, P1 pocket can be used to develop inhibitors because it is located at the interface between the D1 and D2 domains which interact with IL-1β, IL-1Ra and
AF10847. Small molecules binding to the P3 pocket located at the interface between the D1 and D3 domains may stabilize the inactive conformation of IL-1R1 similarly to that achieved by AF10847. The P2 pocket is located at the loop region between the D2 and D3 domains and was identified as binding sites in at least two different relative orientations of D3 to D2 do-mains as those shown in Figs.4A3, 4A4and7A. Among the 25 conformations, those with the D3 domain orienting opposite to the D1-D2 domain (seeFig. 7A) have not been observed by experiments.
Small molecule binding hotspot analysis of IL-1R1 based on the
cosolvent mapping method
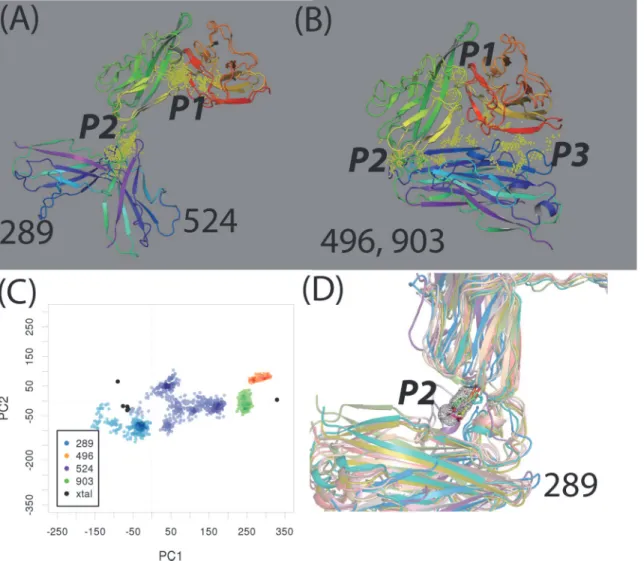
An emerging inhibitor development is to target potential binding sites not directly involved with protein-ligand binding (or allosteric binding sites) [48–50]. We investigated these types of binding sites in 32 druggable sites of 25 representative IL-1R1 conformations. Druggable sites were detected at the P2 and P3 sites in four conformations, i.e.289,496,524and903(Fig. 8A and 8B). While the P2 site was assessed druggable in conformations289,496and903, the P3 site were determined druggable in conformations496and903(seeFig. 8A, 8BandTable 2). To account for the binding site flexibility and its influence on the binding site druggability, we employed the cosolvent mapping method [23–25] for the binding hotspots assessment. Here, we used the phenol as the cosolvent molecule to probe these four IL-1R1 conformations be-cause the phenyl group is frequently found in fragment screening library used to evaluate tar-gets involved in protein-protein interaction[36].
Based on the 4 ns cosolvent MD simulations, we found that conformations496and903 were stable during the simulations when their conformations were mapped to the PC1 and PC2 subspace (Fig. 8C). In contrast, conformations289and524underwent continuous Fig 6. Distributions of Dscore values, volume sizes of the binding sites determined by the Sitemap analysis using 25 representative conformations obtained from the hierarchy cluster analysis.The vanilla color regions correspond to the binding sites with Dscore value0.83.
conformational changes and deviated from their initial conformations. While conformation 289quickly became trapped at a nearby region, conformation524wandered to a larger confor-mational subspace projected by PC1 and PC2 (Fig. 8C). The cosolvent mapping analysis fur-ther characterized the location of the hydrophobic hotspots preferentially bound by the phenyl molecules at the P1, P2 and P3 sites in these four conformations (Fig. 8DandS3 Fig.). Binding modes of phenol molecules at the P1 site in conformation524indicated greater flexibility of the P1 pocket as they interacted with IL-1R1 at multiple locations in the same region (S3 Fig.). For conformations496and903, less mobility of the phenol molecules at the P2 and P3 sites were found (S3 Fig.). For conformation289, the phenol molecules are found to be confined at smaller pockets in the P1 and P2 sites (Fig. 8DandS3 Fig.).
In the cosolvent MD simulations, the specific site found to interact with the probe molecules with less mobility reflects ideal complementary and can be considered as a hotspot region. As-sessment of the results from cosolvent MD simulations indicated that the P2 site of conforma-tion289and903and the P3 site of conformations496and903are binding hotspots using phenol as probes. The druggable property of the P2 site in conformation524was transient as the metastable conformation524deviated substantially from its initial conformation during Fig 7. Locations of druggable sites in 25 representative conformations and their physicochemical properties determined by Sitemap.(A-C), druggable sites (Dscore values0.83) in 25 representative conformations. Consensus binding sites at P1(diamond), P2(square) and P3(circle) locations in all conformations were shown. (D) Distributions of the physicochemical properties of the druggable sites. Balance refers to the ratio of hydrophobic and hydrophilic properties at the binding site. The four red arrows point to the values corresponding to four druggable sites in the crystal structures.
the cosolvent MD simulation. The stability of each conformation was further evaluated by the 8 ns conventional MD simulations in which similar trends of conformational changes were ob-served (cf.Fig. 8CandS4 Fig.). Because conformation289represented a novel conformation of IL-1R1 not reported previously, we then focus on identifying candidate molecules that docked favorably into the P2 site of conformation289and assess their impacts on the IL-1R1 conformations.
Targeting the allosteric modulator site of conformation 289 using
in silico
fragment library screening followed by MD simulations of the top eight
ranked ligands with conformation 289
Based on the Sitemap evaluation and the cosolvent mapping analysis, the P2 site of conforma-tion289warrants further investigation to determine how small molecules bound to the P2 site will affect IL-1R1 adopting the289conformation. Because the comparable size of P2 (352 Å3) Fig 8. Druggble sites, mapping of conformations to PC1 and PC2 in conformations 289, 524, 496, and 903 and the small molecule hotspot at the P2 site of conformation 289.(A-B), druggable sites (yellow points) in conformations 289, 524, 496, and 903 identified by the Sitemap analysis. (C) Mapping of conformations obtained from the cosolvent MD simulations to the PC1-PC2 subspace. (D) The small molecule binding hotspot (the mesh envelop shape) at the P2 site in conformation 289 from the cosolvent mapping analysis. The phenol probe molecules within the mesh envelop region in 12 conformations from the cosolvent MD simulations were shown.
to fragment compounds, we performedin silicoscreening to target the P2 site of conformation
289using the Maybridge fragment library (a total of 2783 compounds). The Glide docking program was used to rank the predicted potencies of the compounds to the P2 site of confor-mation289based on their docked poses. The highest eight ranked compounds (denoted L154, L537, L951, L1192, L1206, L1882, L3097 and L3241) were selected and subject to additional 8 ns MD simulations to evaluate the effects of the ligand binding on IL-1R1 conformations.
InFig. 9, we calculated the root-mean-square deviations (RMSDs) of the backbone atoms in the D1-D2, D3 domains and the heavy atoms of the compounds in reference to the initial li-gand poses and conformation289in the 8 ns MD simulations. All IL-1R1 conformations in the MD simulations were aligned to the D-D2 domain of the initial conformation289. Similar to the observation in the conformational sampling calculations, the D1-D2 domain in all eight fragment-bound IL-1R1 conformations exhibited less than 3 Å backbone deviations (Fig. 9A) except those with L154. The movement of the D3 domain is much greater even with the bind-ing of these fragment ligands. The RMSD distributions of the D3 domain are less than 20 Å for L1192, L3097, L1206, 30 Å for L951, L1882, L537, and 40 Å for L154, L3241 (Fig. 9B). When monitoring the deviations of the ligands from their initial binding site locations, we found four ligands (L951, L1882, L1192 and L537) have major RMSD peak distributions at less than 5 Å whereas the other four (L1206, L3097, L154 and L3241) have broader distributions of RMSDs at greater than 5 Å (Fig. 9C). The RMSD values of L3097 along the trajectory (Fig. 9D) in-formed that L3097 escaped from the binding site. In contrast, L951 and L537 remained at the initial docked positions throughout 8 ns MD simulations (the peak distribution of RMSDs at around 2.5 Å). L1882 was close to its initial docked position only up to 4.8 ns whereas L1192 was up to 3 ns.
To investigate the conformational changes of these ligand-bound IL-1R1 conformations, we mapped them to the PC subspaces derived from the crystal structures. Two dimensional map-ping to PC1/PC2 and PC1/PC3 were provided inFig. 10. The mapping to PC1/PC3 subspace was provided because we found dynamical motion of IL-1R1 along the PC3 in the simulations. The results showed that IL-1R1 conformations obtained from four ligands (L951, L1882, L1192, L537) exhibiting smaller average RMSD values were projected to much localized regions in the PC1/PC2 and PC1/PC3 subspaces. In contrast, larger conformational spaces were visited by IL-1R1 bound with L1206, L154 and L3241. Although L3097 escaped from the docking site at around 0.9 ns, yet it caused IL-1R1 to trap at a local microstate. Based on the mapping of confor-mations to PC1 and PC2, the bound IL-1R1 conforconfor-mations do not overlap with ligand-free IL-1R1 conformations but resembled those obtained from the cosolvent MD simulation.
Fig 9. Distribution and trajectories of root-mean-square-deviations (RMSDs) of backbone atoms in the protein-ligand complexes from simulations.
(A) is the D1-D2 domain, (B) the D3 domain and (C) heavy atoms of the ligands. The initial conformation 289/ligands conformations were used as the reference structures. Chemical structures of the eight ligands are provided in (D).
potentially modulate the IL-1R1 conformations and impact on IL-1R1 binding with other pro-tein ligands. Thus, L951, L1882, L1192 and L537 are attractive candidates for future experi-mental validation and evaluation.
Figs.10and11indicated that L951, L1882, L1192 and L537 bound IL-1R1 conformations underwent less conformational exploration in the PC subspaces (Figs10and11). We further analyzed the protein-ligand poses of these four ligands at 2 ns of MD simulation where the li-gands did not deviate much from their initial poses (RMSDs<5) and interaction between
1R1 and ligands were established. We found a consensus binding site motif at the P2 site of IL-1R1 that interacts with the ligands via a similar type of protein-ligand interaction (Fig. 12). All four ligands interact with the binding pocket formed by R272, R271, V117, E202, E171, R174 and K172 between the D2 and D3 domains of IL-1R1. Salt-bridge interactions between Arg, Lys and Glu at the interface between the D2 and D3 domains establish a mall binding pocket for ligand binding. At the binding site, hydrogen bonds are formed between the hydroxyl groups of L951, L1882, L1192, L537 and E171, R272, E202 respectively. The carbonyl group of L951 and the thiophene group of L1882 form additional hydrogen bonds with R271 and R272. Furthermore, the aromatic rings of L951, L1192 and L537 interact with R271 and R272 via cat-ion-aromatic interactions[51]. In this binding site, V117 is the key hydrophobic amino acid to interact with all ligands.
Fig 10. Mapping of IL-1R1 conformations obtained from different MD simulations to PC1/PC2 and PC1/PC3 subspaces.IL-1R1 conformations were extracted from 15 ns aqueous MD, 4 ns cosolvent MD simulations, L951/289, L1882/289, L1192/289, L537/289, L1206/289, L3097/289, L154/289 and L3241/289 MD simulations and mapped to PC1-PC2 (A-C) and PC1-PC3 (D-E) subspaces.
Conclusion
Existing crystal structures of IL-1R1 with three different ligands including IL-1β, IL-1Ra and
AF10847 indicated the large conformational flexibility of the loop between D1-D2 and D3 do-mains. We hypothesized the existence of transient small molecule binding sites among multiple conformational states accessed by IL-1R1 which may be suitable for inhibitor development. To Fig 11. Mapping of IL-1R1 conformations (blue circles) obtained from the 4 ns cosolvent MD, 8 ns MD simulations of L951/289, L1882/289, L1192/ 289, L1206/289, L3097/289, L154/289 and L324/289 to PC1, PC2 and PC3.Trajectory of 15 ns MD simulations from the ligand-free conformation289was shown in orange circles. Trajectory of L1882/289after 4.8 ns was shown in red circles.
identify these binding sites, we performed efficient conformational sampling of IL-1R1 using the accelerated MD algorithm. In a total of 118 ns aMD simulations started with a super cyto-kine (EBI-005)-bound IL-1R1 structure, we observed that the D3 domain of IL-1R1 exhibited a wide angular motion relative to the D1-D2 domain facilitated by the flexible loop between the D2 and D3 domains. These include the IL-1R1 conformations with close contacts between the D1-D2 and D3 domains mimicking closely to the AF10847-bound IL-1R1 conformation. In addition, we identified unreported IL-1R1 conformations with the D3 domain oriented to a po-sition different from either IL-1Ra- or AF10847-bound IL-1R1 conformations.
Using the Sitemap analyses, we identified small molecule binding sites in the IL-1R1 confor-mations. The druggability index based on the Dscore value of these binding sites was then used to select“druggable”sites in these conformations for further evaluation. Four binding sites in
three IL-1R1 crystal structures and 32 binding sites in 25 representative IL-1R1 conformations Fig 12. Chemical structures of four compounds identified from in silico screening to the P2 site in conformation 289 and snapshots of the IL-1R1/ ligand conformations at 2 ns of MD simulations.L951, L1882, L1192 and L537 interact with IL-1R1 without significant deviations from their initial docked poses up to the 2 ns MD simulations. Residues in IL-1R1 interact with the ligands were shown in stick model and labelled. Hydrogen bonds were depicted in cyan dash lines.
obtained from simulations gave the Dscore values0.83 suggesting that they are potentially
druggable. These druggable binding sites were found at three common locations in IL-1R1 in-cluding 1) the region between the D1 and D2 domain (the P1 Site), 2) the location between the D2 and D3 domains (the P2 site) and 3) the interface region between the D1 and D3 domain (the P3 site) when IL-1R1 adopts an inactive conformation.
Because the P1 and P3 sites can also be identified from existing crystal structures, we fo-cused on investigating compounds potentially bound to the P2 site, an allosteric modulator site. Among the 25 representative conformations classified by the hierarchy cluster analysis, the P2 site in four conformations (289,496,524and903) gave Dscore values0.83 indicating
they are suitable for small molecule ligands binding. To account for the flexibility of the bind-ing sites not included in the Sitemap analysis, we performed the cosolvent mappbind-ing analysis. Only the P2 site of conformation289and903were confirmed to be small molecule binding hotspots.
Because conformation289is a novel conformation not reported previously, anin silico
screening by targeting the P2 site of conformation289was conducted using the Maybridge fragment library. Eight highest ranked ligands were selected and subjected to additional 8 ns conformation289/ligands MD simulations. Four ligands (L951, L1882, L1192 and L537) bound to the P2 site of conformation289for an extended period of time in the simulations and restricted the IL-1R1 conformations to a relatively localized region in the principal compo-nent subspaces. We further identified key residues in IL-1R1, including R271, R272, E202, E171 and V117, forming the binding pocket at the P2 site to interact with the ligands. The results suggested small molecule ligands can potentially bind to the P2 site of IL-1R1 and mod-ulate the IL-1R1 conformations. Because conformation289differs from the IL-1R1 conforma-tions observed in the crystal structures, potent chemical probes developed to target the P2 site of conformation289can potentially restrict IL-1R1 to an inactive conformation which abro-gates the downstream IL-1 signaling. Additionalin vitroexperimental evaluation can validate
our approach of discovering small molecule compounds targeting the allosteric modulator site in the ectodomain of IL-1R1. This strategy is attractive for the development of small molecule therapeutics targeting this difficult target that involved in protein-protein interaction and can potentially be applicable to other interleukin receptor proteins.
Supporting Information
S1 Fig. Projection to PC1 and PC2 subspaces using IL-1R1 conformations obtained from 37, 20 and 20 ns conventional MD simulations started with the EBI005, IL-1Ra and AF-10847 bound conformations.The green and red circles correspond to the initial and final con-formations during the equilibrium production runs. The black circles correspond to the crystal structures.
(TIF)
S2 Fig. Projection to PC1, PC2 and PC3 subspaces using IL-1R1 conformations obtained from the accelerated MD simulations.Crystal structures were show in black circles as reference.
(TIF)
(F). All conformations were aligned the D1-D2 domains of the initial IL-1R1 conformations. (TIF)
S4 Fig. Projection to the PC1 and PC2 using conformations obtained from the 8 ns aque-ous MD simulation of conformation 289, 496, 524 and 903.
(TIF)
Acknowledgments
We would like to thank Mr. Andrew Kalenkiewicz for providing the hierarchy cluster script and valuable discussions with Mr. Andrew Kalenkiewicz, Drs. Guido Scarabelli and Barry Grant for the use of the Bio3D program and accelerated MD simulations. We thank Dr. Shao-meng Wang for providing computing resources for this work and Dr. Sophie Paczesny for helpful comments on the manuscript.
Author Contributions
Conceived and designed the experiments: CYY. Performed the experiments: CYY. Analyzed the data: CYY. Contributed reagents/materials/analysis tools: CYY. Wrote the paper: CYY.
References
1. Dinarello CA (2013) Overview of the interleukin-1 family of ligands and receptors. Semin Immunol 25: 389–393. doi:10.1016/j.smim.2013.10.001PMID:24275600
2. Garlanda C, Dinarello CA, Mantovani A (2013) The interleukin-1 family: back to the future. Immunity 39: 1003–1018. doi:10.1016/j.immuni.2013.11.010PMID:24332029
3. Dinarello CA, Novick D, Kim S, Kaplanski G (2013) Interleukin-18 and IL-18 binding protein. Front Immunol 4: 289. doi:10.3389/fimmu.2013.00289PMID:24115947
4. Dinarello CA (2009) Immunological and inflammatory functions of the interleukin-1 family. Annu Rev Immunol 27: 519–550. doi:10.1146/annurev.immunol.021908.132612PMID:19302047
5. Symons JA, Young PR, Duff GW (1995) Soluble type II interleukin 1 (IL-1) receptor binds and blocks processing of IL-1 beta precursor and loses affinity for IL-1 receptor antagonist. Proc Natl Acad Sci U S A 92: 1714–1718. PMID:7878046
6. Tominaga S-i (1989) A putative protein of a growth specific cDNA from BALB/C-3T3 cells is highly simi-lar to the extracellusimi-lar portion of mouse interleukin 1 receptor. FEBS Letters 258: 301–304. PMID:
2532153
7. Hayakawa H, Hayakawa M, Kume A, Tominaga S (2007) Soluble ST2 blocks interleukin-33 signaling in allergic airway inflammation. J Biol Chem 282: 26369–26380. PMID:17623648
8. Tajima S, Bando M, Ohno S, Sugiyama Y, Oshikawa K, Tominaga S, et al. (2007) ST2 gene induced by type 2 helper T cell (Th2) and proinflammatory cytokine stimuli may modulate lung injury and fibrosis. Exp Lung Res 33: 81–97. PMID:17454104
9. Dinarello CA, van der Meer JW (2013) Treating inflammation by blocking interleukin-1 in humans. Semin Immunol 25: 469–484. doi:10.1016/j.smim.2013.10.008PMID:24275598
10. Reddy S, Jia S, Geoffrey R, Lorier R, Suchi M, Broeckel U, et al. (2009) An Autoinflammatory Disease Due to Homozygous Deletion of the IL1RN Locus. New England Journal of Medicine 360: 2438–2444. doi:10.1056/NEJMoa0809568PMID:19494219
11. Liew FY, Pitman NI, McInnes IB (2010) Disease-associated functions of IL-33: the new kid in the IL-1 family. Nat Rev Immunol 10: 103–110. doi:10.1038/nri2692PMID:20081870
12. Vander Lugt MT, Braun TM, Hanash S, Ritz J, Ho VT, Antin JH, et al. (2013) ST2 as a marker for risk of therapy-resistant graft-versus-host disease and death. N Engl J Med 369: 529–539. doi:10.1056/
NEJMoa1213299PMID:23924003
13. Nelson RP Jr, Khawaja MR, Perkins SM, Elmore L, Mumaw CL, Orschell C, et al. (2014) Prognostic Biomarkers for Acute Graft-versus-Host Disease Risk after Cyclophosphamide-Fludarabine Nonmye-loablative Allotransplantation. Biol Blood Marrow Transplant 20: 1861–1864. doi:10.1016/j.bbmt.2014.
06.039PMID:25017764
15. Dinarello CA (2010) IL-1: discoveries, controversies and future directions. Eur J Immunol 40: 599–606. doi:10.1002/eji.201040319PMID:20201008
16. Atanasova M, Whitty A (2012) Understanding cytokine and growth factor receptor activation mecha-nisms. Crit Rev Biochem Mol Biol 47: 502–530. doi:10.3109/10409238.2012.729561PMID:
23046381
17. Kravchenko VV, Gloeckner C, Stowe GN, Kang YJ, Tobias PS, Mathison JC, et al. (2012) The use of small molecule probes to study spatially separated stimulus-induced signaling pathways. Bioorganic & Medicinal Chemistry Letters 22: 2043–2045.
18. Wells JA, McClendon CL (2007) Reaching for high-hanging fruit in drug discovery at proteprotein in-terfaces. Nature 450: 1001–1009. PMID:18075579
19. Hou J, Townson SA, Kovalchin JT, Masci A, Kiner O, Shu Y, et al. (2013) Design of a superior cytokine antagonist for topical ophthalmic use. Proc Natl Acad Sci U S A 110: 3913–3918. doi:10.1073/pnas.
1217996110PMID:23431173
20. Vigers GP, Dripps DJ, Edwards CK 3rd, Brandhuber BJ (2000) X-ray crystal structure of a small antago-nist peptide bound to interleukin-1 receptor type 1. J Biol Chem 275: 36927–36933. PMID:10903327
21. Hamelberg D, Mongan J, McCammon JA (2004) Accelerated molecular dynamics: a promising and effi-cient simulation method for biomolecules. J Chem Phys 120: 11919–11929. PMID:15268227
22. Halgren TA (2009) Identifying and characterizing binding sites and assessing druggability. J Chem Inf Model 49: 377–389. doi:10.1021/ci800324mPMID:19434839
23. Yang C-Y, Wang S (2012) Analysis of Flexibility and Hotspots in Bcl-xL and Mcl-1 Proteins for the De-sign of Selective Small-Molecule Inhibitors. ACS Medicinal Chemistry Letters 3: 308–312. doi:10. 1021/ml200301wPMID:24900469
24. Yang C-Y, Wang S (2010) Computational Analysis of Protein Hotspots. ACS Medicinal Chemistry Let-ters 1: 125–129. doi:10.1021/ml100026aPMID:24900186
25. Yang C-Y, Wang S (2011) Hydrophobic Binding Hot Spots of Bcl-xL Protein−Protein Interfaces by
Cosolvent Molecular Dynamics Simulation. ACS Medicinal Chemistry Letters 2: 280–284. doi:10.
1021/ml100276bPMID:24900309
26. Thomas C, Bazan JF, Garcia KC (2012) Structure of the activating IL-1 receptor signaling complex. Nat Struct Mol Biol 19: 455–457. doi:10.1038/nsmb.2260PMID:22426547
27. Wang D, Zhang S, Li L, Liu X, Mei K, Wang X (2010) Structural insights into the assembly and activation of IL-1beta with its receptors. Nat Immunol 11: 905–911. doi:10.1038/ni.1925PMID:20802483
28. Schreuder H, Tardif C, Trump-Kallmeyer S, Soffientini A, Sarubbi E, Akeson A, et al. (1997) A new cyto-kine-receptor binding mode revealed by the crystal structure of the IL-1 receptor with an antagonist. Na-ture 386: 194–200. PMID:9062194
29. Vigers GP, Anderson LJ, Caffes P, Brandhuber BJ (1997) Crystal structure of the type-I interleukin-1 re-ceptor complexed with interleukin-1beta. Nature 386: 190–194. PMID:9062193
30. MOE. Montreal, Quebec, Canada: Chemical Computing Group.
31. Case DA, Darden TA, TE Cheatham I, Simmerling CL, Wang J, Duke RE, et al. (2012) AMBER 12. San Francisco: University of California.
32. Wang J, Cieplak P, Peter A. Kollman (2000) How well does a restrained electrostatic potential (RESP) model perform in calculating conformational energies of organic and biological molecules? Journal of Computational Chemistry 21: 1049–1074.
33. Jorgensen WL, Chandrasekhar J, Madura JD, Impey RW, Klein ML (1983) Comparison of simple po-tential functions for simulating liquid water. The Journal of Chemical Physics 79: 926–935.
34. Ryckaert J-P, Ciccotti G, Berendsen HJC (1977) Numerical integration of the cartesian equations of motion of a system with constraints: molecular dynamics of n-alkanes. Journal of Computational Phys-ics 23: 327–341.
35. Darden T, York D, Pedersen L (1993) Particle Mesh Ewald—an N.Log(N) Method for Ewald Sums in Large Systems. Journal of Chemical Physics 98: 10089–10092.
36. Hajduk PJ, Huth JR, Fesik SW (2005) Druggability indices for protein targets derived from NMR-based screening data. J Med Chem 48: 2518–2525. PMID:15801841
37. Frisch MJ, Trucks GW, Schlegel HB, Scuseria GE, Robb MA, Cheeseman JR, et al. (2009) Gaussian 09, Revision A.1. Wallingford CT: Gaussian, Inc.
38. Bayly CI, Cieplak P, Cornell WD, Kollman PA (1993) A Well-Behaved Electrostatic Potential Based Method Using Charge Restraints for Deriving Atomic Charges—the Resp Model. Journal of Physical Chemistry 97: 10269–10280.
40. Edgar RC (2004) MUSCLE: multiple sequence alignment with high accuracy and high throughput. Nu-cleic Acids Res 32: 1792–1797. PMID:15034147
41. Team DC (2010) Development Core Team, R: A language and environment for statistical computing. R Foundation for Statistical Computing, Vienna, Austria. ISBN 3-900051-07-0.
42. Halgren TA, Murphy RB, Friesner RA, Beard HS, Frye LL, Pollard WT, et al. (2004) Glide: a new ap-proach for rapid, accurate docking and scoring. 2. Enrichment factors in database screening. J Med Chem 47: 1750–1759. PMID:15027866
43. Congreve M, Carr R, Murray C, Jhoti H (2003) A 'rule of three' for fragment-based lead discovery? Drug Discov Today 8: 876–877. PMID:14554013
44. Akeson AL, Woods CW, Hsieh LC, Bohnke RA, Ackermann BL, Chan KY, et al. (1996) AF12198, a novel low molecular weight antagonist, selectively binds the human type I interleukin (IL)-1 receptor and blocks in vivo responses to IL-1. J Biol Chem 271: 30517–30523. PMID:8940020
45. Hubbard SJ, Thornton JM (1993) 'NACCESS', Computer Program. Department of Biochemistry and Molecular Biology, University College London.
46. Hailey KL, Capraro DT, Barkho S, Jennings PA (2013) Allosteric Switching of Agonist/Antagonist Activi-ty by a Single Point Mutation in the Interluekin-1 Receptor Antagonist, IL-1Ra. Journal of Molecular Biol-ogy 425: 2382–2392. doi:10.1016/j.jmb.2013.03.016PMID:23499887
47. Yanofsky SD, Baldwin DN, Butler JH, Holden FR, Jacobs JW, Balasubramanian P, et al. (1996) High affinity type I interleukin 1 receptor antagonists discovered by screening recombinant peptide libraries. Proc Natl Acad Sci U S A 93: 7381–7386. PMID:8693002
48. Nussinov R, Tsai CJ (2013) Allostery in disease and in drug discovery. Cell 153: 293–305. doi:10. 1016/j.cell.2013.03.034PMID:23582321
49. Kar G, Keskin O, Gursoy A, Nussinov R (2010) Allostery and population shift in drug discovery. Curr Opin Pharmacol 10: 715–722. doi:10.1016/j.coph.2010.09.002PMID:20884293
50. Lee GM, Craik CS (2009) Trapping Moving Targets with Small Molecules. Science 324: 213–215. doi:
10.1126/science.1169378PMID:19359579
51. Dougherty DA (2013) The cation-pi interaction. Acc Chem Res 46: 885–893. doi:10.1021/ar300265y