Article
Printed in Brazil - ©2017 Sociedade Brasileira de Química0103 - 5053 $6.00+0.00*e-mail: [email protected]
Studies of the Interaction between BSA and a Plumeran Indole Alkaloid Isolated
from the Stem Bark of
Aspidosperma cylindrocarpon
(Apocynaceae)
Otávio A. Chaves,a Flávia S. M. Teixeira,a Heloisa A. Guimarães,b
Raimundo Braz-Filho,a,b Ivo José C. Vieira,b Carlos Mauricio R. Sant’Anna,a
José Carlos Netto-Ferreira,a,c Dari Cesarin-Sobrinhoa and Aurélio B. B. Ferreira*,a
aDepartamento de Química, Universidade Federal Rural do Rio de Janeiro, BR-465 km 7,
23970-000 Seropédica-RJ, Brazil
bLaboratório de Ciências Químicas, Universidade Estadual do Norte Fluminense Darcy Ribeiro,
Av. Alberto Lamego, 2000, 28013-612 Campos dos Goytacazes-RJ, Brazil
cDivisão de Metrologia Química, Instituto Nacional de Metrologia, Qualidade e Tecnologia
(INMETRO), 25250-020 Duque de Caxias-RJ, Brazil
Binding between bovine serum albumin (BSA) and a plumeran indole alkaloid (PIA) isolated from the stem bark of Aspidosperma cylindrocarpon (Apocynaceae) was studied by spectroscopic techniques (UV-Vis absorption, circular dichroism, steady state and time-resolved fluorescence), combined with molecular docking. Steady state and time resolved fluorescence data revealed that PIA can quench the BSA fluorescence via a static mechanism: energy transfer from BSA to PIA occurs with high probability. The binding is strong (Kb ca. 105-106 L mol-1), spontaneous (∆G° ca. –35.7 kJ mol-1 at 310 K) and entropy-driven (∆S° = 0.146 kJ mol-1 K-1). There is just one main
binding site (n ca. 1) for the BSA:PIA interaction and the α-helix content of the albumin does not suffer significant perturbation upon PIA binding. Molecular docking results suggest site I as the main binding site to PIA, which is able to interact with the Trp-212, Arg-217, Val-342 and Pro-446 residues.
Keywords: bovine serum albumin, Aspidosperma cylindrocarpon, fluorescence quenching,
circular dichroism, molecular docking
Introduction
The Apocynaceae family consists of 424 genera, divided into 17 tribes that are subdivided into five subfamilies: Rauwolfioideae, Apocynoideae, Asclepioideae, Periplocoideae and Secamonioideae. About 400 species of Apocynaceae have been identified and grouped into 41 genera in Brazil, 78% of which are found only in the Amazonia region,1 among them, Aspidosperma cylindrocarpon from the Polyneura series (popularly known in Brazil as “peroba-osso” or “peroba-rosa”). It has a high content of indole alkaloids and has been extensively studied in phytochemistry and pharmacology.2 Many indole alkaloids with distinct biological activities are described in the literature; among
them, anhydrovinblastine, vinblastine and vincristine with antitumour effects,3 usambarensine, with atopine-like and spasmolytic activities, and dihydrotoxiferine, calebassine, C-curarine and afrocurarine as competitive neuromuscular blocking agents.4 Besides, reserpine shows lethal activity against the larvae of Artemia franciscana5 and aspidolimidine and aspidoalbine present antimalarial activity.6 N1-Cinnamoyl-12-demethoxycylindrocarine (methyl (2β,12β,19α)-1-[(2E)-3-phenylprop-2-enoyl] aspidospermidin-21-oate) (PIA, Figure 1) is an indole alkaloid with antimalarial activity, obtained from the stem bark of Aspidosperma cylindrocarpon.7
and biochemical applications.8 Generally, human serum albumin (HSA) can be replaced by bovine serum albumin (BSA) in laboratory experiments, due to the low cost of the latter, since BSA shares 76% identity in protein
sequence when compared to HSA.9 Crystal structure
analysis have revealed that HSA has only one tryptophan
residue (Trp-214) in subdomain IIA,10 whereas BSA
has two tryptophan residues (Trp-134 and Trp-212) located in subdomains IB and IIA, respectively.11 BSA is a single polypeptide chain consisting of about 582 amino acid residues and no carbohydrates. At pH 5-7 it contains 17 intra-chain disulfide bridges and 1 sulfhydryl group.12
Serum albumin (SA) plays an important function as a carrier for different types of biological molecules, with the effectiveness of a compound in acting as a pharmaceutical agent being dependent on its binding ability to this protein. Thus, the study of plumeran indole alkaloid (PIA) interaction with SA to better understand its biodistribution and biocompatibility in the bloodstream is of considerable importance. Currently, the mechanism of protein binding to PIA is not well characterized.
Experimental
Materials
Bovine serum albumin and PBS buffer (pH = 7.4) were purchased from Sigma-Aldrich Chemical Company (USA). One tablet of PBS yields 0.01 mol L-1 phosphate buffer, 0.0027 mol L-1 potassium chloride and 0.137 mol L-1 sodium chloride, pH 7.4, at 298 K. Solvent ethanol (spectroscopic grade) was purchased from Vetec Química Fina, Brazil. The stem bark of Aspidosperma cylindrocarpon was collected near the Reserva Florestal Vale, Linhares, Espírito Santo State, Brazil. The isolation and characterization of PIA was performed according to the literature.7
Methods and instruments
UV-Vis, fluorescence and circular dichroism (CD) spectra were measured on a Jasco J-815 spectrometer, in a 1 cm quartz cell and employing a thermostatic cuvette holder Jasco PFD-425S15F. Time-resolved fluorescence spectroscopy was performed on a FS920 Edinburgh Instruments spectrofluorimeter. The detection system was equipped with a TMS300 monochromator and a NIR Hamamatsu model H1033-45 photomultiplier. Excitation and emission slits were 10 nm and the measurement temperature was 296 K. All spectra were recorded with appropriate background corrections.
UV-Vis spectra were recorded for a 3.0 mL solution of PIA in ethanol, with a concentration of 1.00 × 10⁻⁵ mol L-1 at 310 K. The fluorescence spectra were measured in the range 300-450 nm, at 296, 303 and 310 K, with excitation wavelength at 280 nm. Firstly, the spectrum for a 3.0 mL solution containing BSA (1.00 × 10⁻⁵ mol L-1, in PBS solution at pH = 7.4) was recorded. Then, the fluorescence emission spectrum of solutions resulting from successive addition of aliquots from a stock solution of PIA (1.00 × 10⁻³ mol L-1, in ethanol), with final concentrations of 0.28; 0.56; 0.84; 1.12; 1.40; 1.67; 1.95; 2.22 × 10⁻⁶ mol L-1, were also recorded.
Circular dichroism spectra were measured in the range of 200-260 nm, at 310 K. First, spectrum for free BSA solution (1.00 × 10⁻⁶ mol L-1 in PBS solution pH = 7.4) was recorded and after, the spectrum resulting from the addition of the maximum concentration of PIA (2.22 × 10⁻⁶ mol L-1) to the BSA solution was also recorded. Since even at this relatively high concentration of PIA, the effect on the structure of the protein was quite small (see Results and Discussion section), we did not measure BSA CD spectra for lower PIA concentration values.
Time-resolved fluorescence measurements were performed with λexc = 280 ± 10 nm; pulse of 850 ps with energy of 1.8 µW per pulse, monitoring emission at 345 nm. To a 3 mL of BSA solution (1.00 × 10⁻⁵ mol L-1, in PBS solution pH = 7.4) successive aliquots of PIA with different concentrations (ca. 0.28; 1.40; 2.22 × 10⁻⁶ mol L-1) were added. Fluorescence decay was obtained for free BSA solution and for BSA containing different concentrations of PIA at 296 K.
Molecular modeling
The crystallographic structure of bovine serum albumin was obtained from the Protein Data Bank (PDB) with access code 4F5S.13 This structure has a resolution of 2.47 Å. The PIA structure was built and energy-minimized with the
Figure 1. Chemical structure for N1-cinnamoyl-12-demethoxycylindrocarine
semiempirical method PM614 available at the Spartan’14 program (Wavefunction, Inc.).15
Molecular docking was performed with the GOLD 5.2 program (CCDC). Hydrogen atoms were added to the protein according to the data inferred by the program on the ionization and tautomeric states.16 From the spectroscopic results (fluorescence quenching studies in the Results and Discussion section), we were able to learn that PIA is probably bound next to one of the internal albumin fluorophores (Trp-134 or Trp-212). In order to identify the main binding site on the protein, we defined a spherical domain of 10 Å radius around each tryptophan residue, namely Trp-134 and Trp-212; then we carried out docking calculations with the ligand (PIA) inside each of those domains, considered as the two possible interaction cavities. The score of each pose identified is calculated as the negative of the sum of a series of energy terms involved in the protein-ligand interaction process, so that the more positive the score, the better is the interaction. The number of genetic operations (crossover, migration, mutation) in each docking run used in the searching procedure was set to 100,000. The program optimizes hydrogen-bond geometries by rotating all hydroxyl and amino groups of the amino acid side chains. The scoring function used was ChemPLP,17 which is the default function of the GOLD 5.2 program. We used the Student’s t-test to determine if the difference between any two data sets was statistically significant. The figures of the docking poses with the highest docking score value were generated with the PyMOL Delano Scientific LLC program.18
Results and Discussion
Fluorescence quenching studies
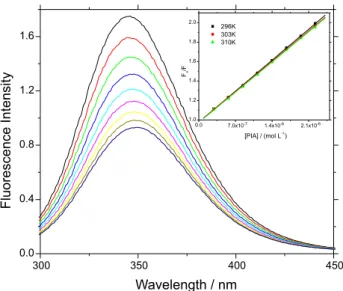
The interaction of PIA with BSA was monitored by studying the fluorescence quenching of BSA with increasing PIA concentrations. Figure 2 clearly shows that the fluorescence intensity of BSA decreased in the presence of PIA, indicating that the latter is binding next to one of the two tryptophan residues (Trp-134 or Trp-212) of the protein.19 Furthermore, a small red shift (from 345 to 350 nm) is observed upon increasing PIA concentration, which suggests an increase in the hydrophobicity of the microenvironment around the tryptophan residue to which PIA is associated.20
Different processes can decrease the intensity of fluorescence. In general, the most common are static and dynamic quenching. The former occurs as a result of the formation of a non-fluorescent complex between a fluorophore in its ground-state and a non-fluorescent
molecule.21 Commonly the quenching of fluorescence can be described through a Stern-Volmer analysis (equation 1), and employing the well known relationship between kq and
KSV, as shown in equation 2:22
(1)
(2)
where, F0 and F are the fluorescence intensities of BSA in the absence and in the presence of PIA, respectively; KSV is
the Stern-Volmer quenching constant, kq is the bimolecular
quenching rate constant of BSA fluorescence, [Q] is the PIA concentration and τ0 is the lifetime of BSA in water (6.10 ± 0.20 × 10⁻⁹ s, obtained experimental value in the Table 1).
From the inset in Figure 2 it is possible to calculate KSV values employing equation 1, from which kq can be obtained. As can be seen in Table 1, KSV values decrease
with increasing temperature and the bimolecular quenching rate constants (kq ca. 1013 L mol-1 s-1) are higher than the
diffusion rate constant (kdiff ca. 5.0 × 10⁹ L mol-1 s-1 in water,
at 298 K),23 indicating that the most probable mechanism responsible for the fluorescence quenching of BSA by PIA is static, as a consequence of an association in the ground-state between the fluorophore and the quencher.22,24 In order to further confirm which type of fluorescence quenching mechanism is involved on the BSA:PIA interaction, time-resolved fluorescence spectroscopy measurements were
Figure 2. Fluorescence emission spectra of BSA and its fluorescence quenching by successive addition of PIA. Conc.BSA = 1.00 × 10⁻⁵ mol L-1,
Conc.PIA = 0.28; 0.56; 0.84; 1.12; 1.40; 1.67; 1.95; 2.22 × 10⁻⁶ mol L-1,
pH = 7.4, T = 296 K, λexc = 280 nm. Inset: Stern-Volmer plots for the
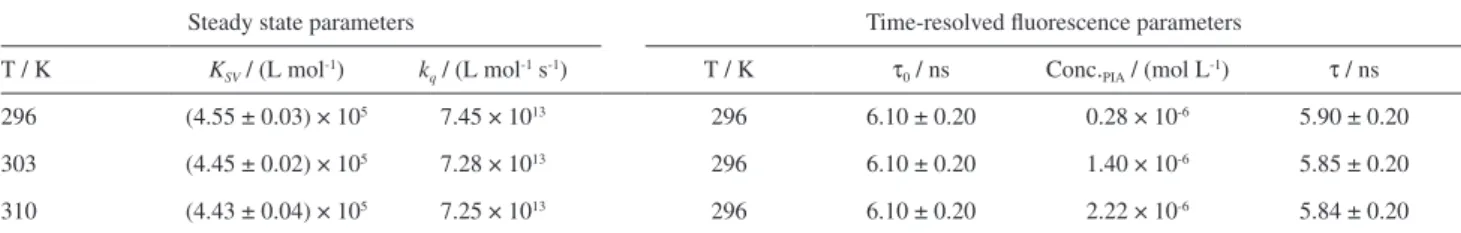
carried out. The fluorescence lifetime of free BSA and BSA:PIA at three different concentrations of quencher is practically the same, ranging from 6.10 ± 0.20 to 5.84 ± 0.20 ns. Since the fluorescence lifetime of BSA is unaffected by the presence of PIA in the concentration range from 0 to 2.22 × 10⁻⁶ mol L-1 (Figure 3 and Table 1) one can conclude that the fluorescence quenching mechanism is static, which implies a ground-state association between the tryptophan residue in BSA and PIA.25
When small molecules bind independently to a set of equivalent sites on a macromolecule, the binding constant (Kb) and the number of binding sites (n) can be
calculated by using the logarithmic relationship expressed by equation 3:26
(3)
where F0 and F are the fluorescence intensities in the absence and presence of PIA (at concentration [Q] mol L-1), respectively, Kb is the binding constant for the multi-binding
site case, and n is the number of binding sites.
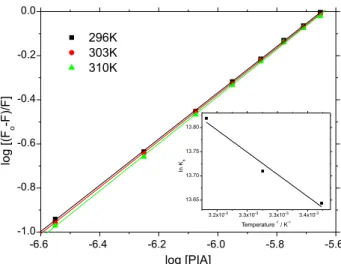
The Kb values shown in Table 2 were obtained from
the plots in Figure 4 and are in the range 105-106 L mol-1, indicating a strong interaction between BSA and PIA.27,28 The increase in Kb values with increasing temperature can
be caused by a slight expansion of the binding site which
might accommodate more PIA molecules.29 As BSA
structure has two different tryptophan residues (Trp-134 and Trp-212), located in different pockets in the BSA structure, the number of binding sites (n) was calculated to know if both or just one of these sites is able to interact with PIA. As shown in Table 2, the n values at different temperatures (n ca. 1.0 at 296, 303 and 310 K) indicate the existence of just one main binding site in the BSA structure for PIA.30
Basically, four main types of interaction (hydrogen bond, electrostatic, van der Waals and hydrophobic forces) play critical roles in the association between small molecules and macromolecules. In order to characterize the forces between PIA and BSA, thermodynamic parameters were calculated using the van’t Hoff equation (equation 4) and the Gibbs free energy equation (equation 5):31
(4)
(5)
where, ∆H°, ∆S°, ∆G° are the enthalpy, entropy and Gibbs free energy change, respectively; R is the gas constant (R = 8.314 × 10⁻³ kJ mol-1 K-1), T is the temperature (296, 303 and 310 K) and Kb the binding constant.
Thermodynamic parameters obtained from the inset in Figure 3 are presented in Table 2. The binding of PIA to BSA is spontaneous, as indicated by the negative ∆G° values, accompanied by a positive entropy change (∆S°). Therefore, the binding process is entropically driven. This binding involves an endothermic association as manifested by the positive ∆H° value, which is consistent with the increase in Kb values with the increase of the temperature.32
According to Ross and Subramanian’s proposal,33∆H° > 0 and ∆S° > 0 suggest hydrophobic interaction as the main binding force for the association BSA:PIA.
Figure 3. Time-resolved fluorescence decays of BSA solution and BSA:PIA. [BSA] = 1.00 × 10⁻⁵ mol L-1, [PIA] = 0-2.22 × 10⁻⁶ mol L-1 in
PBS buffer, pH = 7.4, at room temperature (296 K).
Table 1. Steady state (KSV and kq) at 296, 303, 310 K and time-resolved fluorescence parameters (τ0 and τ) for BSA: PIA at 310 K
Steady state parameters Time-resolved fluorescence parameters
T / K KSV / (L mol-1) kq / (L mol-1 s-1) T / K τ
0 / ns Conc.PIA / (mol L-1) τ / ns
296 (4.55 ± 0.03) × 105 7.45 × 10¹³ 296 6.10 ± 0.20 0.28 × 10⁻⁶ 5.90 ± 0.20
303 (4.45 ± 0.02) × 105 7.28 × 10¹³ 296 6.10 ± 0.20 1.40 × 10⁻⁶ 5.85 ± 0.20
310 (4.43 ± 0.04) × 105 7.25 × 10¹³ 296 6.10 ± 0.20 2.22 × 10⁻⁶ 5.84 ± 0.20
Energy transfer from BSA to PIA
Förster resonance energy transfer (FRET) is a mechanism for energy transfer from a donor molecule (BSA) to an acceptor (PIA) through nonradiative dipole-dipole coupling, and is widely used to estimate the spatial distances between the donor and the acceptor.34 The energy transfer efficiency (E) from BSA to PIA can be given by the equation 6:
(6)
where F0 and F are the donor fluorescence intensities in the absence and in the presence of an acceptor, respectively, r is the distance between acceptor and donor; R0 is the critical distance when the efficiency of energy transfer is 50%, which can be calculated from equation 7:35
(7)
where K2 is the spatial orientation factor of the dipole (K2 = 2/3 for random orientation in fluid solution), n is the average refraction index of the medium (usually
resulting in a value of 1.336, which is the average for water containing organic matter),35Φ is the fluorescence quantum yield of the donor (BSA) in the absence of PIA (Φ = 0.15)36 and J is the overlap integral between the emission spectrum of the donor and the absorption
spectrum of the acceptor. J can be calculated from
Figure 5 and equation 8:
(8)
where F(λ) is the normalized fluorescence intensity of the donor at the wavelength λ. ε(λ) is the extinction coefficient of the acceptor at λ.
The overlap integral value (J) between the emission spectrum of BSA and the absorption spectrum of PIA is 2.98 × 10⁻¹⁴ cm3 L mol-1, giving R
0 ca. 3.50 nm, E ca. 46% and r ca. 4.00 nm. Since the distance between BSA and PIA (r) is between 2 and 8 nm, in full agreement with the rule 0.5R0 < r0 < 1.5R0, the energy transfer from BSA to PIA must occur with high probability.37 In addition, the experimental observation that the r0 value is larger than R0, is a clear indication that the main fluorescence quenching mechanism for BSA:PIA is via a static quenching process.28 Figure 4. Double logarithmic plot for the interaction BSA:PIA at 296, 303
and 310 K. Inset: van’t Hoff plot obtained from the double logarithmic plot at three different temperatures.
Table 2. Binding constant (Kb), number of binding sites (n), entropy change (∆S°), enthalpy change (∆H°) and Gibbs free energy change (∆G°) values for BSA:PIA at 296, 303 and 310 K
T / K Kb / (L mol-1) n ∆H° / (kJ mol-1) ∆S° / (kJ mol-1 K-1) ∆G° / (kJ mol-1)
296 8.42 × 10⁵ 1.049 ± 0.005 9.54 0.146 –33.7
303 8.99 × 10⁵ 1.053 ± 0.003 9.54 0.146 –34.7
310 1.00 × 10⁶ 1.069 ± 0.006 9.54 0.146 –35.7
r2 for Kb and n: 0.9999-0.9980; r2 for ∆H°, ∆S° and ∆G°: 0.9580.
Effect of the binding of PIA on the secondary structure of BSA
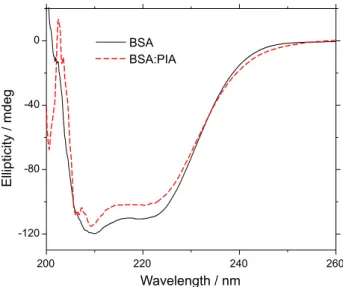
To identify possible structural changes in the α-helix structure of BSA after binding with PIA at 310 K, CD experiments were carried out at the higher PIA concentration (2.22 × 10⁻⁶ mol L-1) used. The CD spectrum of BSA at physiological pH exhibits two negative bands in the ultraviolet region, at 208 nm (π→π* transition) and at 222 nm (n→π* transition), which are characteristic of an α-helical protein.38 As can be seen in Figure 6, the decrease in the absorption intensity at 208 and 222 nm upon PIA addition, indicates the destabilization of BSA helical structure, suggesting possible changes in the protein secondary structure.35
In order to obtain quantitative values for the CD results, first we can express the ellipticity for free BSA and BSA:PIA in terms of significant molar residual ellipticity (MRE, in deg cm2 dmol-1), calculated according to equation 9:38
(9)
where, θ is the observed ellipticity (mdeg); n is the number of amino acid residues (582 to BSA),39 l is the length of the optical cuvette (1 cm) and Cp is the molar concentration of
BSA (1.00 × 10⁻⁶ mol L-1).
From the MRE values at 208 and 222 nm one can apply equations 10 and 11 to obtain the loss of helical structure due to ligand binding:24,35
(10)
(11)
where, MRE208 and MRE222 are the significant molar residual ellipticities (deg cm2 dmol-1) at 208 and 222 nm, respectively.
In the absence of PIA, the α-helix content of the secondary structure of BSA was about 55.6 and 54.1% at 208 and 222 nm, respectively. On the other hand, when in the presence of PIA, these values changed to 50.2% at 208 nm and 49.5% at 222 nm. The conformational change was about 5.4 and 4.6% at 208 and 222 nm, respectively, at 310 K, indicating only a very small change on the secondary structure of the protein upon PIA binding. Thus, this binding does not cause significant structural changes, implying that the structure of the protein remains as α-helix even after binding to PIA.40
Molecular docking
Molecular docking is a method which predicts the preferred orientation of the small molecule into a macromolecule, generally a protein, when they are bound to each other to form a stable complex.41 As described above, the BSA structure has two tryptophan residues, with the Trp-134 residue being located near the protein surface, in subdomain IB, corresponding to the fatty acid site 1 in HSA, whereas the Trp-212 residue is located in subdomain IIA, corresponding to the fatty acid site 7 in HSA, or just site I, according with Sudlow’s classification.11,13 In order to suggest the potential ligand binding site in the BSA structure, as well as which BSA amino acids residues are interacting with the ligand, molecular docking studies were carried out.
Table 3 shows all the docking conformation scores for Trp-134 and Trp-212-containing binding site (ChemPLP function). Docking score average suggests that PIA interacts more favorably with BSA into the site containing the Trp-212 residue (docking score average 55.2) than in the site containing the Trp-134 residue (docking score average 39.5). Since a t-test is any statistical hypothesis test in which the test statistic follows a Student’s t-distribution under the null hypothesis, it can be used to determine if two sets of data are significantly different from each other. In order to give a difference statistically significant for our theoretical results, we calculated a Student’s t-test: as the p-value (3.27 × 10⁻⁵) is less than 0.05 (95% confidence interval), we reject the null hypothesis, therefore there is a statistically significant difference between the two protein binding sites. Generally, ligands that interact preferentially with the first site are dicarboxylic acids and/or
bulky heterocyclic molecules with a negative charge or containing azo and/or sulfur groups (e.g. phenylbutazone, azapropazone, tolbutamide, bucolome and sulfisoxazole), whose structural characteristics are similar to those in the PIA structure.30,42
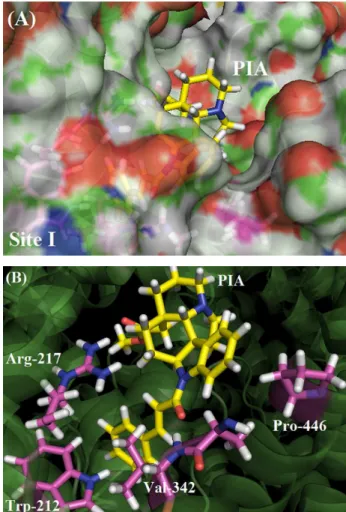
Figure 7A represents the molecular surface of BSA for the PIA pose with the best docking score. This figure shows that the major part of the PIA structure is accommodated inside the protein binding site, which could be related to the high binding constants values obtained in the fluorescence quenching experiments. Figure 7B shows the amino acid residues closest to the ligand in Trp-212-containing binding site. The entropycally driven thermodynamic results indicate hydrophobic interactions as the main binding forces between BSA:PIA. Accordingly, as can be seen in Figure 7B, molecular docking results suggest that the Trp-212 residue interacts via t-stacking with the aromatic ring of ligand’s 3-phenylprop-2-enoyl group with a distance of 2.30 Å, and the non-polar residues Val-342 and Pro-446 interact with the other aromatic ring of the PIA structure with a distance of 1.50 Å, for both amino acids residues. Besides these interactions, hydrogen bonds are predicted by the docking procedure to also play a role in the BSA:PIA complex: there is one hydrogen bond between the Arg-217 guanidinium group and the carbonyl oxygen of the PIA ester group, with a distance of 2.00 Å, and another one between the peptidic NH hydrogen of the Val-342 residue and the amide oxygen in the PIA structure.
Conclusions
Energy transfer from BSA to PIA occurs with high probability and fluorescence quenching of BSA by PIA is via a static quenching mechanism. The binding constant
indicates that PIA is strongly bound to SA and from the CD measurements, this binding does not perturb significantly the secondary structure of the protein. The thermodynamic results show that the binding is spontaneous, entropically driven and endothermic. Evaluation of the number of binding sites indicate the existence of just one main binding site for the BSA:PIA association and molecular docking results suggest site I, where Trp-212 residue can be found, as the main binding site. The experimental data indicate hydrophobic interactions as the main binding forces for BSA:PIA and molecular docking results suggest that Trp-212 and Pro-446 residues interacts via hydrophobic interaction with aromatic rings of the ligand. There are also hydrogen bonds between PIA and Arg-217 and Val-342 residues.
Acknowledgments
The authors gratefully acknowledge Prof Nancy Camara de Lucas Garden (UFRJ, Brazil) for the use of
Figure 7. (A) Molecular surface of BSA Trp-212-containing binding site, corresponding to PIA’s highest docking score pose (ChemPLP function); (B) best docking pose for BSA:PIA interaction. BSA structure in cartoon representation; ligand and selected residues in stick representation. Table 3. Docking poses scores for Trp-134 and Trp-212-containing
binding sites (ChemPLP function)
Trp-134 containing binding site Trp-212 containing binding site
47.6 66.3
36.4 59.8
36.0 56.1
36.7 58.3
36.2 55.4
37.2 48.7
42.1 55.7
35.8 43.3
53.3 49.8
33.4 58.7
time-resolved fluorescence facilities. This research was supported by the Brazilian agencies: CAPES (Coordenação de Aperfeiçoamento de Pessoal de Nível Superior), CNPq (Conselho Nacional de Desenvolvimento Científico e Tecnológico) and FAPERJ (Fundação de Amparo à Pesquisa do Estado do Rio de Janeiro).
References
1. Guimarães, H. A.; Braz-Filho, R.; Vieira, I. J. C.; Molecules
2012, 17, 3025.
2. Pereira, M. M.; Jácome, R. L. R. P.; Alcântara, A. F. C.; Alves, R. B.; Raslan, D. S.; Quim. Nova 2007, 30, 970.
3. Almagro, L.; Fernández-Pérez, F.; Pedreño, M. A.; Molecules
2015, 20, 2973.
4. Angenot, L.; Dubois, M.; Ginion, C.; van Dorsser, W.; Dresse, A.; Arch. Int. Pharmacodyn. Ther. 1975, 215, 246.
5. Quiqnard, E. L. J.; Acta Amazonica 2003, 33, 93.
6. Oliveira, V. B.; Freitas, M. S. M.; Mathias, L.; Braz-Filho, R.; Vieira, I. J. C.; Rev. Bras. Plantas Med. 2009, 11, 92.
7. Guimarães, H. A.; Vieira, I. J. C.; Braz-Filho, R.; Crotti, A. E. M.; Almeida, V. S.; de Paula, R. C.; Helv. Chim. Acta 2013, 96,
1793.
8. Majoreka, K. A.; Porebski, P. J.; Dayal, A.; Zimmerman, M. D.; Jablonska, K.; Stewart, A. J.; Chruszcz, M.; Minor, W.; Mol. Immunol. 2012, 52, 174.
9. Michnik, A.; Michalik, K.; Kluczewska, A.; Drzazga, Z.; J. Therm. Anal. Calorim. 2006, 84, 113.
10. Bhattacharya, B.; Nakka, S.; Guruprasad, L.; Samanta, A.; J. Phys. Chem. B 2009, 113, 2143.
11. Chaves, O. A.; Jesus, C. S. H.; Cruz, P. F.; Sant’Anna, C. M. R.; Brito, R. M. M.; Serpa, C.; Spectrochim. Acta, Part A 2016, 169, 175.
12. Hirayama, K.; Biochem. Biophys. Res. Commun.1990, 173,
639.
13. Bujacz, A.; Acta Crystallogr., Sect. D: Struct. Biol. 2012, D68,
1278.
14. Stewart, J. J. P.; J. Mol. Model. 2007, 13, 1173.
15. Hehre, W. J.; A Guide to Molecular Mechanics and Quantum Chemical Calculations; Wavefunction, Inc.: Irvine, USA, 2003.
16. http://www.ccdc.cam.ac.uk/solutions/csd-discovery/ components/gold/, accessed in October 2016.
17. Korb, O.; Stützle, T.; Exner, T. E.; J. Chem. Inf. Model. 2009,
49, 84.
18. DeLano, W. L.; PyMOL User’s Guide; DeLano Scientific LLC, USA, 2002.
19. Samari, F.; Hemmateenejad, B.; Shamsipur, M.; Rashidi, M.; Samouei, H.; Inorg. Chem. 2012, 51, 3454.
20. Topala, T.; Bodoki, A.; Oprean, L.; Oprean, R.; Clujul Med.
2014, 87, 215.
21. Lakowicz, J. R.; Principles of Fluorescence Spectroscopy, 1st ed.; Springer: New York, USA, 2006.
22. Chaves, O. A.; Amorim, A. P. O.; Castro, L. H. E.; Sant’Anna, C. M. R.; de Oliveira, M. C. C.; Cesarin-Sobrinho, D.; Netto-Ferreira, J. C.; Netto-Ferreira, A. B. B.; Molecules 2015, 20, 19526. 23. Brune, D.; Kim, S.; Biophysics 1993, 90, 3835.
24. Barros, L. S.; Chaves, O. A.; Schaeffer, E.; Sant’Anna, C. M. R.; Ferreira, A. B. B.; Cesarin-Sobrinho, D.; Silva, F. A.; Netto-Ferreira, J. C.; J. Fluorine Chem. 2016, 190, 81.
25. Mandal, G.; Bardhan, M.; Ganguly, T.; Colloids Surf., B 2010, 81, 178.
26. Liu, X.; Shang, Y.; Ren, X.; Li, H.; J. Chem. 2013, 2013, 1.
27. Varlan, A.; Hillebrand, M.; Molecules 2010, 15, 3905. 28. Shena, G.-F.; Liua, T.-T.; Wanga, Q.; Jianga, M.; Shi, J.-H.; J.
Photochem. Photobiol., B 2015, 153, 380.
29. Wang, N.; Ye, L.; Zhao, B. Q.; Yu, J. X.; Braz. J. Med. Biol. Res. 2008, 41, 589.
30. Chaves, O. A.; Soares, B. A.; Maciel, M. A. M.; Sant’Anna, C. M. R.; Netto-Ferreira, J. C.; Cesarin-Sobrinho, D.; Ferreira, A. B. B.; J. Braz. Chem. Soc. 2016, 27, 1858.
31. Yu, X.; Liu, R.; Yang, F.; Ji, D.; Li, X.; Chen, J.; Huang, H.; Yi, P.; J. Mol. Struct. 2011, 985, 407.
32. Suryawanshi, V. D.; Walekar, L. S.; Gore, A. H.; Anbhule, P. V.; Kolekar G. B.; J. Pharm. Anal. 2014, 6, 56.
33. Ross, P. D.; Subramanian, S.; Biochemistry 1981, 20, 3096. 34. Shena, G.-F.; Liua, T.-T.; Wanga, Q.; Jianga, M.; Shi, J.-H.; J.
Photochem. Photobiol., B 2015, 153, 380.
35. Zhang, X.; Li, L.; Xu, Z.; Liang, Z.; Su, J.; Huang, J.; Li, B.;
PLoS One 2013, 8, 1.
36. Hu, Y. J.; Liu, Y.; Zhao, R. M.; Dong, J. X.; Qu, S. S.; J. Photochem. Photobiol., A 2006, 179, 324.
37. Sarkar, M.; Paul, S. S.; Mukherjea, K. K.; J. Lumin. 2013, 142,
220.
38. Chatterjee, T.; Pal, A.; Dey, S.; Chatterjee, B. K.; Chakrabarti, P.; PLoS One 2012, 7, 1.
39. Wang, Y. P.; Wei, Y.; Dong, C.; J. Photochem. Photobiol., A
2006, 177, 6.
40. Zhang, G.; Ma, Y.; Wang, L.; Zhang, Y.; Zhou, J.; Food Chem.
2012, 133, 264.
41. Satheshkumar, A.; Elango, K. P.; Spectrochim. Acta, Part A
2014, 130, 337.
42. Yamasaki, K.; Chuang, V. T. G.; Maruyama, T.; Otagiri, M.;
Biochim. Biophys. Acta 2013, 1830, 5435.
Submitted: July 13, 2016
![Figure 1. Chemical structure for N 1 -cinnamoyl-12-demethoxycylindrocarine (methyl (2β,12β,19α)-1-[(2E)-3-phenylprop-2-enoyl]aspidospermidin-21-oate) (PIA).](https://thumb-eu.123doks.com/thumbv2/123dok_br/19000895.463712/2.892.144.336.110.291/figure-chemical-structure-cinnamoyl-demethoxycylindrocarine-methyl-phenylprop-aspidospermidin.webp)