www.nonlin-processes-geophys.net/18/635/2011/ doi:10.5194/npg-18-635-2011
© Author(s) 2011. CC Attribution 3.0 License.
in Geophysics
Synchronization and desynchronization in the
Olami-Feder-Christensen earthquake model and potential
implications for real seismicity
S. Hergarten1,2and R. Krenn1
1Institut f¨ur Erdwissenschaften, Karl-Franzens-Universit¨at Graz, Heinrichstraße 26, 8010 Graz, Austria
2Institut f¨ur Angewandte Geowissenschaften, Technische Universit¨at Graz, Rechbauerstraße 12, 8010 Graz, Austria
Received: 17 June 2011 – Revised: 21 September 2011 – Accepted: 22 September 2011 – Published: 27 September 2011
Abstract. The Olami-Feder-Christensen model is probably the most studied model in the context of self-organized crit-icality and reproduces several statistical properties of real earthquakes. We investigate and explain synchronization and desynchronization of earthquakes in this model in the non-conservative regime and its relevance for the power-law dis-tribution of the event sizes (Gutenberg-Richter law) and for temporal clustering of earthquakes. The power-law distri-bution emerges from synchronization, and its scaling expo-nent can be derived asτ =1.775 from the scaling proper-ties of the rupture areas’ perimeter. In contrast, the occur-rence of foreshocks and aftershocks according to Omori’s law is closely related to desynchronization. This mechanism of foreshock and aftershock generation differs strongly from the widespread idea of spontaneous triggering and gives an idea why some even large earthquakes are not preceded by any foreshocks in nature.
1 The Olami-Feder-Christensen model
The Olami-Feder-Christensen (OFC) model (Olami et al., 1992) is a two-dimensional coupled map lattice model based on the Burridge-Knopoff spring-block earthquake model (Burridge and Knopoff, 1967). The model has attracted much attention not only as a paradigm for nonconservative systems in the context of self-organized criticality (SOC) (Bak et al., 1987; Bak, 1996; Jensen, 1998). It was soon rec-ognized (Olami et al., 1992; Olami and Christensen, 1992) that it reproduces the most important statistical property of real earthquakes, the Gutenberg-Richter law (Gutenberg and
Correspondence to:S. Hergarten ([email protected])
Richter, 1954) (i.e., a power-law distribution of earthquake sizes) as well as the occurrence of large, more or less pe-riodic earthquakes, so-called asperity events. Later it was discovered by Hergarten and Neugebauer (2002) that the OFC model also reproduces another fundamental property of earthquakes, the occurrence of foreshocks and aftershocks according to Omori’s law (Omori, 1894; Utsu, 1961). In this context it was found that the foreshock and aftershock sequences of the model reproduce several further important statistical properties of real seismicity such as the increase of the number of foreshocks with the mainshock size and some kind of aftershock diffusion (Helmstetter et al., 2004).
Understanding how the OFC model generates earthquake sequences with apparently realistic statistical properties may finally help to understand the Gutenberg-Richter law, Omori’s law and the occurrence of asperity-like events in na-ture. An idea on the origin of the power-law distribution was published rather early by Middleton and Tang (1995). De-tailed studies on asperity events were recently published by Kawamura et al. (2010). In contrast, the occurrence of fore-shocks and afterfore-shocks in the OFC model still needs clarifi-cation.
The model itself refers to a square array ofL×Lblocks where each block is interconnected by springs with its four nearest neighbors and with a rigid driving plate moving at constant velocity. Each siteisupports a continuous variable
Fi≥0 representing a force or local stress. The forces are
initially set at random values, while the model itself is deter-ministic. The model is continuously driven by uniformly in-creasing all forces until any siteiachieves the threshold force
Fi=1. In this case, the siteibecomes unstable and topples
instantaneously into an equilibrium position (Fi=0) and
thereby transfers a fractionαof its forceFiwithα∈(0,0.25]
of these neighbor sites may achieve or exceed the threshold force (Fi≥1) and topple. This leads to an avalanche that
continues until all sites are stable again (Fi<1 for eachi).
Since the model is non-abelian, the relaxation rule must be applied in parallel to all sites that are simultaneously unsta-ble.
The transmission parameterαsettles the amount ofFithat
is dissipated during toppling since a fraction 4αofFiis
trans-ferred in total to the neighbors for sites in the bulk. Thus, total force is preserved during an event forα=0.25, while the model is nonconservative forα <0.25.
After a transient time, the system approaches an appar-ently critical state characterized by a power-law distribution of the event sizes. However, the emergence of criticality in the nonconservative regime has been debated from the very beginning (Olami et al., 1992; Grassberger, 1994; de Car-valho and Prado, 2000; Christensen et al., 2001; de CarCar-valho and Prado, 2001; Drossel, 2002; Miller and Boulter, 2002, 2003; Wissel and Drossel, 2006). In return, temporal corre-lations similar to those found in real seismicity (foreshocks, aftershocks, and asperity events) were only recognized in the nonconservative regime (Olami and Christensen, 1992; Her-garten, 2002; Helmstetter et al., 2004). We therefore focus on the nonconservative case in this study.
2 The basic mechanism of synchronization
Boundary conditions play a crucial role in the OFC model. It was soon recognized that the model does not display SOC-behavior under periodic boundary conditions (Socolar et al., 1993; Grassberger, 1994). The basic mechanism how sites synchronize from the boundaries to form larger events was first investigated by Middleton and Tang (1995). Without any boundary effects, all sites might topple periodically at a period 1−4α independently of each other. The period re-sults from the fact that each time a site topples it drops one unit of force and receives a force α from each of its four neighbors. However, boundary sites receive less force from their neighbors, resulting in a lower toppling frequency. If one of the neighbors of a siteidoes not topple within a time span 1−4α, the siteicannot topple and must wait until the delayed site j topples and delivers its contribution α. At this point, siteibecomes immediately unstable, i.e., it syn-chronizes with the sitej. Middleton and Tang developed a simplified model involving the phases of toppling instead of the forces and numerically found power-law distributed event sizes.
Apart from its directed structure (as only synchroniza-tion in direcsynchroniza-tion of two of the four neighbors is consid-ered), the approach of Middleton and Tang differs from the OFC model by neglecting “supercritical” forcesFi>1. In
the OFC model, only hypocenters always topple exactly at
Fi=1, while all other sites involved in an event may topple
atFi>1.
100 102 104 106 108
100 101 102 103 104
number of events
event size
OFC model
t = 4-16
t = 0-1
t = 1-4
Fig. 1. Event-size statistics of the modified OFC model
with-out supercritical forces measured over different time intervals on a 4096×4096 grid withα=0.2 and random initial values. The orange line refers to 2×10⁹events in the quasi-steady state of the original OFC model. The dashed lines correspond to a power-law distribution with a scaling exponentτ=1.775 that is discussed in Sect. 3.
In order to demonstrate the importance of these supercrit-ical forces for the OFC model we investigate a modified ver-sion where supercritical forces are neglected, i.e., where each unstable site only transfers an amountαof force to its neigh-bors even ifFi>1. The rest is simply lost. We simulated this model withα=0.2 on a 4096×4096 lattice with random initial conditions and found that it synchronizes from the boundaries as expected. Figure 1 shows the event-size statis-tics for different time intervals. In the time intervalt∈ [1,4], the event-size distribution follows a power law for event sizes from about 100 to 1000. The statistics of the smaller events are governed by the still unsynchronized events in the bulk. The scaling exponent of the power law matches that found for the original OFC model within the accuracy of the data. We verified that these results hold at least forα∈ [0.16,0.24]. However, as synchronization proceeds towards the interior of the domain, larger events dominate, so that the power law distribution is soon lost. This happens long before synchro-nization reaches the middle of the domain. Forα=0.2, the transition occurs when the synchronized region has a width of less than 100 sites. Thus, criticality is only a transient phenomenon in the model without supercritical forces; it evolves rapidly towards a supercritical state. Therefore, self-organized criticality in the OFC model must be closely re-lated to the occurrence of supercritical forcesFi>1, which
3 The scaling exponent of the event-size distribution
We now derive a semi-phenomenological approach to ex-plain the power-law distribution arising from synchroniza-tion. The idea is in its spirit identical to the hierarchical clus-tering approach recently suggested by Hergarten and Krenn (2011) to explain the dynamics of the Drossel-Schwabl forest-fire model (Drossel and Schwabl, 1992).
A cluster is here defined in the same way as in site percola-tion where two sites belong to the same cluster if there exists a continuous path of nearest neighbor sites connecting them. Following the ideas of the previous section, we assume that a cluster of synchronized sites persists until it is randomly captured via its hypocenter by another cluster which has ex-perienced a delay in toppling. Let N (s)be the number of clusters of sizes on a lattice of total size A=L2. If an-other given cluster topples with a sufficient delay, it captures our cluster in case the hypocenter of our cluster is located on the accessible perimeterpa of the delayed cluster. The
accessible perimeter of a cluster consists of those perimeter sites which can be reached, in principle, by a random walker coming from infinity (Grossman and Aharony, 1986), and it was recently used in a modified forest-fire model to mimic ignition by human impact (Krenn and Hergarten, 2009).
Assuming a random alignment of all clusters, our site is captured by the delayed cluster with a probability pa
A.
Cap-ture of clusters can then in principle be described by Smolu-chowski’s coagulation equation with a suitable kernel. Al-though capture is in principle possible among clusters of any sizes, its effect on the cluster size is largest if both clusters are of similar sizes. We therefore only consider the case that one size is not larger than twice the other size, i.e., that two clusters with sizes in the interval[12
√
2s,√2s]turn into one cluster with a size between √2s and 2√2s. As the num-ber of clusters in this interval is approximately
q
1 2sN (s),
the number of pairs is 12 q
1 2sN (s)
2
, so that the number of capture events (caused by delay of one cluster) is roughly
1 2
q
1 2sN (s)
2 p
a(s) A
. Thus, the number of clusters in the interval[12
√
2s,√2s]changes by r
1
2sδN (s)= 1 2 r 1 2 s 2N s 2 !2 pa(s2)
A
−21 2
r 1 2sN (s)
!2 pa(s)
A , (1)
where the factor 2 in the second line states that two clusters vanish in a single capture event. In equilibrium, which can only be achieved if a sufficient number of clusters of size one is supplied,δN (s)must vanish. This leads to
1 2pa s 2 s 2N s 2 2
=pa(s)(sN (s))2, (2)
100 101 102 103 104
100 101 102 103 104 105 106
pa
(s)
s
α = 0.16 α = 0.18 α = 0.20 α = 0.22 α = 0.24
4.2 s0.55
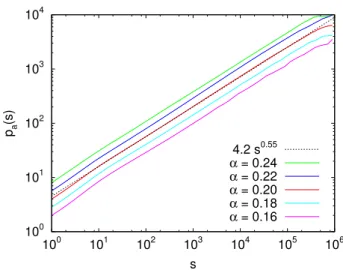
Fig. 2.Scaling behavior of the accessible perimeter of events in the
OFC model numerically determined for different values ofαon a 1024×1024 lattice. The curves referring toα6=0.20 were shifted vertically for clarity.
so that
N (s)∼s−32pa(s)− 1
2. (3)
Figure 2 shows the accessible perimeter of clusters in the OFC model derived from numerical simulations on a 1024× 1024 lattice. The results suggest thatpa(s)scales like
pa(s)∼sh (4)
withh=0.55 independently ofαat least for 0.16≤α≤0.24. This immediately leads to
N (s)∼s−τ (5)
with a scaling exponentτ=1.775 in perfect agreement with the numerical results presented in Fig. 1.
4 Desynchronization by supercritical forces
We now extend the idea of stress concentration proposed by Kawamura et al. (2010). They observed that the forces of the toppling sites approach one during a sequence of asperity events and provided a first explanation of this phenomenon.
Let us first come back to the basic mechanism of syn-chronization. Due to a delay in the toppling of a sitej, the (neighbored) sitei cannot topple before j topples, so that they topple simultaneously. Then, the siteitopples at a force
Fi=1+τ instead ofFi=1 whereτis the delay the sitei
10-6 10-5 10-4 10-3 10-2 10-1
0 1 2 3 4 5
S(t)
t
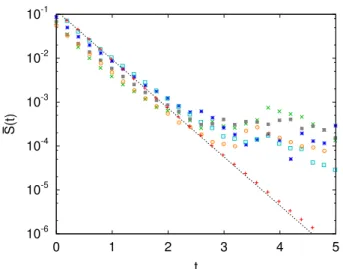
Fig. 3. Decay of the mean supercritical force excessS in six
se-quences of asperity events forα=0.2. The dashed line corresponds to the theoretical decay according toS(t )∼exp(−2.55t ).
of sitej, so that it will not topple simultaneously withj, but delayed byτ′=ατ. So the synchronization of the two sites is immediately lost, but they will topple with a short time lag in future. Asτ≤αin most cases,τ′≤α2, which means that the time lag will be shorter for smallα. As a consequence of the small time lag, even a small delay in the toppling of site
j will be sufficient to resynchronize the sites temporarily. In principle, the same mechanism applies to larger events, although they are not broken immediately. Let us consider an event wherehis the hypocenter,Eis the set of all involved sites,sis the size,N (i)is the neighborhood of the sitei, and
Fi is the (supercritical) force of siteiwhen it topples. The
hypocenter will topple next time after a time span
T=1−α X
j∈N (h)
Fj. (6)
Including the contributions from its neighbors, each sitei∈ Ewill have a force
Fi′=T+α X j∈N (i)
Fj, (7)
so that the supercritical force excessSi=Fi−1 of the sitei
turns into
Si′=α X j∈N (i)
Sj− X
j∈N (h) Sj
!
. (8)
As long asSi′≥0 for alli∈E, the event will take place (at least) at the same size. If this happens several times, a perfect sequence of asperity events arises. In return, ifSi′<0 for any site, the event will cease at sitei. This site becomes the hypocenter of a new event which takes place with a probably
small delay|Si′|. Thus, the event is broken into two or even more events.
The first sum in Eq. (8) describes a diffusive decay of the valuesSi, while the second sum can be seen as an
inhomo-geneity that may cause negative values and thus desynchro-nization. The decay of the mean supercritical force excessS
can be estimated by assuming thatEis surrounded by events without any supercritical force (as it is the case for events of size one), i.e., thatSi=0 fori /∈E. In this case, Eq. (8)
yields
S′=α 1 s
X
i∈E X
j∈N (i) Sj−
X
j∈N (h) Sj
!
(9)
=α 1 s
X
i∈E niSi−
X
j∈N (h) Sj
!
(10)
whereniis the internal coordination number of the sitei, i. e.,
the number of its neighbors which belong toE. As clusters of sites toppling simultaneously are rather compact in the OFC model, almost all sites involved in a large event should have
ni=4, so that
S′≈α 4S− X j∈N (h)
Sj !
. (11)
If the force excess inN (h)is the same asS, too, we imme-diately obtain
S′≈α (4−nh)S. (12)
As the decay fromStoS′takes place within a time span of length 1−4α(strictly speaking, slightly shorter), the mean force excess of an event sequence decays exponentially ac-cording to
S(t )∼exp(−λt ) (13)
with
λ= −log((4−nh)α)
1−4α . (14)
Obviously, events where the hypocenter is a “nose” at the border of the event (nh=1) have the lowest decay constant,
so that they shall be most stable against decay, followed by those with hypocenters at a corner (nh=2). This result gives
an explanation for the recent finding that the vast majority of the asperity events hasnh=1, followed bynh=2
(Kawa-mura et al., 2010). In return, Eq. (8) immediately reveals that desynchronization is more likely at the borders where
ni<4. In particular, noses which are not hypocenters will
rapidly lose synchronization, leading to rather smooth bor-ders of asperity events.
0 0.2 0.4 0.6 0.8 1
10-18 10-16 10-14 10-12 10-10 10-8 10-6 10-4 10-2 100
P(
τ
)
τ/(1-4α)
α = 0.24
α = 0.2
α = 0.16
Fig. 4. Cumulative distributionP (τ )of the time spansτbetween
receiving the last portion of force from a neighbor before becoming unstable and time of instability. The black line shows the distribu-tion that would arise from completely uncorrelated events.
supercritical forces of large asperity events. Six sequences where the hypocenter persisted for at least 25 periods were selected. According to Eq. (14), the smallest decay constant should beλ=2.55 here. One of these 6 sequences obeys the exponential decay even down toS(t )≈10−6, while the ma-jority of sequences tends to larger supercritical forces when
S(t )≈10−3, presumably caused by the supply of supercrit-ical forces from other events in the neighborhood. In some cases, the decay is slightly slower than predicted by Eqs. (13) and (14). This occurs if the supercritical forces in the neigh-borhood of the hypocenter is lower than the mean supercriti-cal force of the whole event.
5 Temporal correlations
As discussed in the previous section, large events tend to be broken into sequences of smaller events with a small time lag. This obviously causes a strong short-term correlation of events. In Fig. 4, the time spanτ between receiving the last portion of force from a neighbor before becoming un-stable and time of instability is analyzed for all hypocen-ters. The distributions were derived from simulations on a 2048×2048 grid using an implementation where the forces are stored in 64 bit integer format with a numerical precision ofǫ=2−62≈2×10⁻¹⁹(Krenn and Hergarten, 2011).
If the events were completely uncorrelated, and each of the four neighbors topples once per time span 1−4α, the prob-ability should beP (τ )=1−1−τ4α
4
. The OFC model ap-parently approaches this distribution forα→0.25, while the correlations become stronger asα decreases. Forα=0.16 even valuesτ down to the numerical precision occur with significant frequency. This phenomenon is interesting for
0 1 2 3 4
t
1 100 s 10000
A
F
D
Fig. 5.A sequence of events computed on a 512×512 grid, starting
from a large event spanning 37 % of the grid. Only events over-lapping the rupture area of the initial event are plotted. Red bars: Events starting from the same hypocenter as the first one. Green bars: Events starting from hypocenters within the rupture area of the first event. Grey bars: Events starting from outside the rupture area of the first event. The upper plots are parts of the sequence around selected events where the time axis is nonlinearly stretched according totstretched=tredbar+2√3t−tredbar.
the behavior of the OFC model in the limit of infinite pre-cision (Drossel, 2002; Miller and Boulter, 2003), but has no meaning with respect to real earthquakes: The propagation of a large earthquake takes at least several seconds in nature, so that the minimum detectable valuesτ are much lower than the numerical precision used here (Helmstetter et al., 2004; Hergarten and Jansen, 2005).
Fig. 6.Top: State of desynchronization of the first event from Fig. 5 att=3. Individual events are marked with random colors. Bottom: Respective hypocenters (red points). The arrow marks the hypocen-ter of the initial event.
according to the usual definition. The conjecture that fore-shocks and afterfore-shocks arise from desynchronization of large earthquakes is somewhat opposite to the widespread idea of spontaneous triggering as it is, e.g., assumed in the epidemic type aftershock model (Ogata, 1988).
Figure 5 shows an example of a decaying asperity se-quence. The second (marked with an A) occurrence is al-ready accompanied by aftershocks, and their number and size increases in the following. Most notably, no foreshocks are observed at this stage. The 9th occurrence (marked with a F) is the first one where the initial event (red) is no longer the largest one, so that it will be no longer the mainshock, but a foreshock of a larger event. At event no. 20 (marked with a D), the asperity has been destroyed; almost the entire initial rupture area has been captured by an event with a hypocenter outside this area with a significant time lag.
Figure 6 shows how the initial event has been broken at
t=3 and the respective hypocenters. The hypocenters ac-cumulate at the border of the initial earthquake indicating that desynchronization preferably takes place there. This phenomenon was already explained above from Eqs. (8) and (10). Furthermore it immediately explains why aftershocks are preferred to foreshocks.
6 Omori’s law
In the following, we present a simple idea of fragmentation to explain the origin of Omori’s law based on desynchroniza-tion. Let us start with one event involving s0≫1 sites at
timet0. In the first step, this event falls into two pieces of
sizeqs0and(1−q)s0with a delayτ in time. For simplicity
we assume that the first one is still at timet0 (modulo the
period), so that the second takes place att0+τ. In the next
step, each event falls into two pieces according to the same mechanism, but with a smaller delay 12τ. This factor is mo-tivated by the exponential decay of the supercritical forces discussed above. If we repeat this procedure infinitely, we recognize thatqns0sites topple at a total delay smaller than
1 2
n
τ. Thus, the number of sites that topple with a delay smaller thantis
s(t )=s0q−log2
t−t0 τ =s0
t −t0
τ
−log2q
, (15)
so that the number of toppling sites per time is ˙
s(t )∼(t−t0)−(1+log2q). (16)
This power law decay does not describe the number of after-shocks per time directly like Omori’s law, but a mixture of number and event size. However, if we assume that all after-shocks obey the same size distribution (i.e., the Gutenberg-Richter law), it turns into Omori’s law with an exponent
p=(1+log2q) <1. If q approaches 1 (i.e., if
desynchro-nization is strongly confined to the border), p approaches 1. At this point it should be mentioned that it was already observed that the OFC model yieldsp <1 (Hergarten and Neugebauer, 2002; Helmstetter et al., 2004), while values
1991). Valuesp >1 were also observed in modified versions of the OFC model (Hainzl et al., 1999; Jagla, 2010).
It is noteworthy, too, that this mechanism of aftershock generation hinges on a stepwise desynchronization during a sequence of asperity events. Disturbances in the force trans-fer close to the hypocenters will affect the small time lags be-tween the aftershocks which may result in resynchronization and thus wipe out Omori’s law. This explains an observation made by Yamamoto et al. (2010) who found numerically that Omori’s law is destroyed even by a very small dynamic ran-domness in the force transfer, while the Gutenberg-Richter law and the occurrence of asperity events itself is more ro-bust.
7 Conclusions and potential implications for real seismicity
We found that the dynamics of the OFC model is governed by two competing mechanisms: Synchronization pushes the system towards a critical state and thus generates the Gutenberg-Richter law. In return, desynchronization pre-vents the system from becoming overcritical and generates foreshocks and aftershocks.
The theoretical concept proposed in Sect. 3 suggests that the scaling exponent of the event-size distribution is τ=
1.775, independently of the parameterα, as long as synchro-nization is sufficiently strong. However, the concept does not allow an estimate of the minimum value ofαthat is sufficient to maintain synchronization. Desynchronization may disturb the power-law distribution, so that our results suggest that any dependency ofτ onαis a spurious effect.
In contrast, a dependence on Richter’s b-value (which is closely related toτ) on the type of fault zones was recently found in real seismicity (Narteau et al., 2009). However, this result is not in contradiction to our findings since numerical simulations of the OFC model for different values ofαand different lattice sizes practically yield a variation inτ.
The mechanism of foreshock and aftershock generation by desynchronization differs in its spirit strongly from the widespread idea of spontaneous triggering of aftershocks. If foreshocks and aftershocks are the result of desynchroniza-tion, a “new” (i.e., just generated by synchronization) asper-ity event should occur without foreshocks and with only few aftershocks. As synchronization hinges on a delayed occur-rence, there should be an increased probability of a large event without foreshocks if the time since the last earth-quake is longer than the characteristic asperity recurrence time. Furthermore, the “productivity”, i.e., the number of aftershocks (and foreshocks) would mainly depend on the “age” of the asperity (beside the mainshock magnitude). This may be the reason for the large and apparently random vari-ability of the number of foreshocks and aftershocks found in nature.
Even more important, our approach also provides a sim-ple explanation of Omori’s law which is one of the most fundamental relationships in statistical seismology. Beyond this, the mechanism of desynchronization immediately ex-plains another phenomenon sometimes found in real earth-quake sequences: Foreshocks migrate towards the hypocen-ter of the mainshock (Kagan and Knopoff, 1978; von Seggern et al., 1981), and aftershocks diffuse from the hypocenter of the mainshock (Tajima and Kanamori, 1985; Marsan et al., 2000).
Although our results provide several arguments in fa-vor of desynchronization being responsible for foreshocks and aftershocks, it currently seems to be impossible to de-cide whether real foreshocks and aftershocks arise from this mechanism or not as there are still too many open questions concerning the nature of asperity events. One may argue that the OFC model is too simple and obviously contains unre-alistic simplifications such as a constant loading rate at all sites. Variations in the loading rate would weaken synchro-nization, but this would mainly cause a faster decay of the asperities and thus more foreshocks and aftershocks. This would even be reasonable since it was already found that the number of foreshocks and aftershocks in the OFC model is too low compared to nature (Helmstetter et al., 2004). In contrast, the arguments that our simple mechanism of frag-mentation only predicts Omori exponents p <1 and is not robust against random disturbances cannot be refuted so far, leading to the conclusion that this mechanism is probably not the only one responsible for aftershocks in real seismicity.
Acknowledgements. This work was funded by the Austrian Science Fund (FWF): P19733-N10.
Edited by: L. Telesca
Reviewed by: two anonymous referees
References
Bak, P.: How Nature Works – the Science of Self-Organized Crit-icality, Copernicus, Springer, Berlin, Heidelberg, New York, 1996.
Bak, P., Tang, C., and Wiesenfeld, K.: Self-organized criticality. An explanation of 1/f noise, Phys. Rev. Lett., 59, 381–384, 1987. Burridge, R. and Knopoff, L.: Model and theoretical seismicity,
Bull. Seismol. Soc. Am., 57, 341–371, 1967.
Christensen, K., Hamon, D., Jensen, H. J., and Lise, S.: Comment on “Self-organized criticality in the Olami-Feder-Christensen model, Phys. Rev. Lett., 87, 039 081, 2001.
de Carvalho, J. X. and Prado, C. P. C.: Self-organized criticality in the Olami-Feder-Christensen model, Phys. Rev. Lett., 84, 4006– 4009, 2000.
Drossel, B.: Complex scaling behavior in nonconserved self-organized critical systems, Phys. Rev. Lett., 89, 238701, doi: 10.1103/PhysRevLett.89.238701, 2002.
Drossel, B. and Schwabl, F.: Self-organized critical forest-fire model, Phys. Rev. Lett., 69, 1629–1632, 1992.
Grassberger, P.: Efficient large-scale simulations of a uniformly driven system, Phys. Rev. E, 49, 2436–2444, 1994.
Grossman, T. and Aharony, A.: Structure and perimeters of per-colation clusters, J. Phys. A: Math. Gen., 19, L745–L751, doi:10.1088/0305-4470/19/12/009, 1986.
Gutenberg, B. and Richter, C. F.: Seismicity of the Earth and Asso-ciated Phenomenon., Princeton University Press, Princeton, 2nd edn., 1954.
Hainzl, S., Z¨oller, G., and Kurths, J.: Similar power laws for foreshock and aftershock sequences in a spring-block model for earthquakes, J. Geophys. Res., 104, 7243–7253, 1999.
Helmstetter, A., Hergarten, S., and Sornette, D.: Properties of fore-shocks and afterfore-shocks of the nonconservative self-organized critical Olami-Feder-Christensen model, Phys. Rev. E, 70, 046120, doi:10.1103/PhysRevE.70.046120, 2004.
Hergarten, S.: Self-Organized Criticality in Earth Systems, Springer, Berlin, Heidelberg, New York, 2002.
Hergarten, S. and Jansen, F.: On the separation of timescales in spring-block earthquake models, Nonlin. Processes Geophys., 12, 83–88, doi:10.5194/npg-12-83-2005, 2005.
Hergarten, S. and Krenn, R.: A semi-phenomenological approach to explain the event-size distribution of the Drossel-Schwabl forest-fire model, Nonlin., Processes Geophys., 18, 381–388, doi:10. 5194/npg-18-381-2011, 2011.
Hergarten, S. and Neugebauer, H. J.: Foreshocks and aftershocks in the Olami-Feder-Christensen model, Phys. Rev. Lett., 88, 238501, 2002.
Jagla, E. A.: Realistic spatial and temporal earthquake distributions in a modified Olami-Feder-Christensen model, Phys. Rev. E, 81, 046117, doi:10.1103/PhysRevE.81.046117, 2010.
Jensen, H. J.: Self-Organized Criticality – Emergent Complex Be-haviour in Physical and Biological Systems, Cambridge Univer-sity Press, Cambridge, New York, Melbourne, 1998.
Kagan, Y. Y. and Knopoff, L.: Statistical study of the occurrence of shallow earthquakes, Geophys. J. R. Astron. Soc., 55, 67–86, 1978.
Kawamura, H., Yamamoto, T., Kotani, T., and Yoshino, H.: As-perity characteristics of the Olami-Feder-Christensen model of earthquakes, Phys. Rev. E, 81, 031 119, doi:10.1103/PhysRevE. 81.031119, 2010.
Kisslinger, C. and Jones, L. M.: Properties of aftershock sequences in southern California, J. Geophys. Res., 96, 11947–11958, 1991.
Krenn, R. and Hergarten, S.: Cellular automaton modelling of lightning-induced and man made forest fires, Nat. Hazards Earth Syst. Sci., 9, 1743–1748, doi:10.5194/nhess-9-1743-2009, 2009.
Krenn, R. and Hergarten, S.: An efficient integer algorithm for the Olami-Feder-Christensen model, In preparation, 2011.
Marsan, D., Bean, C. J., Steacy, S., and McCloskey, J.: Observa-tion of diffusion processes in earthquake populaObserva-tions, and impli-cations for the predictability of seismicity systems, J. Geophys. Res., 105, 28081–28094, 2000.
Middleton, A. A. and Tang, C.: Self-organized criticality in non-conserved systems, Phys. Rev. Lett., 74, 742–745, 1995. Miller, G. and Boulter, C. J.: Measurements of criticality in
the Olami-Feder-Christensen model, Phys. Rev. E, 66, 016123, doi:10.1103/PhysRevE.66.016123, 2002.
Miller, G. and Boulter, C. J.: Crossover behavior in the event size distribution of the Olami-Feder-Christensen model, Phys. Rev. E, 67, 046 114, doi:10.1103/PhysRevE.67.046114, 2003. Narteau, C., Byrdina, S., Shebalin, P., and Schorlemmer,
D.: Common dependence on stress for the two fundamen-tal laws of statistical seismology, Nature, 462, 642–645, doi:10.1038/nature08553, 2009.
Ogata, Y.: Statistical models for earthquake occurrences and resid-ual analysis for point processes, J. Am. Stat. Assoc., 83, 9–27, 1988.
Olami, Z. and Christensen, K.: Temporal correlations, universality, and multifractality in a spring-block model of earthquakes, Phys. Rev. A, 46, R1720–R1723, 1992.
Olami, Z., Feder, H. J. S., and Christensen, K.: Self-organized criti-cality in a continuous, nonconservative cellular automation mod-eling earthquakes, Phys. Rev. Lett., 68, 1244–1247, 1992. Omori, F.: On the aftershocks of earthquakes, J. Coll. Sci. Imp.
Univ. Tokyo, 7, 111–200, 1894.
Socolar, J. E. S., Grinstein, G., and Jayaprakash, C.: On self-organized criticality in nonconserving systems, Phys. Rev. E, 47, 2366–2376, doi:10.1103/PhysRevE.47.2366, 1993.
Tajima, F. and Kanamori, H.: Global survey of aftershock area ex-pansion patterns, Phys. Earth Planet. Inter., 40, 77–134, 1985. Utsu, T.: A statistical study on the occurrence of aftershocks,
Geo-phys. Mag., 30, 521–605, 1961.
von Seggern, D., Alexander, S. S., and Baag, C.-E.: Seismicity pa-rameters preciding moderate to major earthquakes, J. Geophys. Res., 86, 9325–9351, doi:10.1029/JB086iB10p09325, 1981. Wissel, F. and Drossel, B.: Transient and stationary behavior of
the Olami-Feder-Christensen model, Phys. Rev. E, 74, 066109, doi:10.1103/PhysRevE.74.066109, 2006.