1
Universidade Federal de Santa Catarina, Centro de Ciências da Saúde, Programa de Pós-Graduação em Nutrição. R. Professor Elpidio Barbosa, 320, Complemento 3, Trindade, 88036-300, Florianópolis, SC, Brasil. Correspondência para/Correspondence to: J PESSINI. E-mail: <[email protected]>.
2
Universidade Federal de Santa Catarina. Centro de Desportos. Programa de Pós-Graduação em Educação Física. Florianópolis, SC, Brasil.
3
Universidade Federal de Minas Gerais. Escola de Enfermagem. Departamento de nutrição. Belo Horizonte, MG, Brasil. Suport: Conselho Nacional de Desenvolvimento Científico e Tecnológico (Call nº 14/2012 - Process nº 475.075/2012) and Fundação de Apoio à Pesquisa Científica e Tecnológica do Estado de Santa Catarina (FAPESC/PPSUS/N.2014TR2263. Public call nº 07/2013).
Cross-cultural equivalence and
psychometric proprieties of the
social support scale for healthy
eating habits
Avaliação da equivalência transcultural
e de propriedades psicométricas da
escala de apoio social para hábitos
alimentares saudáveis
Júlia PESSINI1
Aline Mendes GERAGE2 Simone Teresinha MEURER2 Aline Rodrigues BARBOSA2 Aline Cristine Souza LOPES3 Tânia Rosane Bertoldo BENEDETTI2
A B S T R A C T
Objective
To assess the cross-cultural equivalence and psychometric proprieties of the Brazilian version of the Eating Habits Social Support Scale.
Methods
factor validity (factor analysis), internal consistency (Cronbach’s alpha), and reproducibility (intraclass correlation coefficient), using a test-retest with an interval of seven days.
Results
Factor analysis identified two factors for each social support group (friends and family). The questions were clustered by type of social support (positive or negative comments). The eigenvalues for family social support were 3.22 and 3.00, corresponding to 62.2% of the total variance. For friend social support, the eigenvalues were 3.02 and 2.95, explaining 59.7% of the total variance. In the internal consistency analysis, the alpha values ranged from 0.83 to 0.75. The reproducibility intraclass correlation coefficient ranged from 0.676 to 0.873. All these values were acceptable, indicating the validity and reliability of the scale.
Conclusion
The Brazilian version of the Eating Habits Social Support Scale presented cross-cultural equivalence and psychometric characteristics that were appropriate for Brazilian adults and older adults. This scale is easy to use and obtained high scores for question clarity and answer options.
Keywords: Food habits. Social support. Validity of tests.
R E S U M O
Objetivo
Avaliar a equivalência transcultural e as propriedades psicométricas da versão brasileira da Escala de Apoio Social para Hábitos Alimentares Saudáveis.
Métodos
A escala foi aplicada em 381 indivíduos com idade entre 24 e 86 anos, residentes em Recife e Belo Horizonte, Brasil. A equivalência transcultural foi avaliada por consenso de especialistas. As propriedades psicométricas foram analisadas pela validade fatorial (análise fatorial exploratória), consistência interna (alfa de Cronbach) e reprodutibilidade (Coeficiente de Correlação Intraclasse). Para análise de reprodutibilidade, foi utilizado o teste-reteste com intervalo de até sete dias entre as aplicações.
Resultados
A análise fatorial identificou dois fatores para cada fonte de apoio social (amigos e família). O agrupamento das questões ocorreu de acordo com o tipo de apoio recebido (comentários positivos ou negativos). Os autova-lores dos fatores de apoio social da família foram 3,22 e 3,00, correspondentes a 62,2% da variância. Para o apoio social dos amigos, os autovalores foram 3,02 e 2,95, explicando 59,7% da variância. Na avaliação de consistência interna, os valores de alfa variaram de 0,83 a 0,75. A reprodutibilidade resultou em valores de coeficiente de correlação intraclasse de 0,676 a 0,873. Todos os valores foram aceitáveis, indicando validade e confiabilidade do instrumento.
Conclusão
A versão brasileira da Escala de Apoio Social para Hábitos Alimentares Saudáveis apresentou equivalência transcultural e propriedades psicométricas adequadas para aplicação em adultos e idosos. É um instrumento de fácil aplicação e bem avaliado em relação à clareza das questões e opções de resposta.
Palavras-chave: Hábitos alimentares. Apoio social. Validades dos testes.
I N T R O D U C T I O N
The increasing rates of obesity is a reality in Brazil1,2. Analysis of nutritional status variation
in Brazilian adults using data from the Estudo
Nacional de Despesa Familiar from 1974-1975
and from the Pesquisa de Orçamentos Familiares
from 2003-2004 and 2008-2009 showed that the
prevalence of excess weight increased from 18.5% in 1975-1975 to 50.1% in 2008-2009. In the same period, obesity quadrupled in men, going from 2.8% to 12.4%, and doubled in women, going from 8.0% to 16.9%2.
costs and for 72% of the deaths in Brazil in 20073.
Poor eating habits are among the main determinants of this nutritional and epidemiological condition3.
Recent studies found higher access of the population to ultra-processed foods with high energy density and fat, sodium, and sugar contents, and low nutrient contents4,5,6. Given this
scenario, encouraging the adoption of healthy food habits is one of the central issues of Brazilian health-promoting policies and actions7,8.
In this sense the most recent publication of the Brazilian Food Guide9 recommends that
the base of the Brazilian diet should consist of fresh and minimally processed foods, limiting the intake of processed and ultra-processed foods. The main guiding principle of the Guide is considering food intake an action that goes beyond nutrient intake, an action that is based on the cultural and social dimensions of communal eating practices. Thus, the Guide proposes actions that combine the requirements and potentialities of the personal and family spheres by contemplating these aspects and facilitating adherence to healthy eating habits9.
These aspects reinforce the need of understanding and studying factors that mediate adherence to a healthy diet. These factors aim to promote health, and prevent and control obesity. They help to create specific nutritional recommendations for the Brazilian population in order to promote adherence by individuals and communities. Social support is among the factors that mediate behavior changes in food practices because of its potential to help people to adopt healthy eating habits10,11,12.
Studies have investigated the role of social support on some health outcomes, such as general mortality13 and chronic diseases14,15.
Studies that assess the contribution of social support to improving eating habits and physical activity level to treat diabetes16 and obesity17 have
identified the importance of support in this process. Hence, support provided by the social network seems to have a positive impact on emotional wellbeing and health18,19. Nevertheless,
there is no consensus for the definition of social support20. Some authors21,22, describe it as a
system of formal and informal relationships through which individuals receive emotional, material, or informational help, which may have positive emotional and/or behavioral effects.
Despite the influence of social support on health20 and on diet-related behavioral changes,
there is no literature consensus on how to assess it11,12. Support sources and perspectives vary, and
the dimensions can involve emotional (care, appreciation), instrumental (practical, concrete care), informational (advice), and cognitive (encouragement, reinforcement given by someone) support, hindering its assessment22,23.
Sallis et al.24 developed a social support
scale in english for changing eating habits. Nonetheless, the scale has not been validated in other languages, despite its ease of use. Until now, only one Brazilian study has tested the psychometric properties of a social support scale for behavioral changes related to food habits25.
Yet, this instrument is specific for the intake of fruits and vegetables, and was tested only in university students25.
Considering the importance of assessing social support for the effectiveness of actions that promote appropriate and healthy diets, and the lack of such instruments in Brazil, the present study aimed to assess the transcultural equivalence and the psychometric properties of the Brazilian version of the social support scale for healthy eating habits. This scale was initially proposed by Sallis et al.24 for adults and older
adults.
M E T H O D S
present study analyzed only baseline assessment data.
In Belo Horizonte the participants were
users of two units of the ProgramaAcademia da Saúde aged 20 years or more. In Recife the study participants were hypertensive individuals aged more than 40 years26. These individuals were
recruited during socializations and by advertising the study in the local media, distributing pamphlets, and placing posters near the intervention locations.
A total of 381 individuals participated in the study, 76.4% from Belo Horizonte and 23.6% from Recife. In both cities data were collected by interviewers who received training to administer, fill out, and code the questionnaire. The transcultural equivalence of the instrument was assessed as recommended by Vijver & Hambleton27 and
Reichenheim & Moraes28.
The first stage consisted of having the scale translated into Brazilian Portuguese by a native Brazilian Portuguese speaker with a bachelor of arts in letters and specialization in English language teaching. Next, the scale was back-translated by a native American English speaker who lives in Brazil. The English versions were compared, and the semantic discrepancies were adjusted.
After the adjustments, the first version of the Brazilian Portuguese scale was submitted to two experts, doctors in the areas of nutrition and physical education, and knowledgeable in psychometric instrument validation, for assessment and consensus on the instrument’s theoretical construction and format.
The second version of the scale was administered to a group of 10 people whose characteristics were similar to those of the study sample. The objective was to assess the understanding of the questions, instrument clarity, and answer options. The group was asked to answer the entire questionnaire and assess the clarity of each question and the respective answer options. The participants were instructed to use
scores ranging from 0 (zero) to 10 (ten), where 0 meant the item was “not clear at all” and 10 meant the item was “completely clear”.
Psychometric analysis: validity and reliability
Social support scale for healthy eating habits was administered by interview and included the 10 original items proposed by Sallis et al.24.
Its structure consisted of two blocks with 10 items each, and each block assessed a social support source: family and friends. To facilitate understanding and standardize the directions, the respondents were instructed to consider family the “people they lived with,” and friends the people they considered “friends, workmates, and acquaintances”.
For each block, the participants classified the frequency with which family members and friends had done or said something described in the scale in the last three months. Items 1 to 5 were inserted in the block of encouragement for eating habit changes, herein denominated “positive comments.” Items 6 to 10 were allocated to the block of discouragement for changes, herein denominated “negative comments”.
The scale has six answer options: 1) none; 2) rarely; 3) a few times; 4) often; 5) very often; and 8) does not apply. The answer “does not apply” received a score of one, and the social support scores were determined by adding the answers of each block, which could vary from 1 to 25 points. The test-retest method assessed instrument reliability. In all, 18 participants answered the questionnaire twice, with an interval of three to seven days between the first and second administration of the scale.
and Body Mass Index (BMI) was calculated by dividing body mass by the square of the height. The cut-off points proposed by the World Health Organization were used for classifying individuals as normal weight, overweight, and obese based on their body mass index30. The study protocol
was approved by the Human Research Ethics Committee of the Universidade Federal de Santa Catarina (Federal University of Santa Catarina) that proposed the studies under Protocol nº 711,420 and by the State Department of Health under Protocol nº 767,704.
The general characteristics of the participants were presented by descriptive measures. The characteristics of the samples used for assessing transcultural equivalence and psychometric properties were compared by the chi-square test for a single group or Fisher’s exact test (categorical variables) and Student’s t-test for paired samples (continuous variables).
Psychometric property analysis considered scale structure and reliability. Exploratory factor analysis assessed scale structure. Principal component analysis (factors) was done using the Promax rotation. The factors were determined according to Kaiser’s criteria, which suggest using factors with eigenvalues ≥1.00. Factor loadings >0.5 were accepted31.
Sample adequacy to the procedure was verified by the Kaiser-Meyer-Olkin (KMO) test, performed separately for each variable and also globally, considering the set of all the scale questions. The results of the KMO test varied from 0 to 1. Sample adequacy improved as the result approached 1. Values >0.6 indicated sample adequacy for factor analysis32.
The internal consistency and reproducibility of the data were assessed to verify EASHAS reliability. Cronbach’s alpha assessed the internal consistency of the instrument; alpha values ≥0.70 were considered appropriate33. Reproducibility
was analyzed by Intraclass Correlation Coefficient (ICC) of the test-retest results. Intraclass Correlation
Coefficient values ≥0.70 were considered appropriate33. All analyses were performed by the
software Stata® (Stata Corporation, College
Station, Texas, United States) version13.0.
R E S U L T S
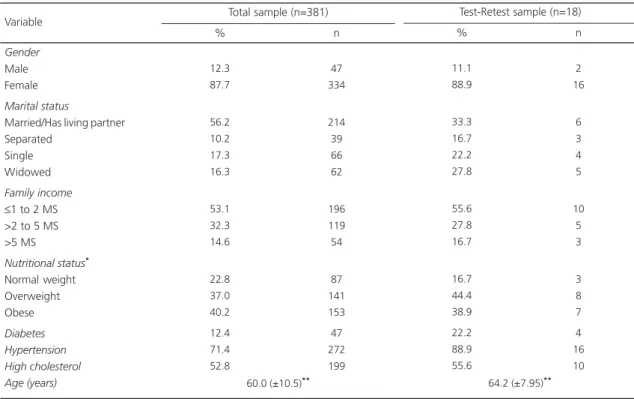
Table 1 shows the participants’
sociodemographic characteristics and health conditions. The sample consisted of 381 individuals aged 24 to 86 years. Most participants were female, married, overweight or obese, with hypertension, and high cholesterol, and had family income of 1 to 3 minimum salaries.
Social support scale for healthy eating habits clarity was assessed by individuals with similar characteristics of those of the sample. They found that all questions and respective answer options were clear. In a scale from 0 to 10 points (0=not clear at all; 10=completely clear), the mean clarity of the questions was 9.7, and the mean clarity of the answers was 8.8. Because of these results, no adjustments were necessary.
Exploratory factor analysis of the family social support for healthy eating habits (Table 2) generated two factors (subscales) with eigenvalues greater than 1.0, corresponding to 62.2% of the total variance. Factor analysis of the friend social support for healthy eating habits (Table 3) also resulted in two factors (subscales) with eigenvalues greater than 1.0, corresponding to 59.7% of the total variance. Social support scale for healthy eating habits question 4, regarding friend social support, had the smallest factor loading. Most factor loadings (60.0%) exceeded 0.70, and only one item had a factor loading below 0.60. The values identified by the KMO (Kaiser-Meyer-Olkin) statistic were also greater than 0.8, with respect to both family and friends.
Table 1. Sociodemographic and health characteristics of the sample. Belo Horizonte (MG) and Recife (PE), Brazil, 2015.
Gender
Male Female
Marital status
Married/Has living partner Separated
Single Widowed
Family income
≤1 to 2 MS >2 to 5 MS >5 MS
Nutritional status*
Normal weight Overweight Obese Diabetes Hypertension High cholesterol Age (years) 12.3 87.7 56.2 10.2 17.3 16.3 53.1 32.3 14.6 22.8 37.0 40.2 12.4 71.4 52.8 47 334 214 39 66 62 196 119 54 87 141 153 47 272 199 11.1 88.9 33.3 16.7 22.2 27.8 55.6 27.8 16.7 16.7 44.4 38.9 22.2 88.9 55.6 2 16 6 3 4 5 10 5 3 3 8 7 4 16 10
Note: *Body Mass Index (BMI): normal weight
≤ 24.9kg/m2; **Mean and standard deviation; Overweight: 25-29.9kg/m2; Obesity:
≥30kg/m2.
The total sample was compared with the test-retest sample by the statistical chi-square test for a single group or Fisher’s exact test for categorical
variables, and the Student’s t-test for paired samples (continuous variables).
MS: Minimum Salary (R$ 724.00).
Variable
% n
Total sample (n=381)
% n
Test-Retest sample (n=18)
Table 2. Factor analysis of family social support scale for healthy food habits (n=381).Belo Horizonte (MG) and Recife (PE), Brazil, 2015.
1. Encouraged me “not to eat unhealthy foods” (for example, cake, salty snacks, deep-fried foods, sausages and cured meats, like salami) when I got the urge to do so.
2. Talked to me about changing my eating habits (for example, asked how I am dealing with my dietary changes).
3. Reminded me not to eat foods with high fat, salt, or sugar content.
4. Complimented the change in my eating habits (for example “keep it up”, “I am proud of you”. 5. Commented when I went back to my old food habits.
6. Ate foods with high fat, salt, or sugar content in my presence. 7. Refused to eat the same foods as I ate.
8. Brought home foods that I am avoiding.
9. Became annoyed when I suggested that he/she eat foods with lower fat, salt, or sugar content. 10. Offered me foods that I am avoiding.
Eigenvalue Variance (%)
Kaiser-Meyer-Olkin - KMO (general)
-0.8175 -0.8556 -0.8139 -0.6949 -0.6676 -0.0198 -0.1506 -0.0575 -0.0575 -0.0193 3.22 32.2 -0.1026 -0.0798 -0.0169 -0.0999 -0.1389 -0.7586 -0.6052 -0.8073 -0.7159 -0.7901 3.00 30.0 Scale questions Factor 1 0.8345 0.8216 0.8303 0.8774 0.8642 0.8340 0.8996 0.7994 0.8424 0.8074 0.8386
Factor 2 KMO Factor loadings
Note: Bold: grouping of issues according to the factor loading values.
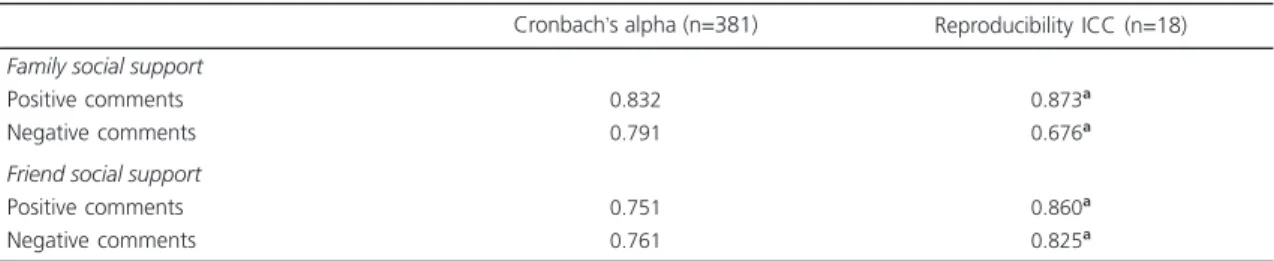
0.873 and 0.676 for family social support, and of 0.860 and 0.825 for friend social support. Only the subscale family’s “negative comments” was below the ideal (R<0.70), but the ICC was statistically significant for all factors.
D I S C U S S I O N
The study results indicate that the Brazilian version of the social support scale for healthy eating habits had satisfactory transcultural equivalence and psychometric properties, and can be used in similar populations in Brazil. Two factors
were identified - “positive comments” and “negative comments” - for each source of social support, friends and family.
The identification of two distinct latent and opposite traits for the family and friend social support scales, called “positive comments” and “negative comments” is similar to the original study of the scale24, in which two subscales were
also generated for each social support source. The difference between this study and that of Sallis et al.24 is the nomenclatures of the
latent traits, since the original study called them “encouragement” and “sabotage”. Moreover, the eigenvalues generated by the study factor
Table 3. Factor analysis of friend social support scale for healthy food habits (n=381). Belo Horizonte (MG) and Recife (PE), Brazil, 2015.
1. Encouraged me “not to eat unhealthy foods” (for example, cake, salty snacks, deep-fried foods, sausages and cured meats, like salami) when I got the urge to do so.
2. Talked to me about changing my eating habits (for example, asked how I am dealing with my dietary changes).
3. Reminded me not to eat foods with high fat, salt, or sugar content.
4. Complimented the change in my eating habits (for example “keep it up”, “I am proud of you”. 5. Commented when I went back to my old food habits.
6. Ate foods with high fat, salt, or sugar content in my presence. 7. Refused to eat the same foods as I ate.
8. Brought home foods that I am avoiding.
9. Became annoyed when I suggested that he/she eat foods with lower fat, salt, or sugar content. 10. Offered me foods that I am avoiding.
Eigenvalue Variance (%)
Kaiser-Meyer-Olkin - KMO (general)
-0.7534
-0.7540
-0.7816
-0.5311
-0.6644
-0.0575
-0.0668
-0.0166
-0.1251
-0.0883
-0.-2.950000 29.50000
-0.1985
-0.0323
-0.0004
-0.1742
-0.0842
-0.7767
-0.6852
-0.6775
-0.6005
-0.7858
-3.0200 -30.20000
Scale questions
Factor 1
0.8289
0.8396
0.8343
0.8787
0.8647
0.8240
0.8446
0.8645
0.8644
0.8066
0.8442
Factor 2 KMO Factor loadings
Note: Bold: Grouping of issues according to the factor loading values.
Table 4. Cronbach’s alpha and test-retest of the social support scale for healthy food habits. Belo Horizonte (MG) and Recife (PE), Brazil, 2015.
Family social support
Positive comments Negative comments
Friend social support
Positive comments Negative comments
0.832 0.791
0.751 0.761
0.873a
0.676a
0.860a
0.825a
Note: ap
≤0.001; Cronbach’s alpha values considered appropriate >0.70.
ICC: Intraclass Correlation Coefficient.
analysis were higher than those found by Sallis
et al.24, and consequently, the explained variance
was also higher.
All factor loading values in both sources of social support were higher (>0.53) than the criterion considered ideal (>0.40)31, indicating that
all questions of the instrument were pertinent for the assessment of social support for eating habits. Thus, no question of the original scale24 was
excluded in the Brazilian version of EASHAS, not affecting the structural validity of the instrument.
The Kaiser-Meyer-Olkin values found in the present study (>0.6) for both family and friends indicated that factor analysis was appropriate and that the sample size was adequate for the test32.
These data signal the consistency of the results.
Reliability analysis using Cronbach’s alpha showed that all factors of the Brazilian version of social support scale for healthy eating habits presented values higher than the adopted criterion (>0.70)33, like the original study24.
However, the subscale identified as friends’
“positive comments” presented a lower alpha value, while the same factor presented one of the highest alpha values (0.87) for Sallis et al.24.
Meanwhile the family’s “positive comments” presented the highest alpha value, similar to the original study (0.87)24.
Regarding reproducibility assessed by intraclass correlation coefficient, the values of the friends’ social support and family’s “positive comments” subscales were higher than adequate (>0.70)33. Only the subscale family’s “negative
comments” had an inadequate ICC value, corroborating the original study of the scale24,
which had an ICC value of 0.57. All Intraclass Correlation Coefficient values of this study were higher than those found by Sallis et al.24.
Some limitations should be considered when extrapolating the results. The study sample consisted mostly of women (87.7% and 88.9%, respectively), and the participants recruited in
Recife had a specific characteristic (hypertension), which may have carried a bias regarding perceived social support for a healthy diet.
The short interval between test and retest administration may have overestimated the temporal stability results of the instrument. However, the literature is not clear about the adequate interval between the test and retest for assessing the temporal stability of scales, and many studies have used different intervals34-37.
The study strengths include the methods used for the validation process, from the procedures used for transcultural adaptation27,28
to the use of exploratory factor analysis31,32 and
other procedures used in the stages of scale reliability assessment33. The validation of the
Brazilian version of social support scale for healthy eating habits should have a positive repercussion on studies in the area, given that, until now in Brazil, there is only one instrument for assessing social support for eating habits, but it focuses exclusively on the intake of fruits and vegetables by university students25.
Another issue worthy of mention is the use of the denomination “unhealthy foods” by the scale to refer to foods with high fat, salt, and sugar contents. This nomenclature is in agreement with the recommendations of the Brazilian Food Guide9, which points out that processed and
ultra-processed foods should be avoided precisely because of these characteristics9. This document
also reinforces the importance of the cultural and social contexts for the promotion of healthy eating habits, denoting the need of studying social support as in important component of these contexts.
The possibility of using the Brazilian version of social support scale for healthy eating habits may encourage more studies in Brazil, increasing the understanding of how social support contributes to food behavior, in addition to collaborating to the development of strategies that stimulate the adoption of healthy eating habits.
C O N C L U S I O N
habits had appropriate transcultural equivalence and psychometric properties for use in similar populations. This instrument is easy to use and inexpensive, and received high scores for question clarity and answer options. Hence, the instrument may be used in other studies, allowing the investigation of different support sources (family and friends) for changing eating habits.
A C K N O W L E D G M E N T S
The authors thank Conselho Nacional de Desenvolvimento Científico e Tecnológico and Progra-ma de Pesquisa para o SisteProgra-ma Único de Saúde: Gestão Compartilhada em Saúde for sponsoring the study. They also thank the Coordenação de Aperfeiçoamento de Pessoal de Ensino Superior for the doctorate grants (Graduate Program in Physical Education, Universidade Federal de Santa Catarina [Federal University of Santa Catarina]) and the professors Dr. Cassiano Ricardo Rech, Dr. Raphael Mendes Ritti-Dias, Dr. Ana Célia Oliveira dos Santos, and Ms. Fernanda Goulart Ritti-Dias for their collaboration in the initial stages of the study.
C O N T R I B U T I O N S
J PESSINI, AM GERAGE, ST MEURER conceived the project, designed the study, wrote the article, analyzed and interpreted the data, and reviewed the article. AR BARBOSA, ACS LOPES, TRB BENEDETTI conceived the project and reviewed the article. All authors approved the final version of the article.
R E F E R E N C E S
1. Kac G, Velasquez-Melendez G. A transição nutri-cional e a epidemiologia da obesidade na América Latina.Cad Saúde Pública; 2003 [acesso 2015 set 16]; 19(Suppl.1):S4-S5. http://dx.doi.org/10.1590/ S0102-311X20 03000700001
2. Melo ME. Os números da obesidade no Brasil: VIGITEL 2009 e POF 2008-2009. São Paulo: ABESO; 2010 [acesso 2015 ago 22]. Disponível em: http:// www.abeso.org.br/pdf/Obesidade%20no%20 Brasil%20VIGITEL%202009%20POF2008_09% 20%20II.pdf
3. Malta DC, Silva Jr JB. O Plano de ações estratégicas para o enfrentamento das doenças crônicas não
transmissíveis no Brasil e a definição das metas glo-bais para o enfrentamento dessas doenças até 2025: uma revisão. Epidemiol Serv Saúde. 2013; 22(1):151-64. http://dx.doi.org/10.5123/ S1679-49 742013000100016
4. Garcia MT, Granado FS, Cardoso MA. Alimentação complementar e estado nutricional de crianças menores de dois anos atendidas no Programa Saúde da Família em Acrelândia, Acre, Amazônia Ocidental Brasileira. Cad Saúde Pública. 2011; 27(2):305-16. http://dx.doi.org/10.1590/S01023 11X2011000200012
5. Popkin BM, Adair LS, NG SW. Global nutrition transition and the pandemic of obesity in developing countries. Nutr Rev. 2012; 70(1):3-21. http://dx.doi.org/10.1111/j.1753-4887.2011.00 456.x
6. Instituto Brasileiro de Geografia e Estatística Pes-quisa de orçamentos familiares 2008-2009: análise do consumo alimentar pessoal no Brasil. Rio de Janeiro: IBGE; 2011 [acesso 2015 ago 22]. Dis-ponível em: http://biblioteca.ibge.gov.br/biblioteca-catalogo?view=detalhes&id =250063
7. Brasil. Ministério da Saúde. Secretaria de Vigilância em Saúde. Política Nacional de Promoção da Saúde. Brasília: Ministério da Saúde; 2006 [acesso 2015 ago 22]. p.60. Disponível em: http://bvsms.saude. gov.br/bvs/publicacoes/PoliticaNacionalPromocao Saude.pdf
8. Brasil. Ministério da Saúde. Secretaria de Atenção à Saúde. Departamento de Atenção Básica. Política Nacional de Alimentação e Nutrição. Brasília: Minis-tério da Saúde; 2013 [acesso 2015 ago 22]. 84p. Disponível em: http://bvsms.saude.gov.br/bvs/ publicacoes/politica_nacional_alimentacao_ nutricao.pdf.
9. Brasil. Ministério da Saúde. Secretaria de Atenção à Saúde. Departamento de Atenção Básica. Guia alimentar para a população brasileira. 2ª ed. Brasília: Ministério da Saúde; 2014 [acesso 2015 ago 20]. 156 p. Disponível em: http://189.28.128.100/dab/ docs/portaldab/publicacoes/guia_alimentar_ populacao_brasileira.pdf
10. Uchino BN. Social support and health: A review of physiological processes potentially underlying links to disease outcomes. J Behav Med. 2006; 29:377-87. http://dx.doi.org/10.1007/s10865-006-9056-5 11. Shaikh AR, Yaroch AL, Nebeling L, Yeh M-C,
Resnicow K. Psychosocial predictors of fruit and vegetable consumption in adults: A review of the literature. Am J Prev Med. 2008; 34(6):535-43. http://dx.doi.org/10.1016/j.amepre.2007.12.028 12. Guillaumie L, Godin G, Vézina-Im LD. Psychosocial
Phys Act. 2010; 2:7-12. http://dx.doi.org/10.1186/ 1479-5868-7-12
13. Ho SC. Health and social preditors of mortality in an elderly chinese cohort. Am J Epidemiol. 1991 [cited 2015 ago 22]; 133:907-21. Available from: http://www.ncbi.nlm.nih.gov/pubmed/2028980 14. Vogt TM, Mullooly JP, Ernst D, Pope CR, Hollis JF.
Social networks as predictors of ischemic heart disease, cancer, stroke and hypertension: Incidence, survival and mortality. J Clin Epidemiol. 1992; 45(6):659-66. http://dx.doi.org/10.1016/0895-43 56(92)90138-D
15. Abreu-Rodrigues M, Seidl EMF. A importância do apoio social em pacientes coronarianos. Paidéia. 2008. 18(40):279-88. http://dx.doi.org/10.1590/S0 103-863X2008000200006
16. Gomes-Villas Boas LC, Foss MC, Freitas MCF, Pace AE. Relationship among social support, treatment adherence and metabolic control of diabetes mellitus patients. Rev Latino-Am Enferm. 2012; 20(1):52-8. http://dx.doi.org/10.1590/S0104-1169 2012000100008
17. Souza JMB, Castro MM, Maia EMC, Ribeiro AN, Almondes KM, Silva NG. Obesidade e tratamento: desafio comportamental e social. Rev Bras Ter Cogn. 2005 [acesso 2016 jun 1]; 1(1):59-67. Disponível em: http://pepsic.bvsalud.org/scielo.php?pid= S1808-568720050001000 07&script=sci_arttext 18. Sherbourne CD. The role of social supports and life
stress events in use of mental health services. Med Care, 1988 [acesso 2016 Jun 10]; 27(12):1393-400. Disponível em: http://www.ncbi.nlm.nih.gov/ pubmed/3238458
19. Berkman LF, Glass T. Social integration, social networks, social support and health. In: Berkman LF, Kawachi I, editores. Social Epidemiology. New York: Oxford University Press; 2000. p.137-73. 20. Chor D, Griep RH, Lopes CS, Faerstein E. Medidas
de rede e apoio social no estudo pró-saúde: pré-testes e estudo piloto. Cad Saúde Pública. 2001; 17:887-96. http://dx.doi.org/10.1590/S0102-311X 2001000400022
21. Hupcey JE. Clarifying the social support theory research linkage. J Advan Nurs. 1998; 27(6):1231-41. http://dx.doi.org/10.1046/j.1365-2648.1998.01 231.x
22. Langford CP, Bowsher J, Maloney JP, Lillis PP. Social support: A conceptual analysis. J Advan Nurs. 1997; 25(1):95-100. http://dx.doi.org/10.1046/j.1365-2648.1997.1997025095.x
23. King G, Willoughby C, Specht JA, Brown E. Social support processes and the adaptation of individuals with chronic disease. Qual Health Resear. 2006; 16(7):902-25. http://dx.doi.org/10.1177/104973 2306289920
24. Sallis JF, Grossman RM, Pinski RB, Patterson TL, Nader PR. The development of scales to measure social support for diet and exercise behaviors. Prev Med. 1987 [cited 2015 jul 25]; 16(6):825-36. Available from: http://www.ncbi.nlm.nih.gov/ pubmed/3432232
25. Tassitano RM, Cabral PC, Silva GAP. Validação de escalas psicossociais para mudança do consumo de frutas, legumes e verduras. Cad Saúde Pública. 2014; 30(2):272-82. http://dx.doi.org/10.1590/010 2-311X00153812
26. Sociedade Brasileira de Hipertensão Arterial. Sociedade Brasileira de Cardiologia. Sociedade Bra-sileira de Nefrologia. VI Diretrizes BraBra-sileiras de Hipertensão Arterial. Rev Bras Hipertens. 2010; 13(1):1-68.
27. Vijver FVD, Hambleton RK. Translating tests: Some practical guidelines. Eur Psychol. 1996; 1(2):89-99. http://dx.doi.org/10.1027/1016-9040.1.2.89 28. Reichenheim ME, Moraes CL. Operacionalização de
adaptação transcultural de instrumentos de aferição usados em epidemiologia. Rev Saúde Pública. 2007; 41(4):665-73. http://dx.doi.org/10.1590/S0034-8 9102006005000035
29. World Health Organization. Waist circumference and waist-hip ratio: Report of a WHO expert consultation. Geneva: WHO; 2011 [cited 2015 Aug 22]. Available from: http://www.who.int/nutrition/ publications/obesity/WHO_report_waistcircum ference_and_waisthip_ratio/en/
30. World Health Organization. Obesity: Preventing and managing the global epidemic. Report of a World Health Organization Consultation. WHO Obesity Technical Report. Series 894. Geneva: WHO; 2000 [cited 2015 Aug 22]. Available from: http://www. who.int/nutrition/publications/obesity/WHO_ TRS_894/en/
31. Pett MA, Lackey NR, Sullivan JJ. Making sense of factor analysis: The use of factor analysis for instrument development in health care research. Thousand Oaks: Sage; 2003.
32. Pallant, J. SPSS Survival Manual. Buckingham: Open University Press; 2007.
33. Terwee CB, Bot SD, Boer MR, Van der Windt DA, Knol DL, Dekker J, et al. Quality criteria were proposed for measurement properties of health status questionnaires. J Clin Epidemiol. 2007; 60(1):34-42. http://dx.doi.org/10.1016/j.jclinepi. 2006.03.012
35. Silva, KS, Coutinho, ESF. Escala de apoio social aplicada a uma população de gestantes: con-fiabilidade teste-reteste e estrutura de concordância dos itens. Cad Saúde Pública. 2005 [acesso 2015 jun 21]; 21(3):979-83. Disponível em: http://www. scielo.br/scielo.php?pid=S0102-311X20050003 00035&script=sci_abstract
36. Reis MS, Reis RS, Hallal PC. Validade e fidedignidade de uma escala de avaliação do apoio social para a atividade física. Rev Saúde Pública. 2011;
45(2):294-301. http://dx.doi.org/10.1590/S0034-8 910201100020000http://dx.doi.org/10.1590/S0034-8
37. Griep RH, Chor D, Faerstei E, Lopes C. Apoio social: confiabilidade teste-reteste de escala no Estudo Pró-Saúde. Cad Saúde Pública. 2003; 19(2):625-34. http://dx.doi.org/10.1590/S0102-311X2003000 200029