AR
TICLE
1 Faculdade de Ciências Médicas, Departamento de Saúde Coletiva, Universidade Estadual de Campinas. R. Tessália Vieira de Camargo 126, Cidade Universitária. 13083-887 Campinas SP Brasil. danideassumpcao@ gmail.com 2 Curso de Nutrição, Departamento de Políticas Públicas e Saúde Coletiva, Universidade Federal de São Paulo. São Paulo SP Brasil. 3 Faculdade de Saúde Pública, Departamento de Nutrição, Universidade de São Paulo. São Paulo SP Brasil.
Differences between men and women in the quality of their diet:
a study conducted on a population in Campinas, São Paulo, Brazil
Abstract This study aimed to evaluate differ-ences between men and women on a global index and for each component of the Brazilian Healthy Eating Revised-Index (BHEI-R), as well as with reference to associated factors of the BHEI-R. This is a cross-sectional population-based study which analyzed information for 949 adults. For each sex, the mean for BHEI-R and its components were es-timated. Women showed higher scores in the com-ponents of: fruits, vegetables and milk. Amongst men, the score was higher only in the component of: meat and eggs. Regarding associated factors, important differences were observed between the sexes. For men, better scores were observed among those aged 40 years or over and for those who did not do anything to lose weight. For women, in re-lation to better quality of diet, the following was observed: the advancing age, the practice of phys-ical activities in leisure time, not smoking, living with less than three people in their household and the presence of chronic diseases. The results point-ed to the nepoint-ed to develop strategies to improve the quality of diets in adults, especially men.
Key words Sex, Adult, Food consumption, Health
surveys, Population groups
Daniela de Assumpção 1
Semíramis Martins Álvares Domene 2
Regina Mara Fisberg 3
Ana Maria Canesqui 1
A
ss
umpção D Introduction
The differences between men and women for morbidity and mortality1-3 largely reflect the
dif-ferences in their life styles and their respective behavior in relation to health4,5. With regard to
food, an increase in the consumption of fruits and vegetables and reduction in the consump-tion of salt and saturated fats and trans fats have all been recommended for the prevention of dis-eases6,7 and significant reductions in deaths
ow-ing to cardiovascular diseases and neoplasms in some areas8.
Research in Brazil that uses reference marks for the consumption of healthy food and un-healthy food has shown that compared with women, men show a higher prevalence in the consumption of: salt9, soft drinks and meats with
an excessive amount of fat as well as showing a low consumption of fruits and vegetables4,5,10.
Studies that analyzed the eating character-istics of Brazilian adults and those of North Americans through the Brazilian Healthy Eating Revised-Index (BHEI-R) or the Healthy Eating Index-2005, found a better quality of diet for females11-13, due to the greater consumption of
fruits, vegetables, oils, milk and its derivatives11,12.
Taking into account that food and eating habits are one of the elements that highlight the inequality in health in the population, this study sought to analyze the eating habits and food standards of men and women through the use of the BHEI-R. This tool permits the evaluation of the meeting and compliance to the nutritional recommendations in relation to food, nutrients and/or culinary ingredients14. The BHEI-R came
from the Healthy Eating Index-200515 that was
created in 199516 and it is currently in its third
re-vised form17. It is periodically revised to
incorpo-rate advances in nutritional science. The BHEI-R went through some alterations in order to take in to account the food guidelines as set out for the Brazilian population in 200618.
A number of factors were taken into consid-eration in order to define the study objective: the greater work burden for adults who must provide and care for a family; the reduction in time spent on their own health; the impact that work has on the consumption of food; the fact that gender differences constitute a relevant factor in social inequality in relation to food1-3; and the
impor-tance of food in the prevention of illnesses and the promotion of health6,7. As a result, the
objec-tive of this study was to evaluate the differenc-es in the quality of the diets between men and women adults with consideration for the global
indicator and the various components investigat-ed by the BHEI-R and to also identify the possi-ble differences between the sexes with reference to the standards for the factors associated with quality eating.
Methods
The information used in this article was obtained from the Health Survey of Campinas (ISACAMP 2008), which was a transversal study done on a base population.
The survey covered the analysis of the health conditions of those in the age range of: adoles-cents (10-19 years old), adults (20-59 years old) and the elderly (60 years old and over). The tar-get population was non-institutionalized resi-dents in households in the urban municipality of Campinas. In this study, we opted to analyze just the adults.
The samples were randomly selected and they were all equal in size being 1,000 people in each age range taking into account: the estimation of a proportion of 0.50 with a sample error between 4 and 5 percentage points, a confidence interval of 95% and a design effect of 2.
The sample process for the ISACAMP 2008 was organized in two stages: sector census and households. In the first stage, a systematic ran-dom selection was done for the 50 census sectors with a proportional probability based on the number of households. The IBGE (Brazilian In-stitute of Geography and Statistics) defined sec-tors were used which had been defined for the 2000 Census and consideration was given to the time that had past since the Census. There was an updating of the addresses of the selected sectors. In the second stage, the number of households that should be selected from the sample was de-termined, based on the ratio people⁄households for each age group. In this way, 700 households were randomly selected for interviews with adult members. This included the losses due to the ex-pectation of having a response rate of 80%.
The interviewers were trained and supervised to carry out interviews in selected households directly with the residents that were randomly selected.
e C
ole
tiv
a,
22(2):347-358,
2017
consumed in the day prior to the interview. The quantitative character of this record for 24 hours resulted in an estimation that was more accurate for the quantities and types of food consumed and it permitted the verification of how much was consumed and whether the recommended nutritional values were met or not. The interviews were conducted on different days of the week and months of the year to minimize the variability of the consumption of food19.
Variables analyzed in this study
The dependent variable was the global scor-ing on the Brazilian Healthy Eatscor-ing Revised-In-dex (BHEI-R)14. The tool is made up of 12
com-ponents with eight referring to the groups of foods (Total fruits; Whole fruits; Total vegetables; Dark green and orange vegetables and legumes; To-tal grains; Whole grains; Milk and dairy products; Meat, eggs and legumes) and four relative to the nutrients and/or culinary ingredients (Sodium; Saturated fat; Oils; SoFAAs that represent the percentage of the participation of the fats being,
saturated fat and trans-fat, as well as alcohol and added sugar in relation to the energy value of the diet).
The components received specific scores that varied from zero (minimum) to a maximum of 5, 10 or 20 depending on the component (Chart 1). The minimum point is attributed to the void consumption (components 1 to 9) or to the consumption above the limit advocated (com-ponents 10 to 12), while the maximum point for each component is established when the rec-ommended value for consumption is reached or passed. The scores for the intermediate values of consumed food took into account the intervals between criteria for the minimum points and the maximum, ones which were calculated on a proportional basis. The components from 1 to 9 evaluated the adequateness of the consump-tion and the consumpconsump-tion from 10 to 12 cov-ered the moderation of the consumption, which conferred opposite senses to the meaning of the points, meaning the increase of consumption re-flecting positively in the points for the groups 1 to 9 and negatively in the groups 10 to 12. The
Chart 1. Scoring criteria for the components of the BHEI-R.
Components of the BHEI-R
Range of points (minimum to maximum)
Criteria for the minimum points
Criteria for the maximum points
Adequacy (high scores mean greater consumption)
1. Total fruits* 0 to 5 No consumption 1.0 portion/1.000 kcal
2. Whole fruits 0 to 5 No consumption 0.5 portion/1.000 kcal
3. Total vegetables 0 to 5 No consumption 1.0 portion/1.000 kcal 4. Dark green and orange
vegetables 0 to 5 No consumption 0.5 portion/1.000 kcal 5. Total grains 0 to 5 No consumption 2.0 portion/1.000 kcal
6. Whole grains 0 to 5 No consumption 1.0 portion/1.000 kcal
7. Milk and dairy products 0 to 10 No consumption 1.5 portion/1.000 kcal
8. Meat and eggs# 0 to 10 No consumption 1.0 portion/1.000 kcal
9. Oils** 0 to 10 No consumption 0.5 portion/1.000 kcal
Moderation (high scores means less consumption)
10. Saturated fat 0 to 10 ≥ 15% of the VET*** ≤ 7% of the VET
11. Sodium 0 to 10 ≥ 2.0g/1.000 kcal ≤ 0.75g/1.000 kcal
12. SoFAAS 0 to 20 ≤ 35% of the VET ≤ 10% of the VET
BHEI-R total 0 to 100
Source: Previdelli et al.14.
A
ss
umpção D total BHEI-R is represented by the sum of the components being able to reach the maximum of 100 points. The calculation of the BHEI-R is based on the information obtained through the application of the 24-hour record that was kept.
During the fieldwork, the content of the re-cords were check meticulously by a nutritionist to identify the necessary corrections. The quan-tification of the records was carried out with the purpose of changing into grams or milliliters the food quantities and preparations that had been listed using household measures. In order to do this, information was taken from household measurement tables20,21, food labels and
custom-er scustom-ervice providcustom-ers.
The software Nutrition Data System for Re-search (NDS-R) version 2007 was used for in-putting the consumption information and to produce the necessary values to calculate the BHEI-R. In order to correct the typing mistakes, we conducted a consistency analysis of data from records that added to fewer than 800 kcal or to more than 3,500 kcal.
Based on the Healthy Eating Index-2005, the BHEI-R used the energy from the leguminous plants to add on points to the components of meat and eggs, and given the increased scores in the leguminous plants category, these points were added successively to the total vegetable component and to the dark green and orange vegetables component. Due to the fact that the Brazilian population consumes more legumi-nous plants than the Americans, this method re-sults in overestimated scores in the components referred to. In addition to this, beans and meats, as well as beans and vegetables show important differences in the nutritional profile and in the quality and protein use. Thus, in this study the le-guminous plants were not included in these three components.
Four groups of independent variables were selected to analyze the associated factors for the quality of the diet for each sex:
.
Demographics and socioeconomics: age (in years), race color of skin self-referred, number of residents in the household, marital status, num-ber of equipment in the household (radio, tele-vision, refrigerator, freezer, air conditioning, vac-uum cleaner, among others), family income per capita (in minimum wage) and level of education (in years of study)..
Behavior related to health: smoking, the disposition for having rules in the home on smoking; frequency of consumption of alcohol-ic drinks, the dependency on the use of alcohol evaluated by the Alcohol Use DisorderIdentifica-tion Test (AUDIT) with the cutting point being equal to or greater than eight in the range from 0-4022; physical activity in the context of leisure
measured by the International Questionnaire on Physical Activity (IPAQ), the long version, cat-egorized in: active people (adults that practice at least 150 minutes per week distributed over a minimum of three days), insufficiently active people (those that practiced at least 150 minutes per week or they practiced more however in less than three days per week) and those being sed-entary (those that did not practice any type of physical activity during their leisure time on any day in the week); if they wanted to change their weight (increase or decrease) and if they were do-ing anythdo-ing to loose weight (watchdo-ing what they ate, diet, practicing physical exercise, the use of medications and the omission of meals).
.
Morbidities: number of chronic diseases amongst those included on the checklist (hyper-tension, diabetes, heart diseases, cancer, arthritis, osteoporosis, asthma/bronchitis/emphysema, tendonitis and circulatory problems)..
Body Mass Index (BMI): calculated based on the information related to weight and height23,24.The nutritional state was classified in accor-dance with the recommendation from the World Health Organization for adults25: low weight BMI
< 18.5kg/m2, IMC eutrophy between 18.5 and
24.9kg/m2, overweight BMI between 25.0 and
29.9kg/m2 and obesity BMI ≥ 30kg/m2.
Independent analysis was done for the men and women. Initially the average values were es-timated from the global BHEI-R and from each component, as well as from the global BHEI-R according to the categories of the independent variables, through the use of simple linear re-gression with an interval of confidence being 95% (95%CI). Then the multiple linear regres-sion model was developed in two stages. Firstly, the demographic and socioeconomic variables were introduced with a category that had a sig-nificance level of below 0.20 in the bivariate anal-ysis, while variables with p < 0.05 were retained in the model. Secondly, what was kept in the model were the variables that remained from the first stage; these were then added to behaviors re-lating to health and morbidities with p < 0.20 in the bivariate analysis, staying in the second stage having variables with p < 0.05. The models were adjusted by the total energy of the diet according to the recommendation from Willett et al.26
e C
ole
tiv
a,
22(2):347-358,
2017
from version 11.0 of the Stata software (Stata Corp. College Station, the United States) that permitted the analysis of data of the complex samples.
The research project was approved by the Ethics Committee on Research at the Universi-dade Estadual de Campinas and by the National Commission for Ethics in Research (system CEP/ CONEP).
Results
Of the 957 adults identified to participate in the research, eight refused to respond by record-ing their eatrecord-ing habits for 24 hours. This analy-sis included 949 individuals, with 444 men and 505 women, being an average age of 37.0 years (95%CI: 36.0-37.9) and 37.8 years old (95%CI: 36.9-38.8), respectively.
The classification of diet being “better” or “worse” in quality used in this study was based on complying with the nutritional recommenda-tions of the food and nutrients in the BHEI-R.
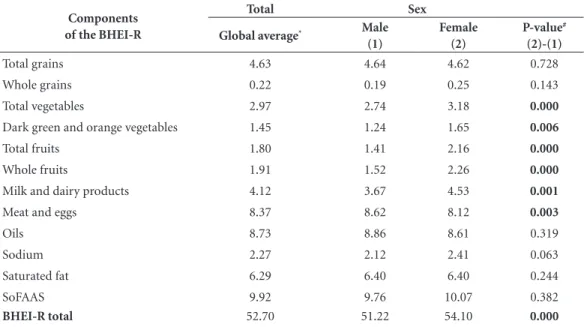
The components of the BHEI-R that showed the worse points, for the population group of adults that were analyzed, concerned the inade-quate consumption of: whole grains, sodium, to-tal and whole fruits, milk and dairy products, and dark green and orange vegetables. Compared to
men, the women had scores that were less in only the components of meat and eggs, and greater points in those related to fruits, vegetables, milk and milk derivatives (Table 1).
The global quality of the diet reached 52.7 points, being significantly higher in women (54.1; 95%CI: 51.7-56.4) than the men (51.2; 95%CI: 50.0-52.3). Entre os homens, foi verifi-cado um aumento nos escores do IQD-R a partir dos 40 anos de idade, e a menor média de pontos nos solteiros situou-se no limiar da significância estatística.
Amongst the men, it was shown that there was an increase in the BHEI-R score from the age of 40 years old and the lowest average number of points for single men was found to be on the threshold of statistical significance. In the wom-en, the quality of the food showed itself to be better in the people that were advanced in age as well, as in the men, and it was better in the seg-ment that reported having 15 or more appliances in the household. On the other side, the women who lived in households with six or more resi-dents had the worse quality of diet in relation to those that lived alone or with only one other res-ident (Table 2).
The sub-group of the male sex that alleged that they would like to lose weight and that they would do something to lose weight, showed diets that were of poor quality. Lesser points from the
Table 1. Average score for each component of the BHEI-R according to sex for adults aged between 20 and 59.
Health Survey of Campinas, São Paulo State, Brazil, 2008.
Components of the BHEI-R
Total Sex
Global average* Male
(1)
Female (2)
P-value#
(2)-(1)
Total grains 4.63 4.64 4.62 0.728
Whole grains 0.22 0.19 0.25 0.143
Total vegetables 2.97 2.74 3.18 0.000
Dark green and orange vegetables 1.45 1.24 1.65 0.006
Total fruits 1.80 1.41 2.16 0.000
Whole fruits 1.91 1.52 2.26 0.000
Milk and dairy products 4.12 3.67 4.53 0.001
Meat and eggs 8.37 8.62 8.12 0.003
Oils 8.73 8.86 8.61 0.319
Sodium 2.27 2.12 2.41 0.063
Saturated fat 6.29 6.40 6.40 0.244
SoFAAS 9.92 9.76 10.07 0.382
BHEI-R total 52.70 51.22 54.10 0.000
A
ss
umpção D
BHEI-R were found for the women who lived in households in which they were permitted to smoke, while higher scores were found amongst the phys-ically active in their leisure time, showing that they did something to lose weight and that referred to the presence of chronic disease (Table 3).
The results of the analysis of multiple lin-ear regression for the male sex showed average points that were significantly higher in the in-dividuals that were 40 years old or over and an average that was significantly less in those that said they did something to lose weight (Table 4). In the women, what was observed, was a better quality of diet with the increase in age, in those that practiced some level of physical activity in
their leisure time, and in those that referred to having a chronic disease. Women smokers and those that lived in households with three or more people had a poor quality of food (Table 4).
Discussion
The findings of this article showed a better qual-ity of diet for women. This was especially due to the greater consumption of fruits, vegetables, milk and dairy products in relation to men.
The other researchers also analyzed the American population and noted that the quality of the diet for women there is better than that
Table 2. Averages of the BHEI-R according to socioeconomic and demographic variables for men and women
adults between the ages of 20 and 59. Health Survey of Campinas, São Paulo State, Brazil, 2008.
Variables Men Women
n Averages** P-value# n Averages** P-value#
Age range (in years)
20 to 29* 153 48.92 150 50.43
30 to 39 100 50.97 0.108 131 54.39 0.005
40 to 49 96 52.54 0.002 124 56.13 0.000
50 to 59 95 54.01 0.001 100 56.84 0.000
Race / Color of skin
White* 322 51.40 367 54.40
Black 42 51.74 0.847 43 52.13 0.337
Mixed-race 76 50.41 0.533 92 53.64 0.574
Number of people in household
1 to 2* 102 51.62 112 56.06
3 to 5 268 51.31 0.803 307 54.02 0.061
6 or + 74 50.34 0.433 86 51.73 0.005
Marital status
With spouse* 276 51.75 311 54.67
Separated 33 52.82 0.624 57 54.60 0.973
Single 132 49.66 0.053 125 52.34 0.063
Number of appliances in household
1 to 9* 168 50.86 170 52.83
10 to 14 140 50.70 0.892 170 53.58 0.566
15 or + 135 52.27 0.406 164 55.82 0.040
Family income per capita (minimum wage)
< 1* 160 51.76 216 54.16
1 to 3 201 50.76 0.291 193 53.18 0.439
> 3 83 51.32 0.753 96 55.70 0.379
Level of education (in years)
0 to 7* 119 51.50 153 54.33
8 to 11 188 50.07 0.190 211 53.38 0.422
12 or + 137 52.49 0.521 141 54.89 0.698
e C
ole
tiv
a,
22(2):347-358,
2017
of men11. This was noted by Hiza et al.12 showing
average values of 54.0 in men and 59.0 in women between the ages of 18 to 64 years old who had participated in the NHANES 2003-04 (Nation-al He(Nation-alth and Nutrition Examination Survey). These scores are higher for those observed in this study, which were 51.2 for males and 54.1 for females. However, the greater difference for the women was not confirmed in the other Brazilian
studies that found higher points for the Healthy Eating Index in adolescents27 and in male adults28.
The points for the components of fruits, vegetables, milk and dairy products were sig-nificantly higher in women. Other authors doc-umented a higher amount of points for women in the components of fruits, vegetables, oils and this as also the case when an evaluation was done on the energy percentage coming from solid fats,
Table 3. Averages of the BHEI-R according to the variables: behaviors related to health, morbidities and Body
Mass Index (BMI) for men and women adults between the ages of 20 and 59. Health Survey of Campinas, São Paulo State, Brazil, 2008.
Variables Men Women
n Averages** P-value# n Averages** P-value#
Smoking
Never smoked* 280 50.98 363 54.19
Ex-smoker 53 51.70 0.627 56 56.66 0.166
Smoker 110 51.66 0.613 85 52.07 0.133
Rules of households with reference to smoking
Not permitted to smoke* 186 51.70 204 55.92
Permitted to smoke in some areas / times 117 50.46 0.355 145 52.98 0.010
No rules 140 51.28 0.689 155 52.83 0.010
Frequency of alcohol consumption
Do not drink* 174 51.97 323 54.59
1 to 4 times in the month 172 50.23 0.115 155 53.39 0.423 2 or + times in the week 98 51.68 0.848 25 52.47 0.435
AUDIT***
Negative* 375 51.61 487 54.25
Positive 69 49.12 0.140 17 49.72 0.145
Practice of physical activity at leisure (IPAQ)
Sedentary* 260 50.65 377 53.17
Insufficiently active 100 51.37 0.530 54 56.66 0.102
Active 84 52.74 0.210 74 56.88 0.010
Would like to change their weight
No* 251 51.84 152 54.39
Yes, gain weight 49 52.96 0.543 37 49.94 0.068
Yes, lose weight 143 49.58 0.038 312 54.37 0.982
Do something to lose weight
No* 397 51.67 373 53.09
Yes 47 47.41 0.021 132 56.87 0.005
Number of chronic diseases
0* 301 50.49 288 52.30
1 or + 140 52.63 0.091 210 56.52 0.001
IMC (Kg / m2)
Low weight / eutrophy* 223 51.44 264 54.05
Overweight 152 51.75 0.809 147 54.51 0.676
Obesity 58 49.44 0.213 85 54.01 0.979
A
ss
umpção D
alcohol and the addition of sugar11,12. The Vigitel
(Surveillance System for Risk and Protective Fac-tors for Chronic Diseases by Telephone Survey) also showed that in females there was a greater prevalence in the consumption of fruits and
veg-etables and a lesser prevalence for soft drinks/ar-tificial juice and meat with apparent fat4.
Other Brazilian research has shown better eating standards for women in relation to other nutrients. Data from the INA (National Dietary
Table 4. Model of multiple linear regression: variables associated with the global averages of the BHEI-R in men
and women from the ages of 20 to 59. Health Survey of Campinas, São Paulo State, Brazil, 2008.
Men
Variables First step
**
(CI95%) P-value
# Second step
***
(CI95%) P-value
#
Energy (Kcal) 54.79 (50.60-58.98) 55.35 (51.20-59.50)
Age range (in years)
20 to 29* 54.79 (50.60-58.98) 55.35 (51.20-59.50)
30 to 39 56.84 (50.15-63.52) 0.106 57.42 (50.79-64.07) 0.101 40 to 49 57.18 (50.61-63.74) 0.048 57.65 (51.07-64.24) 0.064 50 to 59 59.07 (51.91-66.24) 0.006 59.71 (52.50-66.92) 0.006 Do something to lose weight
No* 55.35 (51.20-59.50)
Yes 50.82 (43.30-58.35) 0.010
Women
Variables First step
**
(CI95%) P-value
# Second step
***
(CI95%) P-value
#
Energy (Kcal) 58.70 (54.80-62.60) 57.55 (53.46-61.64)
Age range (in years)
20 to 29* 58.70 (54.80-62.60) 57.55 (53.46-61.64)
30 to 39 62.07 (55.65-68.48) 0.010 60.82 (54.19-67.44) 0.013
40 to 49 63.73 (57.31-70.14) 0.000 62.05 (55.10-69.00) 0.003
50 to 59 63.88 (56.76-71.00) 0.002 61.31 (53.89-68.73) 0.028 Number of people in household
1 to 2* 58.70 (54.80-62.60) 57.55 (53.46-61.64)
3 to 5 56.52 (50.52-62.51) 0.042 55.37 (49.26-61.47) 0.034
6 or + 54.55 (47.65-61.46) 0.008 53.63 (46.43-60.83) 0.014 Smoking
Never smoked* 57.55 (53.46-61.64)
Ex-smoker 58.14 (50.49-65.79) 0.741
Smoker 54.01 (47.03-61.01) 0.018
Practice of physical activity at leisure (IPAQ)
Sedentary* 57.55 (53.46-61.64)
Insufficiently active 61.49 (53.80-69.18) 0.033
Active 60.44 (53.64-67.23) 0.037
Number of chronic diseases
0* 57.55 (53.46-61.64)
1 or + 60.50 (53.98-67.02) 0.018
e C
ole
tiv
a,
22(2):347-358,
2017
Survey, 2008-09) showed that women´s inges-tions were lower for sodium and higher for vita-mins A and C, Zinc and riboflavin29.
The best quality of diet for women has been attributed to distinct factors. In relation to men, the women are more concerned with the quality of the food and tend to check with greater fre-quency and attention the nutritional information contained on the food labels, including the list of ingredients, the size of the portions and the nu-tritional appeal30. The care women take in their
selection and in preparing food, results in part, to the fact that these tasks have been historical-ly done by them31. The pressure of work and the
need to eat quickly makes them search out for fast food snack bars, bars and street food sellers, which contributed to the lower scores for men. With ref-erence to the consumption of food outside of the household, the men were highlighted in compari-son to women in the regions in Brazil32.
The low score for women in the component of meat and eggs is consistent with the ingestion of iron observed in the National Dietary Survey, with a divergent prevalence concerning the in-adequacy of the nutrient amongst men (4.1%) and women (31.5% in the age range of 20-50 and 8.9% in the age range between 51 to 59)29. On
the other side, in relation to the consumption of meat, data from Vigitel reveal a lesser prevalence for female ingestion of meat with apparent fat4.
The rationality of the science of nutrition brings with it: an imaginary idea in relation to food, traditional knowledge that has been accu-mulated, beliefs and representations produced by the act of eating and the hierarchy of need measured by the buying power of families. The dietary tradition of classifying the food as “hot/ cold”, “strong/weak” and “reimoso” (bad for you) is anchored by a group of beliefs that are a part of the food ideology33. For the men, beef symbolizes
masculinity, virility and eating prosperity, being considered a strong food that keeps a person sat-isfied for a long period of time. Fruits and vege-tables are considered more adequate for women, the elderly and children and they are considered to be unnecessary items in bad financial situations31.
With reference to associated factors to the quality of the diet, the only one that was seen in both sexes was age, with an average increase in the points of the BHEI-R with the advancement of age. In research that analyzed the scores for Healthy Eating Index-2005 of three groups of dif-ferent age groups, there was a tendency of a wors-ening in the quality of eating in the age groups between 2-17 years old and a trend for improved quality of eating in the age groups of 18 to 64
and for the over 65s12. A study based on
informa-tion from the ISACAMP survey on health did not detect differences in the quality of the diet with the increase in the age from 12 to 19 years34, but
the other study on the elderly population, with the same database, found a better quality of food in the individuals that were 80 years old or over compared with those aged 60 to 69 years old35.
In contrast with the women, the men that said that they did something in order to lose weight had a diet that was worse than the men that did nothing. In the bivariate analysis, doing some-thing to lose weight among women was found to be associated with a better quality of diet, but this was no longer present in the final model due to the strength of the variable of the physical ac-tivity. Also in the bivariate analysis, the men that stated that they would like to lose weight, showed worse scores than the men that did not intend to change their weight. This finding is important because it reveals that even amongst men who were concerned with their body weight and who embarked on a diet or activity to lose weight, they showed a standard of diet that was worse. This result was due to the different behavior amongst the men and women in relation to the access to health services and the search for nutritional in-formation. It is probable that the men are trying to lose weight by themselves and in doing so they are not consuming the necessary quantity of en-ergy or they are excluding/avoiding certain types of food. Uptake of consultations regarding nutri-tional guidance was proved to be greater among adults up to the age of 74, while after this age there was no longer a difference36.
Only for the women, the number of residents in households was associated with the quality of the diet. Evaluating the data from the PNAD (Na-tional Household Sample Survey) for 2004, Hoff-mann37 observed that the proportion of
house-holds in situations of food safety lowered with the increase in the number of people in the house-hold. Households with a greater number of res-idents covered individuals in low socioeconomic classes. The task of managing and controlling the distribution of food quotas for the domestic group is one of the obligations of the women as mothers and housewives31. In Campinas, 78% of
A
ss
umpção D Canesqui31 showed that the distribution of food
covers having a scale of priorities according to age, gender and the fact of having work or not.
Different to the men, the women that smoked and did not practice physical activity had low scores on the BHEI-R. The results revealed a congruence of healthy behavior for the women and not for the men. This means that the women that had healthy eating habits tended, in a larg-er proportion, practiced physical exlarg-ercise and not to smoke. Also in the bivariate analysis, the women showed better quality eating habits than those that lived in houses where rules prohibiting smoking existed. In relation to the quality of the diet, Guenther et al.15 observed that the
smok-ers had 8.6 points less in the Healthy Eating In-dex-2005 score compared with the non-smokers. In the survey in the municipality of São Paulo, the ex-smokers had 5.4 points more than those that had never smoked39. This is probably the
result of reverse causality effect meaning the ap-pearance of diseases may have forced the individ-ual to eat more healthy food.
The presence of a chronic disease showed an association with the quality of the diet just for the women. This finding may result in greater concerns for the women in relation to their own health and greater attention being paid to the signs and symptoms of illnesses. The women also use more health services and exchange health ex-periences with other women. The impact of the diagnosis of a chronic disease may prompt the person into sticking to a healthier diet as a part of their treatment40. In research done with adults
aged 20 and over showed a gradient of better scores on the Healthy Eating Index-2005 with an increase in the number of morbidities41.
Amongst the limitation of this study one can highlight the application of just one 24-hour food registration, which may not necessarily be representative of the individual’s typical food in-gestion on account of the intra-individual vari-ability regarding food ingestion. However, when applied to a population-based sample and when consideration is given to the different days and months of the year, the average consumption for
the target population can be estimated42. On the
other hand, the transversal study impedes the in-terpretation of the associations found as a result of the relations between cause and effect. The survey that was used as a source of data in this study encompasses a broader issue and was not designed specifically for nutrition, which may re-duce the level of detail in questions about food consumption, but at the same time it increases the health variables that can be evaluated in re-lation to diets. Also, it is important to mention that subsequently during the carrying out of this study there was a revision of the national guide-lines on food, that was published through the Di-etary Guidelines for the Brazilian Population in 201443, that brought implications for the analysis
of the quality of the diet.
It is important to highlight that the recog-nition of the worse health profile, the high rates of mortality and the greater resistance of men in seeking out health services, led to the creation of the Men Health Comprehensive Attention Na-tional Policy44 with the perspective of improving
primary health care for men with a focus on en-suring a more extensive level of services.
The differences observed in the quality of the consumption of food and in the associated fac-tors with the quality of the diet amongst men and women may be a result of the fact that a greater portion of men have their lives marked by their work, the difficulty in looking for health care which may be due to a lack of time or through thinking that there is no need for health care, in addition to the greater consumption of food out-side of the home. The results show the need for measures that promote improvements in eating habits for a part of the population and that spe-cial attention ought to be given to men, as this study shows, that they have poor diets.
e C
ole
tiv
a,
22(2):347-358,
2017
Collaborations
D Assumpção came up with the proposal for this paper and also conducted a revision of the literature in this area as well as having analyzed the data and drafted the text. SMA Domene, AM Canesqui e RM Fisberg collaborated in interpreting the data as well as drafting and critically revising the intellectual content. MBA Barros participated in coming up with the proposal for this paper as well as analyzing the data and drafting the text.
References
1. Barros MBA, Francisco PMSB, Zanchetta LM, César CLG. Tendências das desigualdades sociais e demo-gráficas na prevalência de doenças crônicas no Brasil, PNAD: 2003-2008. Cien Saude Colet 2011; 16(9):3755-3768.
2. Pinheiro RS, Viacava F, Travassos C, Brito AS. Gênero, morbidade, acesso e utilização de serviços de saúde no Brasil. Cien Saude Colet 2002; 7(4):687-707.
3. Laurenti R, Jorge MHPM, Gotlieb SLD. Perfil epide-miológico da morbi-mortalidade masculina. Cien Sau-de Colet 2005; 10(1):35-46.
4. Iser BPM, Yokota RTC, Sá NNB, Moura L, Malta DC. Prevalência de fatores de risco e proteção para doenças crônicas nas capitais do Brasil – principais resultados do Vigitel 2010. Cien Saude Colet 2012; 17(9):2343-2356.
5. Malta DC, Andrade SSCA, Stopa SR, Pereira CA, Szwarcwald CL, Silva Júnior JB, Reis AAC. Estilos de vida da população brasileira: resultados da Pesquisa Nacional de Saúde, 2013. Epidemiol Serv Saúde 2015; 24(2):217-226.
6. O’Flaherty M, Flores-Mateo G, Nnoaham K, Lloyd- Williams F, Capewell S. Potential cardiovascular mor-tality reductions with stricter food policies in the Unit-ed Kingdom of Great Britain and Northern Ireland. Bull World Health Organ 2012; 90(7):522-531. 7. Willett WC, Stampfer MJ. Current evidence on healthy
eating. Annu Rev Public Health 2013; 34:77-95. 8. World Health Organization (WHO). Global status
re-port on noncommunicable diseases 2010. Geneva: WHO; 2011.
9. Oliveira MM, Malta DC, Santos MAS, Oliveira TP, Nil-son EAF, Claro RM. Consumo elevado de sal autorrefe-rido em adultos: dados da Pesquisa Nacional de Saúde, 2013. Epidemiol Serv Saúde 2015; 24(2):249-256. 10. Souza AM, Pereira RA, Yokoo EM, Levy RB, Sichieri R.
Alimentos mais consumidos no Brasil: Inquérito Na-cional de Alimentação 2008-2009. RevSaude Publica 2013; 47(Supl 1):190-199.
Acknowledgments
To the Conselho Nacional de Desenvolvimento Científico e Tecnológico for the funding of the research and the MBA Barros and RM Fisberg productivity grants. To the Municipal Health Secretariat of Campinas and to the Secretariat of Health Surveillance of the Ministry of Health, for the financial support to the field research of ISACAMP 2008. To CAPES for the doctoral scholarship granted to D Assumpção.
11. Ervin RB. Healthy Eating Index-2005 total and com-ponent scores for adults aged 20 and over: National Health and Nutrition Examination Survey, 2003-2004. National Health Statistics Reports 2011; 44(13):1-9. 12. Hiza HAB, Casavale KO, Guenther PM, Davis CA. Diet
quality of americans differs by age, sex, race/ethnicity, income, and education level. J Acad Nutr Diet 2012; 113(2):297-306.
13. Loureiro AS, Silva RMVG, Rodrigues PRM, Pereira RA, Wendpap LL, Ferreira MG. Qualidade da dieta de uma amostra de adultos de Cuiabá (MT):associação com fatores sociodemográficos. Rev Nutr 2013; 26(4):431-441.
14. Previdelli AN, Andrade SC, Pires MM, Ferreira SRG, Fisberg RM, Marchioni DM. Índice de Qualidade da Dieta Revisado para população brasileira. RevSaude Publica 2011; 45(4):794-798.
15. Guenther PM, Reedy J, Krebs-Smith SM, Reeve BB, Basiotis PP. Development and Evaluation of the Healthy Eating Index-2005: Technical Report. Washington: U.S. Department of Agriculture; 2007.
16. Kennedy ET, Ohls J, Carlson S, Fleming K. The Healthy Eating Index: Design and applications. J Am Diet Assoc 1995; 95(10):1103-1108.
17. Guenther PM, Casavale KO, Reedy J, Kirkpatrick SI, Hiza HAB, Kuczynski KJ, Kahle LL, Krebs-Smith SM. Update of the Healthy Eating Index: HEI-2010. J Acad Nutr Diet 2013; 113(4):569-580.
18. Brasil. Ministério da Saúde (MS). Secretaria de Atenção à Saúde. Departamento de Atenção Básica. Coordena-ção-Geral da Política de Alimentação e Nutrição. Guia alimentar para a população brasileira: promovendo a alimentação saudável. Brasília: MS; 2006.
A
ss
umpção D 20. Fisberg RM, Villar BS. Manual de receitas e medidas ca-seiras para cálculo de inquéritos alimentares. São Paulo: Editora Signus; 2002.
21. Pinheiro ABV, Lacerda EMA, Benzecry EH, Gomes MCS, Costa VM. Tabela para avaliação de consumo ali-mentar em medidas caseiras. São Paulo: Editora Athe-neu; 2004.
22. Lima CT, Freire ACC, Silva APB, Teixeira RM, Farrel M, Prince M. Concurrent and construct validity of the AUDIT in an urban Brazilian sample. Alcohol and Al-coholism 2005; 40(6):584-589.
23. Peixoto MRG, Benicio MHDA, Jardim PCBV. Validade do peso e da altura auto-referidos: o estudo de Goiânia. RevSaude Publica 2006; 40(6):1065-1072.
24. Connor Gorber S, Tremblay M, Moher D, Gorber B. A comparison of direct vs. self-report measures for as-sessing height, weight and body mass index: a system-atic review. Obes Rev 2007; 8(4):307-326.
25. World Health Organization (WHO). Physical status: the use and interpretation of anthropometry. Geneva: WHO; 1995.
26. Willett WC, Howe GR, Kushi LH. Adjustment for total energy intake in epidemiologic studies. Am J Clin Nutr 1997; 65:S1220-8.
27. Andrade SC, Barros MBA, Carandina L, Goldbaum M, Cesar CLG, Fisberg RM. Dietary Quality Index and As-sociated Factors among Adolescents of the State of Sao Paulo, Brazil. J Pediatr 2010; 156(3):456-60.
28. Morimoto JM, Latorre MRDO, Cesar CLG, Carandina L, Barros MBA, Goldbaum M, Fisberg RM. Fatores as-sociados à qualidade da dieta de adultos residentes na Região Metropolitana de São Paulo, Brasil, 2002. Cad Saude Publica 2008; 24(1):169-178.
29. Araujo MC, Bezerra IN, Barbosa FS, Junger WL, Yokoo EM, Pereira RA, Sichieri R. Consumo de macronu-trientes e ingestão inadequada de micronumacronu-trientes em adultos. RevSaude Publica 2013; 47(Supl. 1):177-189. 30. Stran KA, Knol LL. Determinants of food label use
dif-fer by sex. J Acad Nutr Diet 2013; 113(5):673-679. 31. Canesqui AM. Mudanças e permanências da prática
alimentar cotidiana de famílias de trabalhadores. In: Canesqui AM, Garcia RWD, organizadores. Antropolo-gia e nutrição: um diálogo possível. Rio de Janeiro: Edi-tora Fiocruz; 2005. p. 167-210.
32. Bezerra IN, Souza AM, Pereira RA, Sichieri R. Consu-mo de alimentos fora do domicílio no Brasil. RevSaude Publica 2013; 47(Supl. 1):200-211.
33. Canesqui AM. A qualidade dos alimentos: análise de algumas categorias da dietética popular. Rev Nutr 2007; 20(2):203-216.
34. Assumpção D, Barros MBA, Fisberg RM, Carandina L, Goldbaum M, Cesar CLG. Qualidade da dieta de ado-lescentes: estudo de base populacional em Campinas, SP. Rev Bras Epidemiol 2012; 15(3):605-616.
35. Assumpção D, Domene SMA, Fisberg RM, Barros MBA. Qualidade da dieta e fatores associados entre idosos: estudo de base populacional em Campinas, São Paulo. CadSaude Publica 2014; 30(8):1680-1694. 36. Endevelt R, Baron-Epel O, Viner A, Heymann AD.
So-cioeconomic status and gender affects utilization of medical nutrition therapy. Diab Res Clin Pract 2013; 101(1):20-27.
37. Hoffmann R. Determinantes da insegurança alimentar no Brasil: análise dos dados da PNAD de 2004. Rev Se-gurança Alimentar e Nutricional 2008; 15(1):49-61. 38. McIntyre L, Glanville NT, Raine KD, Dayle JB,
Ander-son B, Battaglia N. Do low-income lone mothers com-promise their nutrition to feed their children? CMAJ 2003; 168(6):686-691.
39. Andrade SC. Mudanças na qualidade da dieta e seus fa-tores associados em residentes do Município de São Paulo em 2003-2008: estudo de base populacional [tese]. São Paulo: Universidade de São Paulo; 2013.
40. Dorner TE, Stronegger WJ, Hoffmann K, Stein KV, Niederkrotenthaler T. Socio-economic determinants of health behaviours across age groups: results of a cross-sectional survey. CEJMed 2013; 125(9-10):261-269.
41. Wang Y, Chen X. How much of racial/ethnic disparities in dietary intakes, exercise, and weight status can be ex-plained by nutrition- and health-related psychosocial factors and socioeconomic status among US adults? J Am Diet Assoc 2011; 111(12):1904-1911.
42. Breslow RA, Guenther PM, Juan W, Graubard BI. Alco-holic beverage consumption, nutrient intakes, and diet quality in the US adult population, 1999-2006. J Am Diet Assoc 2010; 110(4):551-562.
43. Brasil. Ministério da Saúde (MS). Secretaria de Atenção à Saúde. Departamento de Atenção Básica. Guia Ali-mentar para a População Brasileira. Brasília: MS; 2014. 44. Brasil. Ministério da Saúde (MS). Secretaria de Atenção
à Saúde. Departamento de Ações Programáticas Estra-tégicas. Política Nacional de Atenção Integral à Saúde do Homem: princípios e diretrizes. Brasília: MS; 2009.
Article submitted 04/05/2015 Approved 16/11/2015