Bernardo L Horta
IDenise P Gigante
ICesar G Victora
IFernando C Barros
III Programa de Pós-Graduação em Epidemiologia. Universidade Federal de Pelotas. Pelotas, RS, Brasil
II Programa de Pós-Graduação em Saúde e Comportamento. Universidade Católica de Pelotas. Pelotas, RS, Brasil
Correspondence:
Bernardo Lessa Horta
Programa de Pós-Graduação em Epidemiolo-gia – UFPEL
R. Marechal Deodoro, 1160 96020-220 Pelotas, RS, Brasil E-mail: [email protected] Received: 2/6/2008 Revised: 9/28/2008 Approved: 9/29/2008
Early determinants of blood
pressure among adults of the
1982 birth cohort, Pelotas,
Southern Brazil
ABSTRACT
OBJECTIVE:
To evaluate the effects of exposure occurring during pregnancy
or the
fi
rst years of life on blood pressure.
METHODS:
Cohort study on all children born in 1982 in maternity hospitals in
the city of Pelotas, Southern Brazil. The mothers living in the urban area were
interviewed and the children were followed up on different occasions. In 2004-5,
all the individuals in the cohort were sought for monitoring. Their blood pressure
was measured twice, at the start and end of the interview, using a digital wrist
sphygmomanometer. Associations between blood pressure and the following
variables were evaluated: skin color; maternal schooling level; family income
at birth; change in income between birth and 23 years of age; birth weight; and
duration of breastfeeding. Analysis of variance was used to compare the means
and a generalized linear model was used in the adjusted analysis.
RESULTS:
Blood pressure measurements were obtained from 4,291
individuals: 2,208 males and 2,083 females. The mean systolic blood pressure
was 117.5 ± 15.0 mmHg and the mean diastolic was 73.6 ± 11.5 mmHg.
Among the men, systolic blood pressure was higher among those of black or
brown skin color and among those who were never considered poor. Diastolic
pressure was only associated with birth weight. Among the women, systolic
blood pressure was greater among those of black or brown skin color whose
mothers’ schooling level was greater than or equal to 12 years or whose birth
weight was less than 4,000 g.
CONCLUSIONS:
For both sexes, only skin color was associated with blood
pressure. Breastfeeding did not have any long-term effect on blood pressure and
the associations for birth weight and socioeconomic level were inconsistent.
DESCRIPTORS: Adult. Hypertension, epidemiology. Prenatal
Exposure, delayed effects. Maternal Exposure. Socioeconomic Factors.
Health Inequalities. Cohort Studies. Brazil.
INTRODUCTION
Hypertension is an important risk factor for ischemic cardiopathy and stroke.
12The World Health Organization
4has estimated that around seven million deaths
Epidemiological studies conducted in several
coun-tries have suggested that occurrences of chronic
dis-eases such as ischemic cardiopathy,
6,15diabetes
14and
hypertension
8,10may be programmed by exposure that
occurs during gestation or the
fi
rst years of life. Birth
weight and breastfeeding are factors possibly
associ-ated with arterial pressure levels in adulthood.
7,10Some
authors have suggested that socioeconomic adversity
during childhood may also program risk factors for
chronic diseases.
11The objective of the present paper was to evaluate the
effects of exposure that occurred during pregnancy or
the
fi
rst years of life on blood pressure.
METHODS
All the children who were born in maternity hospitals
in the city of Pelotas in 1982 were identi
fi
ed and their
mothers were interviewed. Those children whose
fami-lies lived in the urban area of the city were followed up
on different occasions. The detailed methodology for
the cohort has been published in another paper.
2In 2004-5, 4,291 members of the cohort (2,208 men
and 2,083 women) had their blood pressures measured
using a digital wrist sphygmomanometer (Omron
HEM-629). Two measurements were made, at the
start and end of the interview, with the interviewee
seated and the arm supported at the level of the breast
region. The blood pressure measurements were made
by trained interviewers.
The systolic and diastolic blood pressure values were
treated as continuous variables in the data analysis,
using the mean of the two measurements. High blood
pressure was de
fi
ned as mean systolic pressure
≥
140
mmHg and/or mean diastolic pressure
≥
90 mmHg, in
accordance with the de
fi
nitions of the seventh
Ameri-can Consensus.
5Analysis of variance was used to compare means and
generalized linear model in the adjusted analysis. The
multivariable analysis followed a hierarchical model
with the following levels: sex, skin color, maternal
schooling and family income at birth in the
fi
rst level;
birth weight in the second level; and breastfeeding in
the third level.
The variable of income change was constructed from
the family income distribution in tertiles in 1982 and
2004-5. The interviewees were classi
fi
ed according to
the following categories: always poor (individuals in
the lowest tertile of family income both in 1982 and in
2004-5); poor
→
non-poor (lowest tertile in 1982 and
middle or highest tertile in 2004-5); non-poor
→
poor
(middle or highest tertile in 1982 and lowest tertile in
2004-5); and never poor (middle or highest tertile both
in 1982 and in 2004-5).
Verbal informed consent was obtained from the adult
responsible for the children during the early phase of the
study (from 1982 to 1986), as was the common practice
at that time, when there was no ethics committee at the
Universidade Federal de Pelotas
. For the more recent
phases, the university’s research ethics committee,
which is af
fi
liated to the National Council for Research
Ethics (
Conselho Nacional de Ética em Pesquisa
,
CONEP), approved the study and written informed
consent was obtained from the participants.
RESULTS
The mean of the systolic blood pressure measurements
was 117.5 ±15.0mmHg and, of the diastolic
measure-ments, 73.6 ±11.5mmHg. The mean blood pressure
(both systolic and diastolic), was higher among the
men. The frequency of high blood pressure values
was greater among the men (16.4%) than among the
women (5.3%).
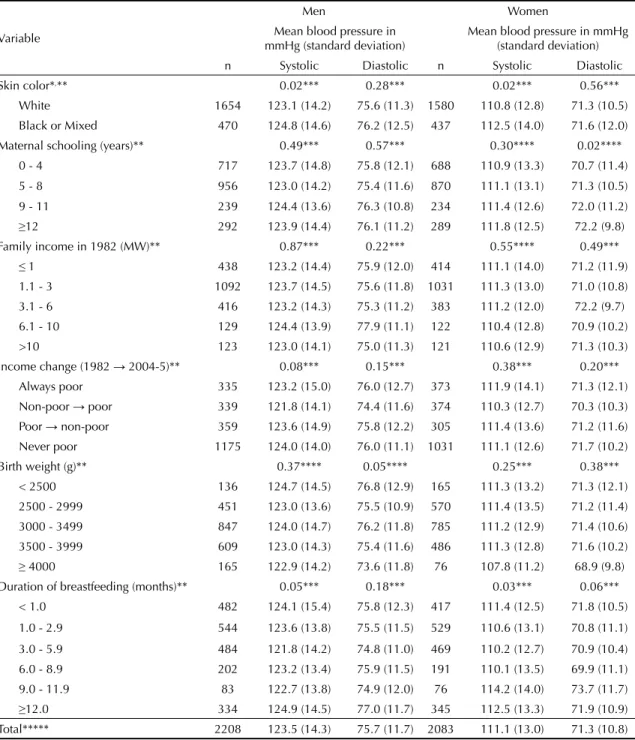
Table 1 shows the crude analyses for the men and
women. Unadjusted analyses expressed as regression
coef
fi
cients are presented in Tables 2 and 3 for the men
and women, respectively.
Among the men, the systolic blood pressure was
higher among those of Black or Mixed skin color,
and this association was still observed after
control-ling for possible confounding factors. Income change
was also associated with systolic blood pressure,
which was lower among men who changed from
poor during childhood to non-poor during adulthood.
A similar result was observed for diastolic pressure,
but without statistical signi
fi
cance. Low birth weight
was only associated with higher diastolic pressure,
and this result was maintained after adjusting for the
socioeconomic variables and skin color. Lower means
for systolic and diastolic pressure were observed
among the men who had been breastfed for three to
fi
ve months (Table 2).
DISCUSSION
This cohort has been followed up since birth. It was
observed that blood pressure was higher among the
men. In analyses strati
fi
ed according to sex, it was
observed that white skin color and intermediate
du-rations of breastfeeding were associated with lower
blood pressure levels at 23 years of age among both
the men and the women. In addition, low birth weight
was related to greater diastolic pressure among the men
Table 1. Mean systolic and diastolic blood pressure according to birth weight, skin color, family income at birth, maternal
schooling and duration of breastfeeding, according to sex. Pelotas, Southern Brazil, 1982 to 2004-5.
Variable
Men Women
Mean blood pressure in mmHg (standard deviation)
Mean blood pressure in mmHg (standard deviation)
n Systolic Diastolic n Systolic Diastolic
Skin color*,** 0.02*** 0.28*** 0.02*** 0.56***
White 1654 123.1 (14.2) 75.6 (11.3) 1580 110.8 (12.8) 71.3 (10.5)
Black or Mixed 470 124.8 (14.6) 76.2 (12.5) 437 112.5 (14.0) 71.6 (12.0)
Maternal schooling (years)** 0.49*** 0.57*** 0.30**** 0.02****
0 - 4 717 123.7 (14.8) 75.8 (12.1) 688 110.9 (13.3) 70.7 (11.4)
5 - 8 956 123.0 (14.2) 75.4 (11.6) 870 111.1 (13.1) 71.3 (10.5)
9 - 11 239 124.4 (13.6) 76.3 (10.8) 234 111.4 (12.6) 72.0 (11.2)
≥12 292 123.9 (14.4) 76.1 (11.2) 289 111.8 (12.5) 72.2 (9.8)
Family income in 1982 (MW)** 0.87*** 0.22*** 0.55**** 0.49***
≤1 438 123.2 (14.4) 75.9 (12.0) 414 111.1 (14.0) 71.2 (11.9)
1.1 - 3 1092 123.7 (14.5) 75.6 (11.8) 1031 111.3 (13.0) 71.0 (10.8)
3.1 - 6 416 123.2 (14.3) 75.3 (11.2) 383 111.2 (12.0) 72.2 (9.7)
6.1 - 10 129 124.4 (13.9) 77.9 (11.1) 122 110.4 (12.8) 70.9 (10.2)
>10 123 123.0 (14.1) 75.0 (11.3) 121 110.6 (12.9) 71.3 (10.3)
Income change (1982 → 2004-5)** 0.08*** 0.15*** 0.38*** 0.20***
Always poor 335 123.2 (15.0) 76.0 (12.7) 373 111.9 (14.1) 71.3 (12.1)
Non-poor → poor 339 121.8 (14.1) 74.4 (11.6) 374 110.3 (12.7) 70.3 (10.3)
Poor → non-poor 359 123.6 (14.9) 75.8 (12.2) 305 111.4 (13.6) 71.2 (11.6)
Never poor 1175 124.0 (14.0) 76.0 (11.1) 1031 111.1 (12.6) 71.7 (10.2)
Birth weight (g)** 0.37**** 0.05**** 0.25*** 0.38***
< 2500 136 124.7 (14.5) 76.8 (12.9) 165 111.3 (13.2) 71.3 (12.1)
2500 - 2999 451 123.0 (13.6) 75.5 (10.9) 570 111.4 (13.5) 71.2 (11.4)
3000 - 3499 847 124.0 (14.7) 76.2 (11.8) 785 111.2 (12.9) 71.4 (10.6)
3500 - 3999 609 123.0 (14.3) 75.4 (11.6) 486 111.3 (12.8) 71.6 (10.2)
≥ 4000 165 122.9 (14.2) 73.6 (11.8) 76 107.8 (11.2) 68.9 (9.8)
Duration of breastfeeding (months)** 0.05*** 0.18*** 0.03*** 0.06***
< 1.0 482 124.1 (15.4) 75.8 (12.3) 417 111.4 (12.5) 71.8 (10.5)
1.0 - 2.9 544 123.6 (13.8) 75.5 (11.5) 529 110.6 (13.1) 70.8 (11.1)
3.0 - 5.9 484 121.8 (14.2) 74.8 (11.0) 469 110.2 (12.7) 70.9 (10.4)
6.0 - 8.9 202 123.2 (13.4) 75.9 (11.5) 191 110.1 (13.5) 69.9 (11.1)
9.0 - 11.9 83 122.7 (13.8) 74.9 (12.0) 76 114.2 (14.0) 73.7 (11.7)
≥12.0 334 124.9 (14.5) 77.0 (11.7) 345 112.5 (13.3) 71.9 (10.9)
Total***** 2208 123.5 (14.3) 75.7 (11.7) 2083 111.1 (13.0) 71.3 (10.8)
MW: Minimum wages
* 150 interviewees classifi ed themselves as Asian or indigenous
** Out of the 4297 subjects interviewed in 2004-5, there was missing information in the cases of 141 individuals (3.3% of the interviewees)
*** Test for heterogeneity **** Test for linear trend
and greater systolic pressure among the women. On the
other hand, among these young adults’ socioeconomic
conditions during childhood did not have any effect
on their blood pressure. Regarding the effect of birth
weight on blood pressure, Adair & Dahly
1reviewed
the evidence relating to factors with long-term action
on blood pressure and concluded that low birth weight
was associated with a small increase in blood
pres-sure. Most of the studies were carried out in developed
countries, and they reported that for each 1 kg increase
in birth weight, there was a reduction of 1 to 4 mmHg
in blood pressure. In the present study, an increase of
Table 2. Crude and adjusted analyses on the effect of the independent variables on systolic and diastolic blood pressure among
the men. Pelotas, Southern Brazil, 1982 to 2004-5.
Variable Systolic pressure in mmHg Diastolic pressure in mmHg
Crude Adjusted* Crude Adjusted*
Skin color 0.02** 0.02** 0.28** 0.23**
White 0 0 0 0
Black or Mixed 1.67 (0.23;3.17) 1.90 (0.36;3.44) 0.66 (-0.54;1.85) 0.76 (-0.49;2.00)
Maternal schooling (years) 0.49** 0.45** 0.57*** 0.59***
0 – 4 -0.15 (-2.11;1.80) -0.64 (-3.15;1.87) -0.30 (-1.88;1.29) -0.40 (-2.44;1.64)
5 – 8 -0.85 (-2.74;1.03) -1.23 (-3.56;1.10) -0.68 (-2.21;0.85) -0.65 (-2.54;1.25)
9 – 11 0.54 (-1.92;3.00) 0.29 (-2.37;2.95) 0.21 (-1.79;2.20) 0.27 (-1.89;2.43)
≥12 0 0 0 0
Family income in 1982 (MW) 0.87** 0.80** 0.55*** 0.27**
≤1 0.14 (-2.74;3.02) 0.18 (-3.28;3.63) 0.90 (-1.43;3.23) 1.07 (-1.73;3.88)
1.1 – 3 0.65 (-2.03;3.34) 0.98 (-2.20;4.16) 0.59 (-1.59;2.76) 0.85 (-1.73;3.43)
3.1 – 6 0.21 (-2.68;3.11) 0.59 (-2.56;3.75) 0.31 (-2.03;2.66) 0.52 (-2.04;3.08)
6.1 – 10 1.42 (-2.13;4.98) 1.51 (-2.08;5.09) 2.89 (0.02;5.77) 2.93 (0.02;5.83)
>10 0 0 0 0
Income change (1982 → 2004-5) 0.08** 0.05** 0.15** 0.27**
Always poor -0.82 (-2.56;0.92) -1.76 (-3.79;0.27) 0.03 (-1.38;1.45) -0.10 (-1.74;1.55)
Non-poor → poor -2.26 (-3.99;-0.53) -2.33 (-4.11;-0.55) -1.60 (-3.01;-0.19) -1.43 (-2.87;0.02)
Poor → non-poor -0.43 (-2.12;1.27) -1.38 (-3.34;0.59) -0.13 (-1.51;1.24) -0.26 (-1.86;1.33)
Never poor 0 0 0 0
Birth weight (g) 0.37*** 0.30*** 0.05*** 0.04***
<2500 1.77 (-1.49;5.03) 1.91 (-1.38;5.21) 3.13 (0.49;5.77) 3.17 (0.50;5.84)
2500 – 2999 0.14 (-2.43;2.70) 0.12 (-2.46;2.70) 1.92 (-0.16;3.99) 1.97 (-0.12;4.06)
3000 – 3499 1.10 (-1.29;3.50) 1.07 (-1.34;3.49) 2.61 (0.67;4.55) 2.61 (0.66;4.57)
3500 – 3999 0.09 (-2.38;2.56) -0.02 (-2.51;2.46) 1.80 (-0.20;3.81) 1.77 (-0.24;3.78)
≥4000 0 0 0 0
Duration of breastfeeding (months) 0.05** 0.42** 0.18** 0.50**
<1.0 -0.75 (-2.76;1.25) -0.62 (-2.64;1.41) -1.22 (-2.84;0.41) -1.24 (-2.88;0.40)
1.0 - 2.9 -1.33 (-3.29;0.62) -1.17 (-3.15. 0.80) -1.45 (-3.03;0.14) -1.48 (-3.08;0.12)
3.0 - 5.9 -3.06 (-5.06;-1.06) -3.04 (-5.06;-1.02) -2.21 (-3.83;-0.59) -2.28 (-3.92;-0.65)
6.0 - 8.9 -1.72 (-4.23;0.78) -1.78 (-4.31;0.76) -1.11 (-3.14;0.92) -1.21 (-3.26;0.85)
9.0 - 11.9 -2.23 (-5.67;1.22) -2.46 (-6.00;1.07) -2.09 (-4.88;0.71) -2.64 (-5.50;0.23)
≥12.0 0 0 0 0
MW: Minimum wages
* The variables in the fi rst level (skin color, maternal schooling and family income in 1982) were adjusted between each other and maintained in the analysis model if p < 0.2. Income change was adjusted for skin color. Birth weight was adjusted for skin color, maternal schooling and family income in 1982. Breastfeeding was adjusted for skin color, maternal schooling, income in 1982 and birth weight
1 kg in birth weight was associated with a reduction of
0.91 mmHg (95%CI: -2.07; 0.25) in systolic pressure
among the men and 0.63 mmHg (95%CI: -1.76; 0.51)
among the women, i.e. similar to observations in the
literature.
1On the other hand, among the individuals
with low birth weight, the blood pressure was higher,
but no linear trend was observed.
Contrary to what had been observed in relation to
height at the age of 19 years,
3blood pressure did not
present any association with socioeconomic conditions
during childhood. Moreover, the similarity in mean
blood pressure between individuals who were born and
remained poor and those who were born and remained
in the higher socioeconomic strata suggests that the
Table 3. Crude and adjusted analyses on the effect of the independent variables on systolic and diastolic blood pressure among
the women. Pelotas, Southern Brazil, 1982 to 2004-5.
Variable Systolic pressure in mmHg Diastolic pressure in mmHg
Crude Adjusted* Crude Adjusted*
Skin color 0.02** 0.01** 0.56** 0.39**
White 0 0 0 0
Black or Mixed 1.70 (0.32;3.07) 1.79 (0.36;3.21) 0.35 (-0.80;1.49) 0.53 (-0.66;1.71)
Maternal schooling (years) 0.30*** 0.05*** 0.02*** 0.02***
0 – 4 -0.92 (-2.71;0.87) -2.40 (-4.73;-0.07) -1.53 (-3.01;-0.04) -2.11 (-4.05;-0.18)
5 – 8 -0.72 (-2.46;1.01) -1.96 (-4.13;0.20) -0.94 (-2.38;0.50) -1.46 (-3.26;0.34)
9 – 11 -0.41 (-2.66;1.84) -1.24 (-3.64;1.16) -0.23 (-2.09;1.63) -0.67 (-2.66;1.32)
≥12 0 0 0 0
Family income in 1982 (MW) 0.55*** 0.36*** 0.49** 0.36***
≤1 0.49 (-2.15;3.13) 1.82 (-1.41;5.04) -0.08 (-2.27;2.11) 1.45 (-1.23;4.13)
1.1 a 3 0.70 (-1.76;3.15) 2.03 (-0.93;4.99) -0.29 (-2.32;1.75) 1.02 (-1.43;3.48)
3.1 a 6 0.52 (-2.14;3.19) 1.44 (-1.46;4.35) 0.88 (-1.33;3.08) 1.68 (-0.72;4.09)
6.1 a 10 -0.25 (-3.53;3.03) 0.21 (-3.12;3.54) -0.41 (-3.13;2.30) -0.04 (-2.80;2.72)
>10 0 0 0 0
Income change (1982 → 2004-5) 0.38** 0.38** 0.20** 0.16**
Always poor 0.78 (-0.76;2.32) 1.17 (-0.71;3.03) -0.37 (-1.65;0.91) 0.44 (-1.11;1.99)
Non-poor → poor -0.84 (-2.38;0.70) -0.64 (-2.23;0.94) -1.40 (-2.68;-0.12) -1.13 (-2.45;0.19)
Poor → non-poor 0.31 (-1.35;1.98) 0.59 (-1.32;2.51) -0.45 (-1.83;0.93) 0.22 (-1.37;1.80)
Never poor 0 0 0 0
Birth weight (g) 0.25** 0.38** 0.38** 0.38**
<2500 3.56 (0.03;7.10) 3.71 (0.15;7.26) 2.39 (-0.55;5.32) 2.54 (-0.41;5.49)
2500 – 2999 3.60 (0.48;6.71) 3.60 (0.47;6.72) 2.24 (-0.34;4.83) 2.28 (-0.31;4.88)
3000 – 3499 3.42 (0.35;6.48) 3.51 (0.43;6.58) 2.46 (-0.09;5.00) 2.48 (-0.07;5.03)
3500 – 3999 3.55 (0.40;6.70) 3.76 (0.61;6.92) 2.67 (0.06;5.28) 2.68 (0.06;5.29)
≥4000 0 0 0 0
Duration of breastfeeding (months) 0.03** 0.02** 0.18** 0.03**
<1.0 -1.14 (-2.99;0.72) -1.14 (-3.02;0.74) -0.10 (-1.64;1.44) -0.16 (-1.72;1.40)
1.0 - 2.9 -1.88 (-3.65;-0.12) -1.96 (-3.74. -0.18) -1.06 (-2.52;0.41) -1.19 (-2.67;0.29)
3.0 - 5.9 -2.27 (-4.08;-0.46) -2.31 (-4.14;-0.48) -1.01 (-2.51;0.49) -1.18 (-2.70;0.34)
6.0 - 8.9 -2.45 (-4.75;-0.15) -2.52 (-4.85;-0.19) -1.97 (-3.88;-0.06) -2.14 (-4.08;-0.21)
9.0 - 11.9 1.69 (-1.54;4.92) 2.03 (-1.25;5.31) 1.83 (-0.85;4.52) 2.03 (-0.70;4.75)
≥12.0 0 0 0 0
MW: Minimum wages
* The variables in the fi rst level (skin color, maternal schooling and family income in 1982) were adjusted between each other and maintained in the analysis model if p < 0.2. Income change was adjusted for skin color. Birth weight was adjusted for skin color, maternal schooling and family income in 1982. Breastfeeding was adjusted for skin color, maternal schooling, income in 1982 and birth weight.
cumulative exposure to low socioeconomic conditions
also did not present any effect on arterial pressure.
Be-cause the information on family income was collected
in infancy, the possibility of information bias is small.
Therefore, the absence of effect from socioeconomic
conditions on arterial pressure at 23 years of age is not
expected to result from such bias.
Since the incidence of breastfeeding was nearly
univer-sal among the population studied, it was not possible
to replicate the analysis performed in other studies,
13in which the blood pressure of the subjects who had
never been breastfed was compared with the pressure
among those who had been breastfed. In a paper on
data gathered from previous follow-ups of this cohort,
we did not observe any effect relating to the duration
of predominant breastfeeding on blood pressure.
9In
a meta-analysis, it was shown that breastfeeding
pre-sented a small effect on blood pressure.
71. Adair L, Dahly D. Developmental determinants of blood pressure in adults. Annu Rev Nutr. 2005;25:407-34. DOI: 10.1146/annurev.nutr.25.050304.092538
2. Barros FC, Victora CG, Horta BL, Gigante DP. Metodologia do estudo da coorte de nascimentos
de 1982 a 2004-5, Pelotas, RS. Rev Saude Publica.
2008;42(Supl.2):7-15.
3. Barros AJ, Victora CG, Horta BL, Goncalves HD, Lima RC, Lynch J. Effects of socioeconomic change from birth to early adulthood on height and overweight. Int J Epidemiol. 2006;35(5):1323-8. DOI: 10.1093/ije/dyl160
4. Brundtland GH. From the World Health Organization. Reducing risks to health, promoting healthy life. JAMA. 2002;288(16):1974. DOI: 10.1001/jama.288.16.1974
5. Chobanian AV, Bakris GL, Black HR, Cushman WC, Green LA, Izzo Jr JL, et al. The Seventh Report of the Joint National Committee on Prevention, Detection, Evaluation, and Treatment of High Blood Pressure: the JNC 7 report. JAMA. 2003;289(19):2560-72. DOI: 10.1001/jama.289.19.2560
6. Eriksson JG, Forsén T, Tuomilehto J, Winter PD, Osmond C, Barker DJ. Catch-up growth in childhood and death from coronary heart disease: longitudinal study. BMJ. 1999;318(7181):427-31.
7. Horta BL, Bahl R, Martines JC, Victora CG. Evidence on the long-term effects of breastfeeding- Systematic reviews and meta-analyses. Geneva: World Health Organization; 2007.
8. Horta BL, Barros FC, Victora CG, Cole TJ. Early and late growth and blood pressure in adolescence. J Epidemiol Community Health. 2003;57(3):226-30. DOI: 10.1136/jech.57.3.226
9. Horta BL, Victora CG, Lima RC, Goncalves H, Guimarães BE, Barros FC. Breastfeeding duration and blood pressure among Brazilian adolescents. Acta Paediatr. 2006;95(3):325-31. DOI: 10.1080/08035250 500434744
10. Huxley RR, Shiell AW, Law CM. The role of size at birth and postnatal catch-up growth in determining systolic blood pressure: a systematic review of the literature. J Hypertens. 2000;18(7):815-31. DOI: 10.1097/00004872-200018070-00002
11. Kivimäki M, Smith GD, Juonala M, Ferrie JE, Keltikangas-Järvinen L, Elovainio M, et al. Socioeconomic position in childhood and adult cardiovascular risk factors, vascular structure, and function: cardiovascular risk in young Finns study. Heart. 2006;92(4):474-80. DOI: 10.1136/ hrt.2005.067108
12. Lewington S, Clarke R, Qizilbash N, Peto R, Collins R, Prospective Studies Collaboration. Age-specifi c relevance of usual blood pressure to vascular mortality: a meta-analysis of individual data for one million adults in 61 prospective studies. Lancet. 2002;360(9349):1903-13. DOI: 10.1016/S0140-6736(02)11911-8
13. Martin RM, Ness AR, Gunnell D, Emmett P, Davey Smith G, ALSPAC Study Team. Does breast-feeding in infancy lower blood pressure in childhood? The Avon Longitudinal Study of Parents and Children (ALSPAC). Circulation. 2004;109(10):1259-66. DOI: 10.1161/01. CIR.0000118468.76447.CE
14. Newsome CA, Shiell AW, Fall CH, Phillips DI, Shier R, Law CM. Is birth weight related to later glucose and insulin metabolism? A systematic review. Diabet Med. 2003;20(5):339-48. DOI: 10.1046/j.1464-5491.2003.00871.x
15. Rich-Edwards JW, Stampfer MJ, Manson JE, Rosner B, Hankinson SE, Colditz GA, et al. Birth weight and risk of cardiovascular disease in a cohort of women followed up since 1976. BMJ. 1997;315(7105):396-400.
16. Stamler J, Stamler R, Neaton JD, Wentworth D, Daviglus ML, Garside D, et al. Low risk-factor profi le and long-term cardiovascular and noncardiovascular mortality and life expectancy: fi ndings for 5 large cohorts of young adult and middle-aged men and women. JAMA. 1999;282(21):2012-8. DOI: 10.1001/ jama.282.21.2012
17. Whelton PK, He J, Appel LJ, Cutler JA, Havas S, Kotchen TA, et al. Primary prevention of hypertension: clinical and public health advisory from The
National High Blood Pressure Education Program.
JAMA. 2002;288(15):1882-8. DOI: 10.1001/
jama.288.15.1882
REFERENCES
This article is based on data from the study “Pelotas birth cohort, 1982” conducted by Postgraduate Program in Epidemiology at Universidade Federal de Pelotas.
The 1982 birth cohort study is currently supported by the Wellcome Trust initiative entitled Major Awards for Latin America on Health Consequences of Population Change. Previous phases of the study were supported by the International Development Research Center, The World Health Organization, Overseas Development Administration, European Union, National Support Program for Centers of Excellence (PRONEX), the Brazilian National Research Council (CNPq) and Brazilian Ministry of Health.
This article underwent the same peer review process as for other manuscripts submitted to this journal. Both authors and reviewers are guaranteed anonymity. Editors and reviewers declare that there are no confl icts of interest that could affect their judgment with respect to this article.