Fernando C BarrosI Denise P GiganteII Bernardo L HortaII Cesar G VictoraII
I Programa de Pós-Graduação em Saúde e Comportamento. Universidade Católica de Pelotas. Pelotas, RS, Brasil
II Programa de Pós-Graduação em Epidemiologia. Universidade Federal de Pelotas. Pelotas, RS, Brasil
Correspondence: Denise Petrucci Gigante Programa de Pós-Graduação em Epidemiologia – UFPEL R. Marechal Deodoro, 1160 96020-220 Pelotas, RS, Brasil E-mail: [email protected] Received: 10/10/2007
Revised: 10/3/2008 Approved: 10/11/2008
Education and work in the
Pelotas birth cohort from 1982
to 2004-5, Southern Brazil
ABSTRACT
OBJECTIVE: To analyze the infl uence of biological and socioeconomic factors throughout life on entry into the university and insertion in the work force of young adults from the 1982 birth cohort.
METHODS: Longitudinal study of 5,914 births that took place in the city of Pelotas, Southern Brazil, in 1982. Data was collected by means of questionnaires applied on young adults when accompanying the 1982 cohort in 2004-5. Information was gathered concerning educational level and insertion in the labor market. Poisson Regression was utilized to study the effect of demographic and socioeconomic variables, as well as birth weight and maternal breastfeeding, on the outcomes.
RESULTS: On the average, these young adults had 9.4 (± 3.1) years of schooling and 42% of them were attending school in 2004-5. One in fi ve young adults had entered a university and approximately two thirds were working during the month prior to the interview. Entry in the university was determined by economic conditions. Furthermore, women’s birth weight and breastfeeding among men infl uenced this outcome. Insertion in the labor market was more frequent among the poorer men, but this did not affect women’s outcomes in this respect.
CONCLUSIONS: The low inclusion in the university and the need to enter the labor market among the poor families maintains a vicious circle that reproduces the dominant social hierarchy.
DESCRIPTORS: Adult. Educational Status. Work. Employment. Cohort Studies. Brasil.
INTRODUCTION
The association between maternal education and infant health has been observed in practically all societies. Each additional year in maternal schooling is associ-ated to a 7 to 9% reduction in the mortality of children under fi ve years of age.4
It is postulated that the infl uence of maternal education on children’s health is mediated by multiple mechanisms, such as the patterns of reproductive health, the economic advantages associated with education – such as improvements in income, pipe water, sanitation, housing conditions – and the better use of preventive and curative health services.4
Besides maternal education, other early factors may also affect physical and mental development, such as the father’s schooling, family income during child-hood, changes in income throughout life, and biological factors, such as birth weight and breastfeeding duration.7,20 While some studies suggest the infl uence
of observational studies have not been able to confi rm the relation between breastfeeding and intelligence.3,10
On the other hand, recent results from a randomized trial show strong evidence that exclusive and prolonged breastfeeding has an infl uence on the cognitive capacity of children.12 According to Agostoni,1 there is biological
plausibility of the effects of long-chain fatty acids pres-ent in breast milk on the developmpres-ent of the brain.
Thus, the objective of this study was to analyze the infl uence of socioeconomic and early biological factors throughout life on entry into the university and inser-tion in the labor market among young people from the 1982 birth cohort.
METHODS
In 1982, the three maternities in Pelotas were visited and all liveborns whose mothers lived in the urban area of Pelotas were included in a cohort study. Details on the 1982 birth cohort are published in other articles.2,16,18
Information on years of schooling and insertion in the labor market among the young adults belonging to the 1982 birth cohort were obtained by means of inter-views in the most recent follow up, in 2004-5. Entry in the university and the labor market were considered dependent variables. Skin color was self-reported and followed the Instituto Brasileiro de Geografi a e Estatística’s (IBGE’s) [Brazilian Institute of Statistics and Geography’s] classifi cation, and was presented as a dichotomic variable (White and Black or Mixed). Parents’ schooling was classifi ed in four categories; family income was distributed in fi ve groups, organized according to the number of minimum wages obtained in 1982; and, changes in income during the period from 1982 to 2005 were also registered. Birth weight was classifi ed in the following categories: <2,500g, 2,500 to 2,999g; 3,000 to 3,499g; 3,500 to 3,999 g and ≥4,000g). Entry in the university was related to duration of breast-feeding for each member of the cohort, measured in the
fi rst follow ups, when these young people were on the average, aged two to four years old.
Poisson regression was used to study the effects of independent variables on the outcomes and adjusted analysis was carried out considering a hierarchical model. According to this model, the socioeconomic variables (including skin color, income and parents’ schooling) were considered as possible distal factors in the determination of the outcomes and included in the fi rst level of analysis. In order to evaluate the effect of socioeconomic status throughout life, the variable change in income was constructed, based on informa-tion concerning family income in 1982 and 2004-5. The variable change in income was not adjusted for income when born, because the latter was used in the construction of the former. Interviewees were
classi-fi ed in the following categories in the variable change
in income – always poor (those that belonged to the lowest third portion of the cohort in terms of family income both in 1982 and in 2004-5); poor → not poor (belonging to lowest third in terms of family income in 1982 and shifting to the middle third or the upper third in 2004-5); not poor → poor (those that shifted from the middle or upper third in 1982 to the lowest third in 2004-5); and never poor (those that remained in the middle or upper third in terms of family income in 1982 and 2004-5).
The effects of birth weight and breastfeeding on the outcomes were included respectively on the second and third levels of analysis. Birth weight was adjusted to the socioeconomic variables that presented an as-sociation (p<0.2) with the outcomes and the effect of breastfeeding duration on entry in the university was also adjusted to birth weight.
Verbal informed consent was obtained from the children’s guardians in the 1982-1986 phases of the study, as was common practice at the time, when an ethics committee did not exist in the Federal Univer-sity of Pelotas. In the more recent phases, the Ethics in Research Committee of the University, affi liated to the Conselho Nacional de Ética em Pesquisa (CONEP)
[National Council of Ethics in Research], approved the study and informed consent was obtained in written form from participants.
RESULTS
When interviews were conducted with the 4,297 members of the cohort in 2004-5, the average values were 22.8 years (± 0.4) of age and 9.4 years (± 3.1) of schooling, being that it was 9.0 years of schooling (± 3,1) for males and 9.8 years of schooling (± 3,1) for females. At the time of the interview, 42% of the young adults were attending school; three fourths of those that did not study, expressed an intention to go back to school.
Among 75% of the young adults who had completed eight years of schooling, 53% had already completed 11 years of schooling. Those who had entered the university represented 19% of the interviewees and 7% of the interviewees reported they were attending some technical course. This was either a course directed towards professionalization or a preparatory course for a competitive professional examination. Another 5% of the interviewees were going to university entrance examinations’ preparatory courses.
Table 1. Prevalence of entry into the university among young adults according to demographic and socioeconomic variables as well as birth weight and breastfeeding duration. Pelotas, Southern Brazil, 1982 to 2004-5.
Variable Men Women
n % n % N %
Skin color *,** p < 0.001*** p < 0.001*** p < 0.001***
White 3,238 23.3 1658 19.9 1580 26.9
Black or Mixed 908 6.6 471 4.7 437 8.7
Family income-1982** (MW) p < 0.001**** p < 0.001**** p < 0.001****
≤1 852 2.9 438 2.3 414 3.6
1.1 to 3 2126 10.1 1095 8.4 1031 11.8
3.1 to 6 800 30.6 417 23.3 383 38.6
6.1 to 10 252 55.6 130 48.5 122 63.1
> 10 244 81.6 123 76.4 121 86.8
Maternal schooling (yrs)** p < 0.001**** p < 0.001**** p < 0.001****
0 to 4 1,407 3.6 719 3.3 688 3.9
5 to 8 1,826 12.2 956 9.2 870 15.4
9 to 11 473 33.0 239 28.0 234 38.0
12 or more 584 67.8 295 60.0 289 75.8
Paternal schooling (yrs)***** p < 0.001**** p < 0.001**** p < 0.001****
0 to 4 1,032 5.6 523 4.4 509 6.9
5 to 8 1,695 12.2 862 9.3 833 15.2
9 to 11 460 32.4 240 25.0 220 40.5
12 or more 512 65.2 269 59.5 243 71.6
Change in income (1982 → 2004-5)** p < 0.001**** p < 0.001**** p < 0.001****
Always poor 708 1.4 335 2.1 373 0.8
Not poor→ poor 714 8.3 360 7.4 374 9.1
Poor → not poor 665 4.7 340 3.6 305 5.9
Never poor 2,209 32.8 1178 26.4 1031 40.2
Birth weight (g)** p = 0.001**** p < 0.001**** p < 0.001****
< 2500 301 15.0 136 12.5 165 17.0
2,500 to 2,999 1,021 13.0 451 11.3 570 14.4
3,000 to 3,499 1,634 20.0 849 15.7 785 24.6
3,500 to 3,999 1,098 24.6 612 20.4 486 29.8
≥ 4,000 241 21.2 165 18.2 76 27.6
Breastfeeding (months)** p < 0.001**** p < 0.001**** p < 0.001***
< 1.0 900 14.6 483 9.7 417 20.1
1.0 to 2.9 1,074 16.7 545 14.9 529 18.5
3.0 to 5.9 954 21.6 485 16.5 469 26.9
6.0 to 8.9 394 27.4 203 23.6 191 31.4
9.0 to 11.9 159 35.2 83 41.0 76 28.9
≥ 12.0 680 17.8 335 16.4 345 19.1
Total****** 4,296 19.2 2,213 16.1 2,083 22.5
MW: Minimum wages
* 150 interviewees classifi ed themselves as yellow or indigenous
** Among 4,297 interviewees in 2004-5 information was lacking for up to 23 people (0.5% of the interviewees). *** Chi-square test for heterogeneity
**** Chi-square test for linear tendency
***** For this variable alone information was lacking for 14% of the interviewees
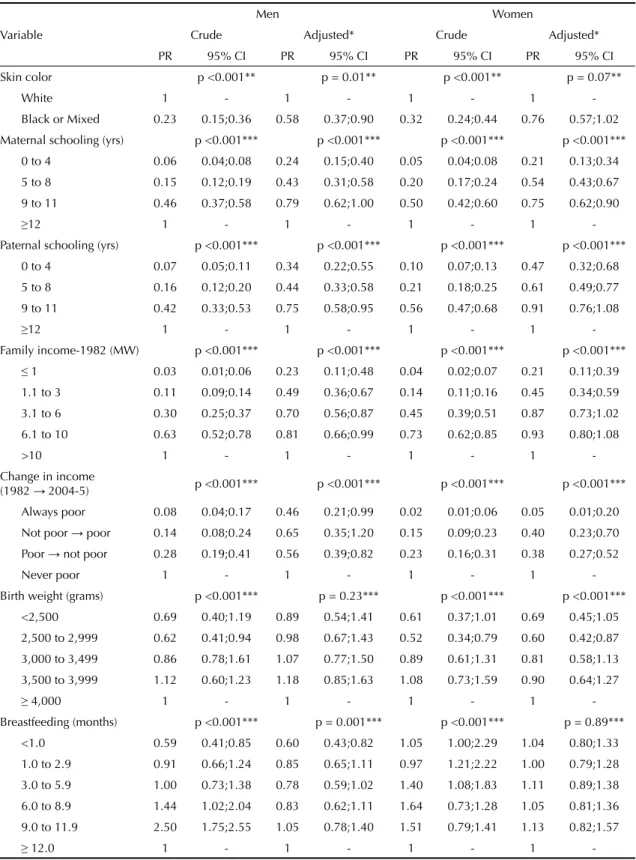
Table 2. Crude and adjusted analysis of the effects of independent variables on entry into the university. Pelotas, Southern Brazil, 1982 to 2004-5.
Variable
Men Women
Crude Adjusted* Crude Adjusted*
PR 95% CI PR 95% CI PR 95% CI PR 95% CI
Skin color p <0.001** p = 0.01** p <0.001** p = 0.07**
White 1 - 1 - 1 - 1
-Black or Mixed 0.23 0.15;0.36 0.58 0.37;0.90 0.32 0.24;0.44 0.76 0.57;1.02
Maternal schooling (yrs) p <0.001*** p <0.001*** p <0.001*** p <0.001***
0 to 4 0.06 0.04;0.08 0.24 0.15;0.40 0.05 0.04;0.08 0.21 0.13;0.34
5 to 8 0.15 0.12;0.19 0.43 0.31;0.58 0.20 0.17;0.24 0.54 0.43;0.67
9 to 11 0.46 0.37;0.58 0.79 0.62;1.00 0.50 0.42;0.60 0.75 0.62;0.90
≥12 1 - 1 - 1 - 1
-Paternal schooling (yrs) p <0.001*** p <0.001*** p <0.001*** p <0.001***
0 to 4 0.07 0.05;0.11 0.34 0.22;0.55 0.10 0.07;0.13 0.47 0.32;0.68
5 to 8 0.16 0.12;0.20 0.44 0.33;0.58 0.21 0.18;0.25 0.61 0.49;0.77
9 to 11 0.42 0.33;0.53 0.75 0.58;0.95 0.56 0.47;0.68 0.91 0.76;1.08
≥12 1 - 1 - 1 - 1
-Family income-1982 (MW) p <0.001*** p <0.001*** p <0.001*** p <0.001***
≤ 1 0.03 0.01;0.06 0.23 0.11;0.48 0.04 0.02;0.07 0.21 0.11;0.39
1.1 to 3 0.11 0.09;0.14 0.49 0.36;0.67 0.14 0.11;0.16 0.45 0.34;0.59
3.1 to 6 0.30 0.25;0.37 0.70 0.56;0.87 0.45 0.39;0.51 0.87 0.73;1.02
6.1 to 10 0.63 0.52;0.78 0.81 0.66;0.99 0.73 0.62;0.85 0.93 0.80;1.08
>10 1 - 1 - 1 - 1
-Change in income
(1982 →2004-5) p <0.001*** p <0.001*** p <0.001*** p <0.001***
Always poor 0.08 0.04;0.17 0.46 0.21;0.99 0.02 0.01;0.06 0.05 0.01;0.20
Not poor → poor 0.14 0.08;0.24 0.65 0.35;1.20 0.15 0.09;0.23 0.40 0.23;0.70
Poor → not poor 0.28 0.19;0.41 0.56 0.39;0.82 0.23 0.16;0.31 0.38 0.27;0.52
Never poor 1 - 1 - 1 - 1
-Birth weight (grams) p <0.001*** p = 0.23*** p <0.001*** p <0.001***
<2,500 0.69 0.40;1.19 0.89 0.54;1.41 0.61 0.37;1.01 0.69 0.45;1.05
2,500 to 2,999 0.62 0.41;0.94 0.98 0.67;1.43 0.52 0.34;0.79 0.60 0.42;0.87
3,000 to 3,499 0.86 0.78;1.61 1.07 0.77;1.50 0.89 0.61;1.31 0.81 0.58;1.13
3,500 to 3,999 1.12 0.60;1.23 1.18 0.85;1.63 1.08 0.73;1.59 0.90 0.64;1.27
≥ 4,000 1 - 1 - 1 - 1
-Breastfeeding (months) p <0.001*** p = 0.001*** p <0.001*** p = 0.89***
<1.0 0.59 0.41;0.85 0.60 0.43;0.82 1.05 1.00;2.29 1.04 0.80;1.33
1.0 to 2.9 0.91 0.66;1.24 0.85 0.65;1.11 0.97 1.21;2.22 1.00 0.79;1.28
3.0 to 5.9 1.00 0.73;1.38 0.78 0.59;1.02 1.40 1.08;1.83 1.11 0.89;1.38
6.0 to 8.9 1.44 1.02;2.04 0.83 0.62;1.11 1.64 0.73;1.28 1.05 0.81;1.36
9.0 to 11.9 2.50 1.75;2.55 1.05 0.78;1.40 1.51 0.79;1.41 1.13 0.82;1.57
≥ 12.0 1 - 1 - 1 - 1
-MW: Minimum wage
* The variables of the fi rst level (skin color, maternal schooling, paternal schooling and family income in 1982 were adjusted among themselves and maintained in the model of analysis if p<0.2. Change in income was adjusted for skin color. Birth weight was adjusted for skin color, maternal and paternal schooling and family income in 1982. Breastfeeding was adjusted for skin color, maternal schooling, family income and birth weight.
A direct association between entry into the university and socioeconomic conditions was observed, being evaluated in terms of parents’ schooling, family income and changes in family income during the period from 1982 to 2004-5. Differences in the prevalences of entry in the university were observed between the extreme categories of the socioeconomic variables. Entry in the university also differed according to birth weight
and duration of breastfeeding among interviewees: the prevalence of entry in the university was higher among those who weighed 3,000g or more when they were born, or who were breastfed for six to 11 months.
The results of Poisson Regression analysis are presented in Table 2. In order to maintain consistency with all other articles of the Supplement, the reference group
Table 3. Prevalence of labor during the previous month among young adults according to demographic and socioeconomic variables as well as birth weight. Pelotas, Southern Brazil, 1982 to 2004-5.
Variable Men Women
n % n % n %
Skin color*,** p = 0.30*** p = 0.35*** p = 0.57***
White 3238 64.6 1658 76.8 1580 51.8
Black or Mixed 908 64.3 555 78.7 503 50.3
Family income-1982 (MW)** p <0.001*** p <0.001**** p = 0.001***
≤ 1 852 61.2 438 77.4 414 44.0
1.1 to 3 2126 67.9 1095 81.2 1031 53.7
3.1 to 6 800 66.5 417 76.0 383 56.1
6.1 to 10 252 60.3 130 70.0 122 50.0
>10 244 49.2 123 54.5 121 43.8
Maternal schooling (yrs)** p <0.00*** p <0.001**** p = 0.001***
0 to 4 1407 63.5 719 80.0 688 46.2
5 to 8 1826 68.3 956 79.8 870 55.7
9 to 11 473 63.6 239 72.8 234 54.3
≥12 584 57.2 295 65.8 289 48.4
Paternal schooling (yrs)***** p <0.001*** p <0.001**** p = 0.23***
0 to 4 1032 64.9 523 80.3 509 49.1
5 to 8 1695 67.1 862 79.9 833 53.8
9 to 11 460 64.8 240 76.7 220 51.8
≥12 512 55.9 269 63.2 243 47.7
Change in income (1982 → 2004-5)** p <0.001**** p <0.00*** p <0.001****
Always poor 708 51.1 335 72.2 373 32.2
Not poor → poor 714 54.6 340 72.9 374 38.0
Poor → not poor 665 75.8 360 85.3 305 64.6
Never poor 2209 69.1 1178 77.5 1031 59.5
Birth weight (g)** p = 0.001**** p = 0.14*** p = 0.05****
<2,500 301 57.5 136 69.9 165 47.3
2,500 to 2999 1021 63.0 451 79.2 570 50.2
3,000 to 3,499 1634 65.5 849 78.7 785 51.2
3,500 to 3,999 1098 65.8 612 75.8 486 52.3
≥ 4,000 241 71.4 165 76.4 76 60.5
Total****** 4296 64.8 2213 77.3 2083 51.5
MW: Minimum wage
* 150 interviewees classifi ed themselves as Yellow or Indigenous
** Among 4,297 interviewees in 2004-5, information was lacking for up to 23 people (0.5% of the interviewees). *** Chi-square test for heterogeneity
**** Chi-square test for linear tendency
is that which has the best prognosis, which results in prevalence ratios inferior to the unity. The majority of the effects observed in the crude analysis were main-tained in the adjusted analyses, except for the variables skin color and breastfeeding among women and birth weight among men. When the variables were analyzed together, the effects decreased. Maternal schooling was more associated to women’s schooling than to men’s (p for interaction <0.001) and paternal schooling had an inverse effect (p for interaction =0.001).
Entry into the university among men who were never poor was twice as high as among those that were poor during the period between 1982 and 2004-5. As to the women, this difference was twenty times greater. The interaction between sex and changes in income was signifi cant (p<0.001). When the socioeconomic vari-ables were controlled in the analysis, birth weight had no effect on entry into the university among the men, but direct association was observed among the women. On the other hand, while the effect of breastfeeding was not observed on women in the adjusted analysis, entry into the university was less frequent among men who had been weaned earlier.
The second outcome analyzed was entry into the labor market. Approximately two thirds of the inter-viewees (2,782/4,297, or 64.8%) were working the month before the interview. Among those that were not working, 742 (49%) stated they were looking for jobs. The main reasons given for not working included studying, pregnancy or taking care of children. More men than women were working – respectively, 77.2% and 51.5%. There was also a greater proportion of men than women currently looking for a job – 55.1% and 46.0%, respectively.
Prevalences of work according to demographic and socioeconomic variables are presented in Table 3, with no differences as to skin color. Among the men, entry in the labor market was inversely proportional to
family income in 1982 and to parents’ schooling. The proportion of women who had entered the labor market also varied according to family income and maternal schooling, however, this association was not linear, be-ing higher among the intermediate groups. Labor was more frequent among men and women in the group whose economic status had become better in the period between 1982 and 2004-5, which may be partially or totally explained by their own contribution to current family income. There was also a direct association with birth weight among the women, although this did not occur among the men.
In the adjusted model (Table 4), the inverse associations between work and paternal schooling for men remained signifi cant. After adjusting for parents’ schooling, no association with family income in 1982 was observed; however there was a greater proportion of young adult men working in the group whose family income varied from 1.1 to 6.0 minimum wages per month. In terms of the groups of change in income, entry in the labor market was lower among those men who were
classi-fi ed as poor in 2004-5, independently of their economic situation when they were born. Birth weight was not associated to the proportion of men working.
No association was observed among the women between entry in the labor market and skin color, parents’ schooling or family income. However, in the same manner as occurred among the men, the chance of working decreased among women classifi ed in the lowest income group in 2004-5, whether or not they were poor in 1982. Nevertheless, women’s entry in the labor market was directly proportional to their birth weight. This result maintained itself within the threshold of signifi cance (p=0.04), even when adjusted for socioeconomic variables.
Analysis of the association between family income in 1982 and women’s labor repeated itself after exclud-ing those women who had already had children, since the higher frequency of maternity among the poorest women could stop them from participating in the labor market. However, the results were not affected substan-tially by this restriction, since the highest rates of work among women were found throughout the study among those who were in the intermediate income categories when they were born.
Considering only those young adults that were working the month before the interview, the average income reported was R$ 488.00, varying in a manner that was directly proportional to family income in 1982 (Figure). The two last categories of income were grouped together by the smallest number of people classifi ed in each of the last two groups. Thus, among the young adults who belonged to the poorest families in 1982 – whose family income amounted less than one minimum salary – the average income earned was 0
100 200 300 400 500 600 700 800 R$
Up to 1 MW 1.1 to 3 MW 3.1 to 6 MW >6MW
Total Men Women
R$ 386.00. Analyzing data according to sex, the aver-age value received by the poorest men was R$ 426.00 and among the women it was R$ 314.00. In the group with the highest income, the average salary of the young adults was R$ 682.00 and, although the absolute difference between men (R$ 744.00) and women (R$ 597.00) was greater, the relative difference was greater among the poorest group.
DISCUSSION
The average level of education found in this study was 9.4 years of schooling, being higher than the average found in 199814 for the Brazilian population aged 15
years and over (5.9 years of schooling). Data from the
Pesquisa Nacional por Amostra de Domicílio (PNAD)
[National Survey by Household Sample) form the year 2002 shows an average schooling of 6.2 years for the Table 4. Crude and adjusted analysis of the effects of independent variables on labor in the previous month. Pelotas, Southern Brazil, 1982 a 2004-5.
Variable
Men Women
Crude Adjusted* Crude Adjusted*
PR 95% CI PR 95% CI PR 95% CI PR 95% CI
Skin color p = 0.74** p = 0.70** p = 0.55** p = 0.84**
White 1 - 1 - 1 - 1
-Black or Mixed 1.01 0.95;1.07 0.99 0.93;1.05 0.97 0.87;1.07 0.99 0.88;1.11
Maternal schooling (yrs) p<0.001*** p = 0.07*** p = 0.27*** p = 0.12***
0 to 4 1.22 1.11;1.33 1.07 0.95;1.20 0.95 0.83;1.10 0.91 0.74;1.11
5 to 8 1.21 1.11;1.33 1.04 0.94;1.17 1.15 1.01;1.31 1.05 0.88;1.25
9 to 11 1.11 0.99;1.24 0.98 0.86;1.11 1.12 0.95;1.32 1.01 0.84;1.23
≥12 1 - 1 - 1 - 1
-Paternal schooling (yrs) p<0.001*** p = 0.04*** p = 0.80*** p = 0.26***
0 to 4 1.27 1.15;1.41 1.13 1.01;1.27 1.03 0.88;1.21 1.09 0.89;1.33
5 to 8 1.26 1.15;1.39 1.14 1.03;1.27 1.13 0.97;1.30 1.11 0.93;1.33
9 to 11 1.21 1.08;1.36 1.12 1.00;1.26 1.09 0.90;1.30 1.05 0.86;1.28
≥12 1 - 1 - 1 - 1
-Family income-1982 (MW) p<0.001*** p = 0.06** p = 0.003** p = 0.09**
≤ 1 1.42 1.20;1.68 1.22 0.99;1.49 1.00 0.80;1.26 1.00 0.74;1.35
1.1 to 3 1.49 1.26;1.76 1.29 1.06;1.57 1.23 0.99;1.51 1.18 0.89;1.55
3.1 to 6 1.40 1.18;1.65 1.26 1.04;1.53 1.28 1.03;1.60 1.22 0.93;1.59
6.1 to10 1.29 1.06;1.56 1.22 1.00;1.50 1.14 0.87;1.49 1.15 0.86;1.55
>10 1 - 1 - 1 - 1
-Change in income (1982→2004-5) p<0.001*** p = 0.001*** p = 0.74*** p<0.001***
Always poor 0.64 0.46;0.73 0.85 0.78;0.92 0.93 0.87;1.00 0.50 0.43;0.60
Not poor → poor 0.54 0.46;0.63 0.88 0.81;0.95 0.94 0.88;1.01 0.62 0.54;0.71
Poor → not poor 1.09 0.99;1.20 0.99 0.93;1.06 1.10 1.04;1.16 1.02 0.91;1.14
Never poor 1 - 1 - 1 - 1
-Birth weight (grams) p = 0.99*** p = 0.52*** p = 0.05*** p = 0.07***
<2,500 0.91 0.80;1.05 0.91 0.79;1.05 0.78 0.61;1.00 0.78 0.61;1.00
2,500 to 2,999 1.04 0.94;1.14 1.01 0.91;1.12 0.83 0.68;1.01 0.83 0.68;1.02
3,000 to 3,499 1.03 0.94;1.13 1.00 0.91;1.10 0.85 0.70;1.03 0.86 0.70;1.03
3,500 to 3,999 0.99 0.90;1.09 1.00 0.90;1.10 0.88 0.72;1.08 0.88 0.72;1.07
≥ 4,000 1 - 1 - 1 - 1
-MW: Minimum wage
* The variables of the fi rst level (skin color, maternal schooling, paternal schooling and family income in 82) were adjusted among themselves and maintained in the model of analysis if p<0.2. Change in income was adjusted for skin color. Birth weight was adjusted for skin color, maternal and paternal schooling and family income in 1982. Breastfeeding was adjusted for skin color, maternal schooling, family income and birth weight.
Brazilian population aged ten years and older as a whole and, an average of 6.7 years of schooling when considering the State of Rio Grande do Sul alone.a
As to the socioeconomic variables, social inequities with respect to entry into the university were evident. Furthermore, it was observed that, even when adjusted by socioeconomic factors, the inclusion of young adults of both sexes with black skin color was lower than their white counterparts. The reduction of this effect in adjusted analysis suggests that the lower rate of entry of young adults with black skin color in the university may be partially explained by socioeconomic factors, since black or mixed families tend to be poorer and to have less schooling than the white families. However, the possibility of residual confounding due to socioeco-nomic factors not included or Inadequately accounted for in the analysis exists. On the other hand, it is pos-sible that these results are due in part to characteristics of the current educational system.5,6 Our fi ndings with
respect to the lower rate of entry of blacks in the univer-sity, irrespective of their socioeconomic status, remits us to the issue of racial quotas, adopted currently by many Brazilian universities. Although approximately 30% of the Brazilian students aged 18 to 24 years are in the universities, these proportions vary with respect to skin color from 46% among White and 14% among Black or Mixed young adults.a This difference may
also be partially explained by the elevated proportion of Black or Mixed skin colored students aged 18 to 24 years old that are still studying in elementary or junior high school, since the lower entry of these in the uni-versity is not due only to the delay in terminating the previous stages of formal schooling.a
The results according to which young adults belong-ing to families with higher incomes and more years of schooling have higher rates of entry into the university reinforce the concepts of economic and cultural capital.b
The latter proposes that the greater the economic capital of the families, the greater will be their demand for their children’s education. At the same time, the educational resources of the family or cultural capital – measured in terms of their parents schooling – produce what is denominated an “educational climate”, which favors the education of their children. b
The United Nations Development Millennium Goals for the year 2015, stipulate that all children should complete junior high school.b Acknowledging the
importance of education for improving the quality of life, it is disquieting that a middle sized city, in a
state considered by UNESCO as the one with the best educational indicators in Brazil,c one in four young
adults aged 23 years old has not completed junior high school, considered the basic educational cycle in the school system. The fact that performance on the part of young adults belonging to socially underprivileged families is worse is even more concerning.
Associations between birth weight, cognitive function and academic performance were also found in other birth cohorts, such as the classic study of English chil-dren born in 1946 and accompanied until they were adults.13 These fi ndings show the importance of
prevent-ing situations that increase the risk of beprevent-ing born with insuffi cient weight. Among the well-known risk factors are cigarette smoking during pregnancy and infections, particularly those of the urinary tract.11,15
The current fi nding of a direct association between breastfeeding duration and entry into the university is in keeping with previous results from this same cohort, when subjects were 18 years old. At that time, the out-come used was the total number of years of schooling completed by the adolescents.17 In both analyses, the
results were observed for men after controlling for a series of confounding factors. In the present study, an association was observed for women, in the crude analysis, which disappeared after adjustment for con-founding factors. The reasons for the differences in results for males and females are not clear. A recent meta-analysis suggests breastfeeding has a benefi cial effect on intellectual performance,7 but another
revi-sion9 contests that this is a causal effect.
As to entry of young adults in the labor market, although women had more schooling than men, they received lower salaries in the labor market, regardless of the socioeconomic status of their families.
The results of the current study, as well as those present-ed in this Supplement, indicate a path through which maintenance of the present social structure and poverty is established in the city of Pelotas. Even though the demand for a job in the labor market is greater among young adults from the lower classes, the latter tend to obtain less qualifi ed work and lower income, since one of the major determinants of the type of work, and, consequently, of income, is the professional qualifi ca-tion that results from schooling. Since the major reason alleged for not studying is, precisely, the need to work, a vicious cycle is created that leads to the reproduction of the dominant social hierarchy.
a Instituto Brasileiro de Geografi a e Estatística. Síntese dos Indicadores Sociais – 2004. Rio de Janeiro; 2005
b Ireland VE, Charlot B, Gomes C, Gusso D, De Carvalho LCR, Fernandes M, et al. Repensando a escola: um estudo sobre desafi os de aprender, ler e escrever. Brasília: UNESCO/MEC/INEP; 2007
1. Agostoni C. Breast-feeding, human milk, long-chain
polyunsaturated fatty acids and development. Dev
Med Child Neurol Suppl. 2001;86:8-9.
2. Barros FC, Victora CG, Horta BL, Gigante DP. Metodologia do estudo da coorte de nascimentos
de 1982 a 2004-5, Pelotas, RS. Rev Saude Publica.
2008;42(Supl 2):7-15.
3. Cleland JG, Van Ginneken JK. Maternal education and child survival in developing countries: the
search for pathways of infl uence. Soc Sci Med.
1988;27(12):1357-68. DOI: 10.1016/0277-9536(88)90201-8
4. Der G, Batty GD, Deary IJ. Effect of breast feeding on intelligence in children: prospective study, sibling pairs
analysis, and meta-analysis. BMJ. 2006;333(7575):945.
DOI: 10.1136/bmj.38978.699583.55
5. Duarte da Silva CA, Barros FC, Halpern S, Duarte da Silva, LA. De como a escola participa da exclusão social: trajetória de reprovação das crianças negras. In: Abramowicz A, Moll J, organizadores. Para além do
fracasso escolar. Campinas: Papirus; 1997. p.27-46.
6. Duarte da Silva CA, Barros FC, Halpern S, Duarte da Silva LA. Meninas bem-comportadas, boas alunas;
meninos inteligentes, indisciplinados. Cad Pesqui.
1999;(107):207-25.
7. Horta BL, Bahl, Martines JC, Victora CG. Evidence on the long-term effects of breastfeeding-Systematic reviews and meta-analyses. Geneva: WHO; 2007.
8. Emond AM, Blair PS, Emmett PM, Drewett RF. Weight faltering in infancy and IQ levels at 8 years in the Avon longitudinal study of parents and children.
Pediatrics. 2007;120(4):e1051-8. DOI: 10.1542/
peds.2006-2295
9. Ip S, Chung M, Raman G, Chew P, Magula N, DeVine D, et al. Breastfeeding and maternal and infant health outcomes in developed countries. Evidence report/ technology assessment no. 153. Rockville: Agency for Healthcare Research and Quality; 2007.
10. Jain A, Concato J, Leventhal JM. How good is the evidence linking breastfeeding and intelligence?
Pediatrics. 2002;109(6):1044-53. DOI: 10.1542/
peds.109.6.1044
11. Kramer MS. Determinants of low birth weight:
methodological Assessment and meta-analysis. Bull
World Health Organ. 1987;65(5):663-737.
12. Kramer MS, Aboud F, Mironova E, Vanilovich I, Platt RW, Matush L, et al. Breastfeeding and child cognitive development: new evidence from a large randomized
trial. Arch Gen Psychiatry. 2008;65(5):578-84. DOI:
10.1001/archpsyc.65.5.578
13. Richards M, Hardy R, Kuh D, Wadsworth MEJ. Birth weight and cognitive function in the British 1946 birth cohort: longitudinal population based
study. BMJ. 2001;322(7280):199-203DOI: 10.1136/
bmj.322.7280.199
14. Silva NV, Hasenbalg C. Tendências da desigualdade
educacional no Brasil. Dados. 2000;43:423-45. DOI:
10.1590/S0011-52582000000300001.
15. Victora CG, Smith PG, Vaughan JP, Nobre LC, Lombardi C, Teixeira AM, et al. Infl uence of birth weight on mortality from infectious diseases: a
case-control study. Pediatrics. 1988;81(6):807-11.
16. Victora CG, Barros FC, Lima RC, Behague DP, Gonçalves H, Horta BL, et al. The Pelotas birth cohort
study, Rio Grande do Sul, Brazil, 1982-2001. Cad
Saude Publica. 2003;19(5):1241-56. DOI: 10.1590/
S0102-311X2003000500003
17. Victora CG, Barros FC, Horta BL, Lima RC. Breastfeeding and school achievement in Brazilian
adolescents. Acta Paediatr. 2005;94 (11):1656-60.
DOI: 10.1080/08035250500252658
18. Victora CG, Barros FC. Cohort profi le: the 1982
Pelotas (Brazil) birth cohort study. Int J Epidemiol.
2006;35(2):237-42. DOI: 10.1093/ije/dyi290
19. Victora CG, Adair L, Fall C, Hallal PC, Martorell R, Richter L, et al. Maternal and child undernutrition: consequences for adult health and human capital.
Lancet. 2008;371(9609):340-57. DOI:
10.1016/S0140-6736(07)61692-4
20. Walker SP, Wachs TD, Gardner JM, Lozoff B,
Wasserman GA, Pollitt E, et al. Child development: risk factors for adverse outcomes in developing countries.
Lancet. 2007;369(9556):145-57. DOI:
10.1016/S0140-6736(07)60076-2
REFERENCES
This article is based on data from the study “Pelotas birth cohort, 1982” conducted by Postgraduate Program in Epidemiology at Universidade Federal de Pelotas.
The 1982 birth cohort study is currently supported by the Wellcome Trust initiative entitled Major Awards for Latin America on Health Consequences of Population Change. Previous phases of the study were supported by the International Development Research Center, The World Health Organization, Overseas Development Administration, European Union, National Support Program for Centers of Excellence (PRONEX), the Brazilian National Research Council (CNPq) and Brazilian Ministry of Health.
This article underwent the same peer review process as for other manuscripts submitted to this journal. Both authors and reviewers are guaranteed anonymity. Editors and reviewers declare that there are no confl icts of interest that could affect their judgment with respect to this article.