Bruno GalliI
Francisco Chiaravalloti NetoII
I Faculdade de Medicina de São José do Rio Preto. São José do Rio Preto, SP, Brasil II Superintendência de Controle de Endemias.
Secretaria de Estado da Saúde de São Paulo. São José do Rio Preto, SP, Brasil
Correspondence: Francisco Chiaravalloti Neto Laboratório de Vetores Av. Brigadeiro Faria Lima, 5416
15090-000 São José do Rio Preto, SP, Brasil E-mail: [email protected]
Received: 5/2/2007 Reviewed: 9/17/2007 Approved: 10/31/2007
Temporal-spatial risk model to
identify areas at high-risk for
occurrence of dengue fever
ABSTRACT
OBJECTIVE: To apply the temporal-spatial model to assess high-risk areas for the occurrence of dengue fever.
METHODS: A total of 11,989 confi rmed, autochthonous dengue fever cases, geocoded by address in the city of São José do Rio Preto (Southeastern Brazil), between September of 2001 and August of 2006, were included in the study. Frequency, duration and intensity indices were used to assess the severity and magnitude of transmission. The local indicator of spatial association was adopted to identify signifi cant spatial clusters (p-value<0.05). The values of the three indices were considered high in a spatial unit when their standard values were positive and the respective local indicator of spatial association values were signifi cant.
RESULTS: Of all the geocoded dengue fever cases, 38.1% occurred in the urban spatial units, classifi ed as highest-risk: 19.4% in 2001-2002, 13.9% in 2002-2003, 2.8% in 2003-2004, 16.7% in 2004-2005, and 21.3% in 2005-2006. The utilization of three risk measures enabled to identify higher-risk areas for the occurrence of dengue fever, concentrated in the city’s northern region. Even though case notifi cation data are subject to bias, this information is available in the health services and can lead to important conclusions, recommendations and hypotheses.
CONCLUSIONS: The non-complex, notifi cation-based procedures adopted in the study could be routinely used by services that are responsible for dengue fever surveillance and control to identify high-risk areas.
DESCRIPTORS: Dengue, epidemiology. Risk Factors. Geographic Information Systems, utilization. Epidemiologic Models.
INTRODUCTION
Nowadays, dengue fever is considered the most important viral disease trans-mitted by mosquitoes in the world, which incidence has increased 30 times in the last 50 years. It is estimated that 2.5 billion people are at risk in more than 100 endemic countries; more than 50 million infections occur annually with 500,000 cases of dengue hemorrhagic fever and 22,000 deaths, especially among children.a
The reasons for the global reappearance of dengue epidemics are not fully understood, but they are related to demographic and social changes, including the increase in population fl ow.12 Growth in population, rural-urban migration,
inadequate basic urban infrastructure and exponential growth in consumerism are responsible for the condi-tions that favor the transmission of dengue fever.14
In Brazil, the endemic level of dengue fever has already changed morbidity indicators, and the magnitude of these incidences in the last years has surpassed the inci-dences of all other diseases of compulsory notifi cation.9 This country was responsible for 85% of notifi ed dengue fever cases in South and Central America, in 2006.a
According to Tran et al (2004),10 as there is no vaccine or specifi c treatment available for dengue fever, the only way to prevent the disease is to apply vector control strat-egies that require the identifi cation of high-risk areas and periods. The heterogeneity of dengue fever incidence observed in time and space refl ects the complexity of risk factors involved in the disease transmission.11 Dynamic models of dengue fever may help to understand, on a local scale, the infl uences of different parameters, and, on a larger scale, the emergency mechanisms.4
The utilization of geographic information systems (GIS) has currently facilitated mapping of disease cases. In the manner they have been employed, GISs have provided visual display of their occurrence ex-clusively. Nonetheless, they could be useful to confi rm the existence of case clusters and spatial correlation. In addition, Wen et al (2006)13 state that the exclusive utilization of incidence rates to assess the occurrence of diseases provide limited results, and thus propose a tem-poral-spatial risk model to map geographic distribution of cases. This model is based on three risk measures in the geographic space – frequency, duration and inten-sity, and was applied in Taiwan in 2002, where it was considered adequate to identify high-risk areas.
Following the example of the model proposed by Wen et al (2006),13 the present study aimed to apply the temporal-spatial model to assess high-risk areas for the occurrence of dengue fever.
METHODS
The city of São José do Rio Preto is located in South-eastern Brazil. The estimated population in 2006 was 415,509 inhabitants.
Confi rmed, autochthonous dengue fever cases reg-istered by the Sistema de Informação de Agravos de Notifi cação (SINAN – Information System on Notifi -able Diseases), in the period between September of 2001 and August of 2006, according to the date when symptoms began. In the period between September of 2001 and March of 2006, the criterion for confi rma-tion of cases was the lab test, whereas, in the period between April and August of 2006, the criterion was clinical-epidemiological in nature.
a Pan American Health Organization. Number of reported cases of dengue & dengue hemorrhagic fever (DHF), Region of the Americas (by country and subregion). 2006 [cited 2007 Mar 1]. Available from: http://www.paho.org/English/AD/DPC/CD/dengue-cases-2006.htm
The geocoding process was obtained by combining ad-dresses where there had been dengue fever cases with a map of street segments provided by São José do Rio Preto’s municipal government, by using the software ArcGIS 9.1.3 This process began with the automatic address analysis and standardization. The analysis was performed by dividing addresses into two parts contain-ing the street name and the home number, whereas stan-dardization modifi ed these components when necessary to meet the Brazilian addressing system criteria. Finally, geocoding was obtained through linear interpolation of the address number with a point in the corresponding street segment, located between two points that defi ne that street segment’s number range.15
The study involved 108 spatial units (with an area of coverage between 0.083 and 4.37 km2), created from the cluster of census tracts in the urban area. A total of four tracts were used to create each unit, and geographic de-limitations, such as rivers and highways, were respected whenever possible. Furthermore, the study tried to keep the similarity in each unit’s geometric form.
Temporal units were obtained from the date when symptoms began, and cases were thus classifi ed ac-cording to the seasonal year (from September of a year to August of the following year) and epidemiological week (SINAN). These months were selected because they usually show the lowest incidences in relation to the other months of the year.5
To assess the risk transmission severity and magnitude, three temporal risk indices were adopted,13 calculated for each spatial unit and seasonal year:
• Frequency index (α), defi ned as ST SE
α= , where ST is the total number of weeks during the period in question, and SE is the total number of weeks with one or more cases occurring during the period in question. It represents the proportion of weeks with one or more cases or the probability that one or more cases occur in a given week, in the period studied (one year or 52 weeks).
• Duration index ( ), defi ned as OE SE
β= , where SE is described above and OE is the total number of epidemic waves during the period in question. One epidemic wave, according to Wen et al (2006),13 is defi ned as a sequence of weeks with the occurrence of uninterrupted cases. This index gives an idea of the persistence of transmission and represents the average duration, in weeks, of epidemic waves that occurred in the given period.
• Intensity index ( ), defi ned as OE
TI
is described above. It assesses the severity of trans-mission, and is based on sequences of weeks with the occurrence of uninterrupted cases. High values mean time-concentrated transmission.
The local indicator of spatial association (LISA)1 was adopted as the index to identify signifi cant spatial clus-ters. The defi nition of the LISA index is given by:
Xi – X
δ Xj – Xδ
I(i) = .
∑
Wij. nj=1
where I(i) is the i
region’s LISA, Wij is the proximity of the i region to the j region, Xi is the i region’s temporal index value, Xj is the jregion’s temporal index value, X is the tem-poral index’s mean value, δ is Xi’s standard deviation and n is the total number of assessed regions. The term Wij describes the proximity of the i region to the j region. If the i region is adjacent to the j region, the value 1 is attributed; otherwise, the value 0 is attributed.
High positive LISA values indicate that the values of the adjacent features are similar to that feature (whether they are high or low). Negative values of a feature indicate that it is surrounded by features with distinct values, that is, it has a high value in relation to a low-value neighbor, or a low value in relation to a high-value neighbor. The LISA values were considered statistically signifi cant when p<0.05.
For each temporal risk index (frequency, duration and intensity) obtained in each spatial unit and seasonal year, the standard value (difference in relation to the mean, divided by standard deviation) and the LISA were calculated. The values for each one of these indices were considered high, when their standard values were positive and the respective LISA values were signifi cant.
Each spatial unit was subsequently classifi ed into one of the eight categories created for all possible combi-nations of the three temporal indices, seven of which (A to G) were considered higher-risk, whereas the H category was considered lower-risk. The combina-tions of high-risk areas were the following: type A, with high values of frequency, duration and intensity indices; type B, with high values of frequency and duration indices; type C, with high values of the fre-quency index; type D, with high values of duration and intensity indices; type E, with high values of the intensity index; type F, with high values of frequency and intensity indices; type G, with high values of the duration index; and type H, which does not show high values in any of the indices.
Thematic maps were created, by means of the ArcGIS 9.1 software,3 showing high-risk areas, according to the A-H classifi cation. For each index and seasonal year, the Moran indices1 were calculated, as they are global measures of spatial correlation. Values with p<0.05 were considered signifi cant.
RESULTS
Of all the 14,697 autochthonous cases recorded by the SINAN in the period studied, 470 of these were located outside the coverage area of the urban census tracts and were thus excluded from the geocoding process. Of the remaining 14,226 cases, 11,989 (84.3%) were geocoded and 2,237 (15.7%) were not geocoded. The impossibil-ity of geocoding these cases was due, above all, to the absence or lack of data in the SINAN database.
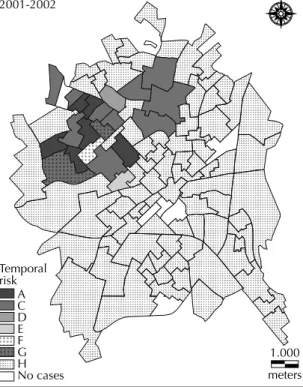
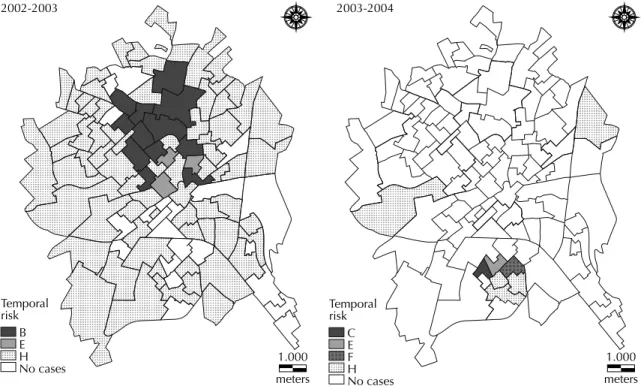
On the Table are shown the spatial unit classifi cations according to risk and values of Moran indices for the three temporal risk measures. In the 2001-2002 seasonal year, 74.1% of the units were classifi ed as type H, in which all the three indices showed low values. A total of 17 units (15.7%) were identifi ed with high values of the frequency index, nine (8.3%) for the duration index, and nine (8.3%) for the intensity index. In the 2002-2003 seasonal year, 68.6% of the units were classifi ed as type H. High values of the frequency index were identifi ed in 12 units (11.1%), 12 (11.1%) for the duration index, and three (2.8%) for the intensity index.
The 2003-2004 seasonal year showed the highest num-ber of units without dengue fever cases (92.6%). This was also the year when there was the lowest incidence of dengue fever, with 41 recorded cases. Only two units (1.9%) showed high values of the frequency index, and two (1.9%) for the intensity index.
Figure 1. Spatial units according to risk classifi cation for the occurrence of dengue fever. City of São José do Rio Preto, Southeastern Brazil, September of 2001 to August of 2002. 2001-2002
Temporal risk
A C D E F G H No cases
1.000
Table. Spatial units according to risk classifi cation for the occurrence of dengue fever, frequency, duration and intensity indices. City of São José do Rio Preto, Southeastern Brazil, from 2001 to 2006.
Year Risk
classifi cation
Temporal risk
Number of spatial units
Population density (inhabitants
per km2)
Dengue fever cases
Frequency index, α Duration index, β Intensity index, γ
(mean values) (mean values) (mean values)
2001-2002
A 5.433 5.727 4.743 6 7,567 160
C 3.743 0.612 0.291 10 4,733 175
D 0.663 3.946 6.553 1 5,823 20
E 1.745 0.602 2.121 1 7,777 35
F 9.475 0.000 8.140 1 7,344 27
G 1.706 3.025 0.645 2 4,004 19
H 0.679 0.345 0.283 80 3,776 472
No cases 0 0 0 7 6,175 0
Global total 1.464 0.869 0.716 108 4,134 908
Moran index 0.091 (p=0.0000) 0.062 (p=0.0000) 0.037 (p=0.0000)
2002-2003
B 3.425 3.425 0.298 12 4,704 98
E 0.356 0.356 5.765 3 7,219 44
H 0.418 0.418 0.188 74 4,075 267
No cases 0 0 0 19 4,313 0
Global total 0.859 0.859 0.372 108 4,217 409
Moran Index 0.096 (p=0.0000) 0.096 (p=0.0000) 0.095 (p=0.0000)
2003-2004
C 7.064 0.000 0.000 1 10,545 5
E 0.000 0.000 9.327 1 10,158 2
F 4.139 0.000 6.126 1 8,537 1
H 0.000 0.000 0.000 5 2,525 33
No cases 0 0 0 100 4,492 0
Global total 0.358 0.311 0.410 108 4,392 41
Moran Index 0.098 (p=0.0000) 0.096 (p=0.0000) 0.089 (p=0.0000)
2004-2005
A 6.708 4.833 4.174 5 6,361 64
B 5.038 4.044 1.021 2 4,439 17
C 3.650 1.169 0.442 7 4,404 35
D 0.754 5.204 3.152 2 8,713 13
G 1.449 3.796 1.301 2 3,000 10
H 0.266 0.461 0.212 48 4,443 101
No cases 0 0 0 42 4,441 0
Global total 1.210 1.388 0.624 108 4,488 240
Moran Index 0.079 (p=0.0000) 0.070 (p=0.0000) 0.033 (p=0.0000)
2005-2006
A 4.071 2.779 5.705 1 11,425 207
B 6.087 4.389 0.619 4 6,687 535
C 3.308 0.425 0.502 9 4,220 1,346
E 0.669 0.926 2.863 3 8,300 597
F 3.509 1.239 3.077 5 6,025 973
G 1.918 6.810 0.000 1 8,126 179
H 1.629 0.624 0.996 85 4,326 6,554
Global total 2.020 0.861 1.124 108 4,584 10,391
Moran Index 0.143 (p=0.0000) 0.040 (p=0.0000) 0.082 (p=0.0000)
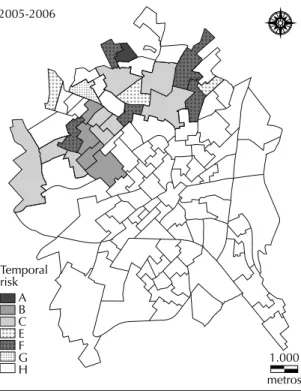
In the 2004-2005 seasonal year, 44.4% of the units were classifi ed as type H. The following were identifi ed as high values: 14 units (13.0%) for the frequency index, 11 (10.2%) for the duration index, and 7 (6.5%) for the intensity index. The 2005-2006 seasonal year was the one that showed highest dengue fever incidence, with a total of 10,391 cases. In addition, it was the year when all spatial units showed cases. Of all the tracts, 78.7% were classifi ed as type H. A total of 19 units were identifi ed with high values (17.6%) for the frequency index, six (5.6%) for the duration index, and nine (8.3%) for the intensity index.
Figures 1 to 4 show thematic maps with the spatial units characterized as high-risk areas for the fi ve sea-sonal years analyzed, that is, classifi ed from A to G. In 2001-2002, all of them (21 out of 108) were located in the city’s northern region. In 2002-2003, units clas-sifi ed as type B (12) and E (3) were identifi ed, which, as equally observed in the previous year, are located in the northern region.
Unlike what was observed in the previous years, the units identifi ed as high-risk areas in 2003-2004 were situated in the city’s southern region. In addition to type H areas, where none of the indices showed high values, only three units in high-risk areas were identifi ed: types C, E and F. In the 2004-2005 and 2005-2006 seasonal years, the units characterized as high-risk areas were once again concentrated in the city’s northern region.
In 2001-2002, 19.4% of the units were classifi ed as higher-risk (48.0% of dengue fever cases), 13.9% in 2002-2003 (34.7% of cases), 2.8% in 2003-2004 (19.5% of cases), 16.7% in 2004-2005 (57.9% of cases), Figure 2. Spatial units according to risk classifi cation for the occurrence of dengue fever. City of São José do Rio Preto, Sou-theastern Brazil, September of 2002 to August of 2004.
2002-2003
Temporal risk
B E H
No cases 1.000
meters
2003-2004
Temporal risk
C E F H No cases
1.000
meters
Figure 3. Spatial units according to risk classifi cation for the occurrence of dengue fever. City of São José do Rio Preto, Southeastern Brazil, September of 2004 to August of 2005. 2004-2005
Temporal risk
A B C D G H No cases
1.000
and 21.3% in 2005-2006 (36.9% of cases). Of all the dengue fever cases in the period between September of 2001 and August of 2006 (11,989), 4,562 of these (38.1%) occurred in units classifi ed as higher-risk.
DISCUSSION
Four main problems should be mentioned in the pres-ent study: the use of information about notifi ed dengue fever cases, the use of two diagnostic criteria, the use of the home address, and the fact that 15.7% of cases were not geocoded. Regarding the fi rst problem, the notifi ed cases represent a portion of all the infections that occurred, thus causing bias in the analysis. The asymptomatic cases and the sick people who do not seek care do not appear in the statistics. Even those who do seek care are not input to the notifi cation system. Moreover, there must be differences in notifi cation, as people who live in richer areas may be less willing to deal with health service routines.2,8
Between April and August of 2006, dengue fever cases in the city of São José do Rio Preto were confi rmed by the clinical-epidemiological criterion, not through a blood test anymore. This is because the city had sur-passed the limit of 300 cases per 100,000 inhabitants, condition laid down by the Secretaria de Saúde do Es-tado de São Paulo (State of São Paulo’s Department of Health) that stops serological tests from being conducted (Centro de Vigilância Epidemiológica (Epidemiological
Surveillance Center): unpublished information). Thus, there was an artifi cial increase in the number of cases in this period compared to previous years.
The use of home addresses to geocode cases presuppos-es that transmission has occurred at home. However, it could also be related to a place of work, study or leisure, among others. Geocoding cases depends on correctly
fi lling out the investigation form, which oftentimes does not happen due to lack of training or interest.
Despite the previously mentioned bias, information available in the health services can lead to important conclusions, recommendations and hypotheses. Even though this information does not enable one to under-stand the disease transmission process, it is possible to seek development of the surveillance and control system to provide tools that help services responsible for the decision-making control and improvement of actions.5 In any case, it is important to improve the case notifi cation system, so that the previously mentioned bias can be minimized when this system is used.
Geocoding and spatial analysis techniques have been used more and more frequently to assess distribution of vectors as well as the diseases caused by them, and have thus contributed to improve surveillance control practices. Their major use is to outline strategies that are dependent on the several contexts that the city is comprised of. Thus, the use of these tools enables the identifi cation of high-risk areas that require intensifi ca-tion and/or prioritizaca-tion of control measures.7
Despite their signifi cance, all the values obtained from the Moran indices were low, which points to a small spatial dependence on the three temporal risk indices. Nonetheless, the highest-risk spatial units were respon-sible, during this period, for over a third of dengue fever cases, and in the 2004-2005 seasonal year, they represented 57.8% of cases. Only in the 2003-2004 seasonal year were the high-risk units identifi ed in the city’s southern region; in the remaining years, they were concentrated in the northern region. Even though the highest-risk units in distinct periods did not completely coincide, this result shows that this area of the city must be given priority in terms of vector and disease control and surveillance.
For Wen et al (2006),13 the analysis of results obtained by means of three temporal indices for the spatial units, with their respective risk classifi cations, could be useful to recognize patterns of disease occurrence, and to assess the effi cacy of control measures. Despite the small number of units identifi ed as highest-risk (2.8% in 2003-2004 and 21.3% in 2005-2006), health services must pay closer attention to these areas, as the high temporal indicator values could have resulted from worse environmental and socioeconomic conditions and/or control failures.
Figure 4. Spatial units according to risk classifi cation for the occurrence of dengue fever. City of São José do Rio Preto, Southeastern Brazil, September of 2005 to August of 2006. 2005-2006
Temporal risk
A B C E F G
H 1.000
Studies conducted in the city of São José do Rio Preto6 pointed to a relationship between higher dengue fever incidences and worse socioeconomic levels in the 1994-1995 seasonal year exclusively. In the remaining periods (from 1995 to 2002), the two variables were not related. However, a great number of areas with the worst socioeconomic levels were concentrated in the city’s northern region, where the majority of high-risk spatial units were identifi ed.6 In any case, the relation-ship between dengue fever and socioeconomic levels remains a debatable issue.
According to Wen et al (2006),13 to consider the pos-sible combinations of the three temporal risk indicators is important to differentiate risk characteristics. Thus, once the higher-risk units are identifi ed and mapped, the next step is to compare their distinct patterns.
The units classifi ed as type A are, according to Wen et al (2006),13 the areas where transmission occurred most severely, and they could be sources from which dengue fever cases are spread to other areas. The low intensity of type B areas could have resulted from the massive use of insecticides, and the existence of insecticide-re-sistant mosquitoes could have been responsible for the high frequency and long duration. The high frequency and low duration and intensity of type C areas could be connected to the existence of unidentifi ed transmission sources and the ineffi ciency of control measures.
The long duration and high intensity of type D areas could have resulted from severe transmission, but the low frequency points to the absence of susceptible peo-ple or to the relative effectiveness of control measures. Type E areas, with high intensity and low frequency and duration, could be related to few, intense and frequently interrupted transmission cycles, which show that the control measures adopted were effective.13
The high frequency and intensity and low duration of type F areas indicate frequently interrupted trans-mission cycles and show that control measures were neither effective in the long term nor applied in an integrated manner. Type G areas, with high duration and low frequency and intensity, could have resulted from a continuous, yet silent or less intense dengue fever transmission. These could be ignored by health services, and thus become sources of infection in new areas between consecutive years.2,5,13
Article based on the masters’ dissertation by B Galli presented to the Faculdade de Medicina de São José do Rio Preto, in 2006. Financed by Fundação de Amparo à Pesquisa do Estado de São Paulo (FAPESP – Process N.º 2006/00214-7).
1. Anselin L. Local indicators of spatial association
– LISA. Geogr Anal. 1995;27(2):93-115.
2. Chen WJ, Chen SL, Chien LJ, Chen CC, King CC, Harm MR, et al. Silent transmission of dengue virus in
Southern Taiwan. Am J Trop Med Hyg. 1996;55(1): 12-6.
3. Environmental Systems Research Institute. ArcGis 9.1 [software em CD-ROM]. Redlands; 2005.
4. Favier C, Schmit D, Muller-Graf CD, Cazelles B, Degallier N, Mondet B, et al. Infl uence of spatial heterogeneity on an emerging infectious disease:
the case of dengue epidemics. Proc Biol Sci.
2005;272(1568):1171-7. doi:10.1098/rspb.2004.3020
5. Mondini A. Chiaravalloti-Neto F, Gallo y Sanches M, Lopes JCC. Análise espacial da transmissão de dengue
em cidade de porte médio do interior paulista. Rev
Saude Publica. 2005;39(3):444-51. doi:10.1590/ S0034-89102005000300016
6. Mondini A. Chiaravalloti-Neto F. Variáveis
socioeconômicas e a transmissão de dengue. Rev
Saude Publica. 2007;41(6):923-30. doi:10.1590/ S0034-89102007000600006
7. Souza-Santos R, Carvalho MS. Análise da distribuição
espacial de larvas de Aedes aegypti na Ilha do
Governador, Rio de Janeiro, Brasil. Cad Saude
Publica. 2000;16(1):31-42. doi:10.1590/S0102-311X2000000100004
8. Teixeira MG, Barreto ML, Costa MC, Ferreira LD, Vasconcelos PF, Cairncross S. Dynamics of dengue virus circulation: a silent epidemic in a complex
urban area. Trop Med Int Health. 2002;7(9):757-62.
doi:10.1046/j.1365-3156.2002.00930.x
9. Teixeira MG, Costa MC, Barreto ML, Mota E. Dengue and dengue hemorrhagic fever epidemics in Brazil: what research is needed based on trends,
surveillance, and control experiences? Cad Saude
Publica. 2005;21(5):1307-15. doi:10.1590/S0102-311X2005000500002
10. Tran A, Deparis X, Dussart P, Morvan J, Rabarison P, Remy F, et al. Dengue spatial and temporal patterns,
French Guiana, 2001. Emerg Infect Dis. 2004;10(4):
615-21.
11. Van-Benthen BH, Vanwambeke SO, Khantikul N, Burghoorn-Maas C, Panart K, Oskam L, et al. Spatial patterns of and risk factors for seropositivity for dengue
infection. Am J Trop Med Hyg. 2005;72(2):201-8.
12. Vanwambeke SO, van Benthem BH, Khantikul N, Burghoorn–Maas C, Panart K, Oskam L, et al. Multi-level analyses of spatial and temporal determinants
for dengue infection. Int J Health Geogr. 2006;5:5.
doi:10.1186/1476-072X-5-5
13. Wen TH, Lin NH, Lin CH, King CC, Su MD. Spatial mapping of temporal risk characteristics to improve environmental health risk identifi cation: a case
study of a dengue epidemic in Taiwan. Sci Total
Environ. 2006;367(2-3):631-40. doi:10.1016/ j.scitotenv.2006.02.009
14. World Health Organization. Dengue haemorrhagic fever: diagnosis, treatment, prevention and control. 2. ed. Geneva; 1997.
15. Zimmerman Dl, Fang X, Mazundar S, Rushton G. Modeling the probability distribution of positional
errors incurred by residential address geocoding. Int J
Health Geogr. 2007;6:1. doi:10.1186/1476-072X-6-1