Tatiana YonekuraI
Cássia Baldini SoaresII
Elaine Garcia MinuciIII
Célia Maria Sivalli CamposII
Carla Andrea TrapéI
I Programa de Pós-Graduação em Enfermagem. Universidade de São Paulo. São Paulo, SP, Brasil
II Departamento de Enfermagem em Saúde Coletiva. Escola de Enfermagem. Universidade de São Paulo. São Paulo, SP, Brasil
III Fundação Seade. São Paulo, SP, Brasil Correspondence:
Cássia Baldini Soares
Av. Dr. Enéas de Carvalho Aguiar, 419 Cerqueira César
005403-000 São Paulo, SP, Brasil E-mail: [email protected] Received: 1/23/2009 Revised: 5/11/2009 Approved: 7/30/2009
Youth map of the city of Santo
André, Southeastern Brazil:
an instrument to read
social inequalities
ABSTRACT
OBJECTIVE: To analyze social inequalities in young adults living in an urban area by mapping sociodemographic and economic data.
METHODS: Using data from the 2000 Demographic Census, 57 sociodemographic and economic variables of young adults aged from 15 to 24 years, living in the city of Santo André, Southeastern Brazil, were distributed among 43 areas of statistical data, corresponding to a division of the region into smaller districts. Data from the year 2000 were collected from the Santo André City Hall Department of Socioeconomic Indicators. Using factorial analysis, 13 variables were grouped in two factors – working conditions and life conditions, which distinguished areas that were similar to one another statistically. Cluster analysis of areas was performed, resulting in four social groups.
RESULTS: The area that concentrated young adults with higher access to wealth
was classiied as central and that including individuals with lower access to wealth was classiied as peripheral. Two intermediate areas could be identiied,
one closer to the highest access to wealth (“almost central”) and another close to the lowest access to wealth (“almost peripheral”). Discriminating variables were associated with work, migration, level of education, fertility, adolescent’s position in the household, presence of spouse or partner, living conditions and assets owned.
CONCLUSIONS: Differences among social groups revealed important inequalities among young adults who live, study and/or work in the city, which will contribute to the planning of public social policies aimed at these groups.
Youth is a theme that has been increasingly discussed in modern society, notably due to the complexity of problems young adults have been facing. As this is
an object of interest in several ields of knowledge, it
mobilizes research development and public policies. Growth in population age distribution in the 15-to-24 -year age group in the 1990s, especially in Brazilian metropolitan areas,3 justiies the social interest for this
group as a strategic development agent. On the other hand, the so-called “job crisis” threatens the incorpora-tion of young adults into the job market:6 whereas those
from economically stable social groups continue their studies and remain with their family of origin, the others have to submit to bad jobs and low salaries.a
The perspective of collective health views youth from the social class and generation categories, submitting the reading of modern reality of youths to their class condi-tion. Thus, there are several youth realities, and although having the generation condition in common, they end up experiencing it in different ways, according to their families’ inclusion in production and consumption.12
Critical epidemiology, one of the main collective health instruments, has the inequalities of social reproduction as its subject. Social class is a category of analysis capable of revealing the weight of inequalities in health and making what is abstract, underlying the population category, concrete. This category, in its turn, is conceived as a homogeneous group of individuals, without referring to their possibilities of action.9
Assuming that mapping inequalities constitutes a useful instrument to plan public policies aimed at young adults, this study is also founded on the Santos’ concept of space,10 “Space is understood as the environment,
the material place of possibility of events (…) It is considered as something dynamic and unitary, where materiality and human action are included. Space would be the indissoluble set of systems of natural or man-made objects, the latter resulting from action systems, whether these are determined or not. In each period, new objects and actions are added to the previous ones, changing the whole, both in form and substance.” The space category enables the recognition of the urban heterogeneity, once it incorporates social dynamics and structure – where and how people live; what
deter-mines the production and low of goods and services.2 Classiication of spaces into downtown and suburbs,
frequently associated with the wealth and poverty
INTRODUCTION
a Castro JA, Aquino L, organizadores. Juventude e políticas sociais no Brasil. Brasília, DF: IPEA; 2008. (Texto para discussão, 1335). [Internet]. Brasília: IPEA; 2008 [cited 2008 Oct 18]. Available from: http://www.ipea.gov.br/sites/000/2/publicacoes/tds/td_1335.pdf
b Instituto de Pesquisa Econômica Aplicada. Índice de Desenvolvimento Humano (IDH). Brasília, DF; 2008. [Internet]. [cited 2008 Oct 26]. Available from: http://www.ipeadata.gov.br/ipeaweb.dll/ipeadata?SessionID=32310627&Tick=1225114145410&VAR_FUNCAO=Ser_ Temas(1828887210)&Mod=S
equation, does not portray the social dynamics in their entirety, with the historical changes they have under-gone and “which do not enable one to predict the social contents connected to housing in such places”.14 Thus, it is necessary to incorporate variables that relect
different perspectives of social reproduction to better understand social inequalities.
Thematic maps are an instrument to show results that enable reality to be represented in a fast and broad way, providing a wider perspective of the city’s social differences.2 In this way, gathering information and
spatial references is a powerful tool to analyze and understand data, aiming to plan public policy actions. These maps enable the analysis of characteristics and differences present in each territorial space, beyond the simple geographical division.8
Social policies based on territorial differences are found to be important to change the strong negativity of poor areas, due to their lack of urban infrastructure services, housing, sanitation, education and public safety, among other things, which end up becoming decisive factors of reproduction of poverty.15
The present study aimed to analyze social inequalities of young adults living in an urban area by mapping socio-demographic and economic data.
METHODS
According to the Instituto Brasileiro de Geograia e
Estatística (IBGE – Brazilian Institute of Geography and Statistics), the city of Santo André, Southeastern Brazil, had an estimated population of 671,696 inha-bitants in 2008 and a Gross Domestic Product (GDP) of 17,066 reais per capita, practically the same as the average GDP of the state of São Paulo. Human Development Index is considered high (0.835), ranking in 24th place in this state.b In the Atlas da Exclusão
Social (Atlas of Social Exclusion), this city ranked in eighth place among the 100 cities with the highest number of rich families in Brazil and in third place among the 45 cities of the state of São Paulo.7
conditions) and patterns of inclusion in consumption (life conditions) to be the basis of collection of empi-rical data in different social realities.11 These data,
provided by the Santo André City Hall Department of Socioeconomic Indicators3 (DISE),4 referred to:
demographic characteristics of the population (sex, ethnicity, migration, marital status and fecundity), socioeconomic characteristics (level of education, religion, work and income, potential of consump-tion – owning appliances and assets) and household characteristics (condition of home occupation and lot, number of residents per room and sanitation). All of the 57 variables were distributed by Regiões de Dados Estatísticos (SDA – Statistical Data Areas) – a division of the territory into smaller districts.a The city was
divided into 43 SDAs, according to territorial divisions used for city management planning.
Data were pre-selected and submitted to factorial analysis, using the SPSS 2004 software. First, variables with little variability among the SDAs and, thus, little discriminating, were excluded. On the other hand, if the variable was considered qualitatively important to assess potential strengthening or weakening of the youth population, it was initially considered in the multivariate analysis, despite the standard deviation value. Next, factorial analysis5 sought to reduce the group of
variables to two, three, four (or more) factors without decreasing the SDAs’ explanatory capacity of diffe-rentiation. This technique creates a measure (commo-nality), which enables one to analyze the proportion of variance of each variable, explained by common factors, with the variable being excluded when this measure is equal to or higher than 0.6.
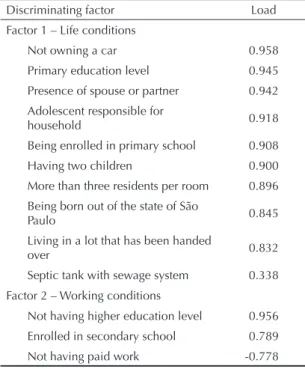
The group of variables described in Table 1 was thus
obtained, where two factors were identiied. These
factors were extracted by the analysis of main compo-nents, which explain almost 78% of the total variance
of original variables. The irst factor (life conditions)
explains 59.6% of variance, whereas the second factor (working conditions) explains 18.0%.
Only the “septic tank” variable showed commonality
below 0.6, although it remained in the inal model
due to its important weakening potential in certain social groups of the population studied, who live in watershed areas.
For this result of factorial analysis, a KMO=0.866 value was obtained. The Kaiser-Meyer-Olkin (KMO) test is a statistical tool that indicates the proportion of data variance that can be considered common to all varia-bles, i.e. that can be attributed to a common factor. In this way, the closer to 1 (unit), the better the result and
the more suitable the group of data for the application of factorial analysis. This was also proved by Bartlett’s sphericity test, which rejected the hypothesis of
non-correlation among data at a 5% signiicance level. Thus,
the application of factorial analysis was found to be adequate for these data.
Based on these factors, cluster analysis was used,1
following the k-means method. It was possible to identify four social groups based on the SDA clusters
identiied by variables.
RESULTS
The group that concentrated adolescents with the
highest access to wealth was classiied as central (C)
and those with the lowest access to wealth as peri-pheral (P). A total of two intermediate groups were
identiied, one closer to the highest access to wealth
(almost central – AC) and another close to the lowest access to wealth (almost peripheral – AP). However, darker colors, representing more peripheral spaces with lower access to wealth, also appear among more central spaces, showing that the center-periphery relation is not so symmetrical, as observed in the case of SDAs 13 and 16 (Figure).
Table 1. Discriminating factors and respective factorial loads.
City of Santo André, Southeastern Brazil, 2000. Discriminating factor Load Factor 1 – Life conditions
Not owning a car 0.958 Primary education level 0.945 Presence of spouse or partner 0.942 Adolescent responsible for
household 0.918
Being enrolled in primary school 0.908 Having two children 0.900 More than three residents per room 0.896 Being born out of the state of São
Paulo 0.845
Living in a lot that has been handed
over 0.832
Septic tank with sewage system 0.338 Factor 2 – Working conditions
Not having higher education level 0.956 Enrolled in secondary school 0.789 Not having paid work -0.778 Source: Instituto Brasileiro de Geografia e Estatística (Brazilian Institute of Geography and Statistics); 2000 Brazilian Census.
Table 3. Sociodemographic and economic variables discriminating areas of statistical data, according to social group. City of Santo André, Southeastern Brazil, 2000.
Variable
Social group
p Central Almost central Almost peripheral Peripheral
n % n % n % n %
Being born out of the state of São Paulo 894 36 2,771 44.1 7,690 48 1,0376 69.8 0.000 Being enrolled in primary school 381 6 1,400 9.9 4,047 15.4 4,059 29.4 0.000 Being enrolled in secondary school 2144 34.3 7,862 54.7 16,267 61.4 8,066 57.3 0.000 Primary school level 575 21.9 3,142 27.8 9,519 33.6 10,244 54.9 0.000 Not having a higher education level 1329 14.6 6,553 25.6 17,057 31.2 8,235 25.1 0.000 Not having paid work 5114 58.7 1,3156 51.6 27,266 49.8 18,951 57.1 0.000 Adolescent responsible for the household 252 2.7 1,448 5.6 4,271 7.7 3,966 11.9 0.000 Presence of a spouse or partner 536 5.7 2,884 11.2 8,277 15 8,003 24.2 0.000 Having two children 51 1 417 3.3 1,228 4.4 1,379 8.1 0.000 More than three residents per room 337 3.7 2,338 9.2 7,397 13.6 7,847 23.8 0.000 Living in a lot that has been handed over 103 0.3 963 4.6 3,688 5.1 7,907 15.4 0.000 Septic tank with sewage system 236 3.2 1,002 3.3 1,841 4.1 3,162 8.7 0.052 Not owning a car 1283 13.9 7,389 29.2 20,889 39 19,773 60.2 0.000 Source: Instituto Brasileiro de Geografia e Estatística (Brazilian Institute of Geography and Statistics).
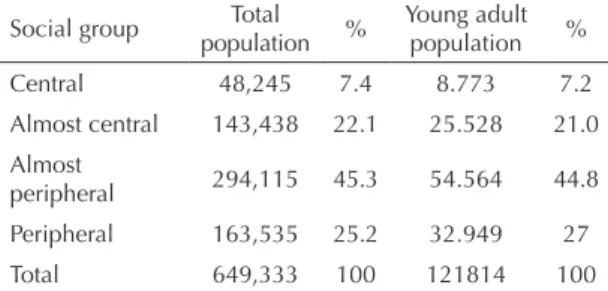
Young adults corresponded to 18.8% of the population of Santo André and were distributed homogeneously as follows: 18.2% in group C; 17.8% in AC; 18.6% in AP; and 20.1% in P.
The lowest number of SDAs was in spaces C (4) and AC (10), while the highest number of SDAs was found in the more distant spaces, AP (19) and P (10). Group C concentrated the lowest number of young adults (Table 2).
The variables that distinguished the SDAs are shown in Table 3. As regards adolescents’ place of birth, the variable that discriminated the four groups was “to be born out of the state of São Paulo”. Results showed that, among young residents in group P, the highest percen-tage of adolescents born in other states, excluding São Paulo, was found, the majority of which came from Northeastern Brazil.
A total of ive variables were selected to discriminate
the SDAs in terms of access to education. Adolescents who were in primary school totaled 6% in group C and 29.4% in group P. Those who should be comple-ting or have completed primary school at 15 years of age showed delayed schooling, with a lower number present in group C. Regardless of age, the highest percentage of adolescents who were in secondary school belonged to group AP. The poorer they were, the higher the frequencies of their having completed primary school exclusively. Thus, 54.9% of adoles-cents who had completed primary school exclusively belonged to group P. Among those who did not have higher education, despite their being in the adequate age group, 25.1% were in group P.
The work variable that discriminated the four groups was “not having paid work”. The results showed that “not having paid work” decreased as one moved towards the city’s poorer spaces, except for the group situated in the most peripheral area. This group showed an even higher index of unpaid work, compared to more central groups, once many adolescents did not work because they did not have a job. Whereas inclusion in the job market can be postponed until the end of
professional qualiication among richer adolescents,
non-inclusion in the job market is determined by unem-ployment among poorer ones.
One of the youth life condition variables that discri-minated groups was the position of an adolescent as responsible for the household. Among those in this posi-tion, the majority came from group P. The adolescent’s responsibility to provide for the household and certainly
Table 2. Distribution of the total population and that of young
adults aged between 15 and 24 years, according to social group. City of Santo André, Southeastern Brazil, 2000.
Social group Total population %
Young adult population % Central 48,245 7.4 8.773 7.2 Almost central 143,438 22.1 25.528 21.0 Almost
the pressure to be included in the job market were found to increase towards peripheral spaces. This fact should cause life conditions for these families to become worse, once lower per capita income indices are concentrated in this area. Another discriminating variable was the presence of a spouse or partner. The highest percentage of young adults living with a spouse or partner was in group P, as well as the fact of their having up to two children.
A total of three variables associated with housing
conditions helped to deine groups: number of residents per room higher than three, condition of lot deined
as property that has been handed over and household sewage disposed of by a septic tank. Of all households in these conditions, the majority were in group P. Among the variables associated with owning assets, not to have a car was the one that statistically contributed to discriminate groups. The majority of adolescents without a car belonged to group P.
The remaining variables also showed differences among groups, although these differences will be discussed in another study.
DISCUSSION
Among a great group of variables, the youth map of
Santo André enabled the identiication of the following
two factors, capable of discriminating the different spaces of the city between themselves: life conditions and working conditions. By grouping these factors by similarity, based on the cluster analysis method, the existence of four different social groups, distributed throughout the spaces of the city of Santo André, was revealed. Although the difference between rich center
and poor periphery is signiicant, the map revealed the
location of poor social groups out of the so-called peri-pheral space and close to more central spaces. Results of the present study are similar to those from other studies. In the city of São Paulo, Southeastern Brazil, “higher levels of privation are present in more distant districts, especially in the north, east and south areas of the metropolitan region, while richer groups are highly concentrated in central São Paulo.”14
The map, constructed to relect adolescents’ social
reproduction profiles, also shows great similarity with the map of poverty distribution in Santo André, designed from the “half a minimum wage per capita income” variable.7
Figura. Mapa das juventudes de Santo André, SP, Brasil.
Central
Quase central
Quase periférico
The lower number of SDAs comprised spaces C and AC, while the higher number of SDAs comprised the
more distant spaces AP and P, thus conirming the
national pattern of exclusion and wealth accumulation. The average monthly family income of rich young adults was about R$ 22,000.00 in 2003, a value 14 times higher than the average monthly family income in the country and about 80 times higher than the line of poverty, below which the poorest 20% individuals are.7 As regards the youth portion of the population,
31.3% can be considered poor, with a per capita family income of up to half a minimum wage. Only 8.6% come from families with a per capita income higher than two minimum wages and about 60% belong to the intermediate stratum, with a per capita income between half and two minimum wages.a
This distribution follows the proportionality among classes, found in a sample from a study performed in the city of São Paulo in 2001, showing the growing proportion of young adults present in the population as poorer spaces are approached.14
The pattern of rich center and poor periphery is not sufficient to portray inequality among the city’s adolescents, once there are poverty spaces close to the center, as observed in the city of São Paulo in 2003.4
Thus, although the dual periphery-center relation, which marked the consolidation of the city of São Paulo as a Brazilian industrial metropolis in the 1960s and 1970s, has evolved towards a less polarized model with the rise of sub-centers, there was no rupture with consolidated inequality patterns, but rather the creation of new designs, with the spread of poverty in spaces closer to the center.4
Data on level of education from the 2005 National Household Sample Survey (PNAD) were in agree-ment with those on young adults of Santo André: per capita family income was an explicit divider of level of education, once this level in the poorest 20% of the population was almost half of that in the richest 20% (25.1% against 48.6%).b On the national level, it is
known that many adolescents interrupt their studies in primary school and less than half of Brazilian adoles-cents aged between 15 and 17 years go to secondary school.c
In Santo André, social inequality is even greater when it comes to the percentage of young adults in higher education courses, which is similar to that of the country, whose rates vary according to per capita income, ranging between 4.7% among those who earn from half to one minimum wage and 59.8% among
those who earn ive or more minimum wages.a Thus, it can be afirmed that the young adults’ educational
situation in the city of Santo André follows the national context and can be summarized as “the existence of 1.5 million illiterates; persistence of high student age-school grade distortion, thus compromising access to secondary school at the right age; low frequency of young adults in higher education; and restricted opportunities of access to professional education”.d
In its turn, level of education of heads of family is associated with per capita family income in a directly proportional relation.d
In terms of working conditions, the analysis of unem-ployment in Brazil reveals that the highest rates are among young adults, responsible for 50% of national unemployment. A total of 26.2% of unemployed adoles-cents belong to low income families, whereas 11.6% belong to higher income ones. Young adults from higher income families have greater access to paid work and a formal working contract, which means that those from low income families are more excluded from social and
labor law beneits. The phenomenon of inter-generational
regression is observed, i.e. although having a higher level of education than their parents, these adolescents cannot obtain better working and life conditions.7
In addition, the number of hours worked varied accor-ding to the level of education: whereas 41% of those who only completed up to the fourth grade of primary school work more than eight hours a day, this excessive workload affects only 13% of those who have a higher education level.f
Poorer adolescents who start a family sooner are those who end up experiencing moments of more privation at work and in life. Moreover, the condition of motherhood/ fatherhood shows strong variation in terms of level of education and family income. The percentage of adolescents with children and lower level of education
a Castro JA, Aquino L, organizadores. Juventude e políticas sociais no Brasil. Brasília, DF: IPEA; 2008. (Texto para discussão, 1335). [Internet]. Brasília: IPEA; 2008 [cited 2008 Oct 18]. Available from: http://www.ipea.gov.br/sites/000/2/publicacoes/tds/td_1335.pdf
b Instituto Brasileiro de Geografia e Estatística. PNAD 2004: ocupação cresceu e rendimento ficou estável. Brasília; 2005 [Internet]. [cited 2008 Oct 20]. Available from: http://www.ibge.gov.br/home/presidencia/noticias/noticia_visualiza.php?id_noticia=48
c Frigotto G. Juventude, trabalho e educação no Brasil: perplexidades, desafios e perspectivas. In: Novaes R, Vannuchi P, organizadores. Juventude e sociedade: trabalho, educação, cultura e participação. São Paulo: Fundação Perseu Abramo; 2004. p.180-216.
d Cesar CLG, Carandina L, Alves MCGP, Barros MBA, Goldbaum M. Saúde e condição de vida em São Paulo. São Paulo: Faculdade de Saúde Pública da Universidade de São Paulo; 2005.
e Pochmann M. Juventude em busca de novos caminhos no Brasil. In: Novaes R, Vannuchi P, organizadores. Juventude e Sociedade: Trabalho, educação, cultura e participação. São Paulo: Fundação Perseu Abramo; 2005. p.217-241.
(up to primary school) is higher than 30%, a value that decreases to 9% among those with higher education.a
As regards life conditions, the Summary of Social Indicatorsb reveals that the reduction in the average
number of children per woman in the entire country has not occurred homogeneously in all social classes and age groups. In terms of social class, particularly income, in 2005, 74% of the poorer women in reproductive age already had at least one child; whereas this proportion was 49.2% among those with a per capita family income of at least two minimum wages. As regards differences per age group, there was a small increase in the propor-tion of girls aged between 15 and 17 years with children from 6.8% to 7.1%, between 2004 and 2005.b
Once income comes from work and determines housing conditions and possibilities of consumption, adoles-cents living in more peripheral areas are expected to have worse living conditions and lower access to durable goods.
Similarly, a study in the city of Rio de Janeiro, Southeastern Brazil, showed that households with a high density of residents are situated in areas of great poverty, in a clear relation with income inequality.13
This relation is also valid for access to urban infras-tructure services. If, on the one hand, Brazilian indices show an improvement in sewage system coverage in homes, with an increase in the connection to the sewage system and stability in the number of homes with a septic tank, on the other, this improvement was
not suficient to improve life conditions of all social
groups homogeneously.14
The decision to use Census data to construct the youth map reveals some limitations and potential aspects. Among the main limitations, the lack of full corres-pondence between the “social reproduction” category, a theoretical framework of analysis, and the set of secondary data provided by the Census, selected as variables to be treated statistically, could be empha-sized. Mapping has a macro-spatial character and, as a result, does not enable the assessment of social differences in the groups/spaces formed. Variables that can be potential strengthening or weakening aspects, such as debts or number of hours spent in transporta-tion, are not usually collected in the census. Although
data were from 2000, which may not relect the city’s
current reality, the method of map construction enabled
the identiication of social inequalities. In addition, the
map is an important instrument to perform new studies that consider young adults as individuals, which may enable the process of setting the limits of proportional sampling to be available to several groups. Moreover, this instrument is important to plan public social policies aimed at different groups in the spaces of social life. By considering unequal territories, social policies have the potential, in the medium and long terms, to promote social integration of youth groups segregated by poverty.
ACKNOWLEDGEMENTS
Researchers would like to thank the Santo André City Hall Department of Socioeconomic Indicators(DISE) for making data and the structure of areas of statistical data available and the City of Santo André Department of Health Program of Youth Healthfor the suggestions to the project.
a Abramo HW. Condição juvenil no Brasil contemporâneo. In: Abramo HW, Branco PPM, Organizadores. Retratos da juventude brasileira: Análise de uma pesquisa nacional. São Paulo: Fundação Perseu Abramo; 2005. p.37-72.
1. Anderson RE, Black WC, Hair JF,.Tatham RL. Multivariate data analysis. 5.ed. New Jersey: Prentice Hall; 1998.
2. Barcellos C, Bastos FI. Geoprocessamento, ambiente e saúde: uma união possível? Cad Saude
Publica. 1996;12(3):389-97.
DOI:10.1590/S0102-311X1996000300012
3. Bastos RLA. Crescimento populacional, ocupação e desemprego dos jovens: a experiência recente da Região Metropolitana de Porto Alegre. Rev Bras Estud
Popul. 2006;23(2):301-15.
DOI:10.1590/S0102-30982006000200007
4. Bousquat A, Cohn A. A construção do mapa da juventude de São Paulo. Lua Nova. 2003;(60):81-96. DOI:10.1590/S0102-64452003000300005
5. Morrison DF. Multivariate statistical methods. 3.ed. New York: McGraw-Hill; 1990.
6. Muniz V. As descontinuidades demográficas exercem efeitos sobre o mercado de trabalho metropolitano dos jovens. RevBras Estud Popul. 2002;19(2):65-98.
7. Pochmann M, Campos A, Barbosa A, Amorin R, Silva R, organizadores. Atlas da exclusão social no Brasil. 2. ed. São Paulo: Cortez; 2005. v.3.
8. Ricketts TC. Geographic information systems and public health. Annu Rev Public Health. 2003;24:1-6. DOI:10.1146/annurev.publhealth.24.100901.140924
9. Samaja J. Desafios a la epidemiología (pasos para una epidemiología “Miltoniana”). Rev Bras
Epidemiol. 2003;6(2):105-20.
DOI:10.1590/S1415-790X2003000200005
10. Santos M. Técnica espaço tempo: globalização e meio técnico-científico informacional. São Paulo: Hucitec; 1996.
11. Soares CB, Ávila LK, Salvetti MG. Necessidades (de saúde) de adolescentes do DA Raposos Tavares, SP, referidas à família, escola e bairro. Rev Bras
Crescimento Desenvolv Hum. 2000;10(2):19-34.
12. Soares CB. Mais que uma etapa do ciclo vital: a adolescência com um construto social. In: Borges ALV, Fujimori E. Enfermagem e a saúde do adolescente na atenção básica. São Paulo: Manole; 2009. p.3-22. 13. Szwarcwald CL, Bastos FI, Esteves MAP, Andrade CLT,
Paez MS, Médici EV, et al. Desigualdade de renda e situação de saúde: o caso do Rio de Janeiro. Cad
Saude Publica. 1999;15(1):15-28. DOI:10.1590/
S0102-311X1999000100003
14. Torres HG, Marques E, Ferreira MP, Bitar S. Pobreza e espaço: padrões de segregação em São Paulo.
Estud Av. 2003;17(47):97-128.
DOI:10.1590/S0103-40142003000100006
15. Torres HG, Marques E. Políticas sociais e território: uma abordagem metropolitana.São Paulo
Perspect. 2004;18(4):28-38.
DOI:10.1590/S0102-88392004000400005 REFERENCES
Research funded by the Fundação de Amparo à Pesquisa do Estado de São Paulo (FAPESP – São Paulo State Research Support Foundation – Process 06/51671-9). Yonekura T was granted a scientific initiation scholarship by FAPESP (Process 06/61299-0).