Inequalities in health: living
conditions and infant mortality
in Northeastern Brazil
Desigualdades em Saúde: condições
de vida e mortalidade infantil em
região do nordeste do Brasil
I Programa de Pós-Graduação em Saúde
e Ambiente. Universidade Tiradentes. Aracaju, SE, Brasil
II Programa de Pós-Graduação em Ciências
da Saúde. Universidade Federal de Sergipe. Aracaju, SE, Brasil
III Laboratório de Doenças Infecciosas e
Parasitárias. Instituto de Tecnologia e Pesquisa. Universidade Tiradentes. Aracaju, SE, Brasil
IV Departamento de Medicina. Universidade
Federal de Sergipe. Aracaju, SE, Brasil
V Laboratório de Planejamento e Promoção
da Saúde. Instituto de Tecnologia e Pesquisa. Universidade Tiradentes. Aracaju, SE, Brasil
Correspondence:
Renata Alves da Silva Carvalho
Av. Sílvio Cabral Santana, 455 casa 89 Cond. Guilhermino Resende
49000-239 Aracaju, SE, Brasil E-mail: [email protected] Received: 2/23/2013
Approved: 8/2/2014
Article avaiable from: www.scielo.br/rsp
ABSTRACT
OBJECTIVE: To analyze the variation of infant mortality as per condition of life in the urban setting.
METHODS: Ecological study performed with data regarding registered deaths of children under the age of one who resided in Aracaju, SE, Northeastern Brazil, from 2001 to 2010. Infant mortality inequalities were assessed based on the spatial distribution of the Living Conditions Index for each neighborhood, classiied into four strata. The average mortality rates of 2001-2005 and 2006-2010 were compared using the Student’s t-test.
RESULTS: Average infant mortality rates decreased from 25.3 during 2001-2005 to 17.7 deaths per 1,000 live births in 2006-2010. Despite the decrease in the rates in all the strata during that decade, inequality of infant mortality risks increased in neighborhoods with worse living conditions compared with that in areas with better living conditions.
CONCLUSIONS: Infant mortality rates in Aracaju showed a decline, but with important differences among neighborhoods. The assessment based on a living condition perspective can explain the differences in the risks of infant mortality rates in urban areas, highlighting health inequalities in infant mortality as a multidimensional issue.
DESCRIPTORS: Infant Mortality, trends. Social Conditions. Health Status Disparities. Health Inequalities. Social Inequity. Child Health. Ecological Studies.
Renata Alves da Silva CarvalhoI
Victor Santana SantosII
Cláudia Moura de MeloIII
Ricardo Queiroz GurgelIV
Infant mortality rates aid in the assessment of the living conditions of a population. Infant mortality is commonly used to verify the level of life and health of a location due to the fact of it being sensitive to improvements in the access to health care and quality of life.22 The condition of infant health, considered as
being a classic indicator of public health, is associated with, among other factors, access to health services, sanitation, education level of the mother, housing, and nutrition. Reducing the mortality rate in children under the age of ive is the fourth millennium goal of the United Nations Development Program (UNDP). Brazil reduced this rate by 5.2% from 1990 to 2008,21
being one of the countries that have achieved the goal. According to the Pan American Health Organization,a
infant mortality rate (IMR) estimates of deaths per thou-sand live births (LB) for children under the age of one for Mexico, Brazil, and Chile in 2011 was 14.1, 16.2, and 7.4, respectively. In 2010, the IMR for the United States, Spain, and Sweden was 6.1, 3.2, and 2.5 deaths per thousand LB, respectively.b
RESUMO
OBJETIVO: Analisar a variação da mortalidade infantil por condição de vida no meio urbano.
MÉTODOS: Estudo ecológico realizado com dados de óbitos registrados de menores de um ano, residentes em Aracaju, SE, Nordeste do Brasil, de 2001 a 2010. As desigualdades na mortalidade infantil foram avaliadas pela distribuição espacial do Índice de Condições de Vida estabelecido para os bairros, classiicados em quatro estratos. Foram comparadas as taxas de mortalidade infantil médias de 2001 a 2005 e 2006 a 2010 pelo teste t Student.
RESULTADOS: A taxa de mortalidade infantil média declinou de 25,3 de 2001 a 2005 para 17,7 óbitos/1.000 nascidos vivos, de 2006 a 2010. Apesar da queda nas taxas em todos os estratos na década, a desigualdade no risco de morte infantil aumentou nos bairros com piores condições de vida em relação àqueles de melhores condições.
CONCLUSÕES: A mortalidade infantil em Aracaju apresentou declínio, mas com importante assimetria entre os bairros. A averiguação sob a ótica das condições de vida pode justiicar as diferenças no risco de óbito infantil no espaço urbano, destacando as desigualdades em saúde na mortalidade infantil como fenômeno multidimensional.
DESCRITORES: Mortalidade Infantil, tendências. Condições Sociais. Disparidades nos Níveis de Saúde. Desigualdades em Saúde. Iniquidade Social. Saúde da Criança. Estudos Ecológicos.
INTRODUCTION
Infant mortality is uneven throughout Brazilian regions.21 The average IMR in Brazil in 2010 was
16.0/1,000 LB and the highest rates were found in the North (21.0/1,000 LB), Northeast (19.1 per thousand LB), and in the Midwest (15.9 per thousand LB) region. Sergipe (SE), Northeastern Brazil, presented an IMR of 18.2 deaths per thousand LB.c The urban
environ-ment wherein the child lives is considered to be a social determinant of the child’s health. The risk of death to which the child will be submitted during the irst year of life is associated with the demographic and socioeco-nomic indicators of where he/she lives, such as urban-ization, access to sanitation and housing, income level, and mother’s level of education.20 Therefore, indicators
composed of social variables are created to estimate the living conditions of the population5,20 and to contribute
to creating monitoring areas of social injustices.17
The objective of this study was to analyze the variation in infant mortality per living conditions.
a Organização Pan-Americana da Saúde. Saúde nas Américas: edição de 2012. Panorama regional e perfis de países. Washington (DC); 2012. b Organization for Economic Cooperation and Development. Infant Mortality. Health. Paris; 2012. (Key Tables from OECD, 9).
c Ministério da Saúde. DATASUS. Informações de Saúde: Tabnet. Brasília (DF); 2013 [cited 2013 Jun 27]. Available from: http://www2.datasus.
METHODS
Ecological population study based on the analysis of secondary data regarding deaths of children under the age of one (without differentiation between neonatal and post-neonatal components) living in Aracaju, SE, from 2001 to 2010. The period was divided into two ive-year periods (2001-2005 and 2006-2010) to analyze the vari-ation of infant deaths per indicator of living condition.
Aracaju, the capital of Sergipe, has 39 neighborhoods and an area of 181.8 km². In 2010, the city presented a Human Development Index (HDI) of 0.770, an urbanization rate of 100%, a population of 571,149 inhabitants,d and a total of 9,311 LB.c
Data from the Sistema de Informação de Mortalidade (SIM – Mortality Information System) and from the
Sistema de Informação de Nascidos Vivos (SINASC
– Live Births Information System) from Aracaju were used for the calculation of IMR. The IMR was calcu-lated in a direct way, given that Aracaju had an overall mortality rate greater than 5.3 and a percentage of ill-deined causes below 2.0% over the study period (97.5% for 2001-2005 and 97.8% for 2006-2010).6,19
The general IMR was calculated by dividing the number of deaths of children under the age of one by the total number of LB for every thousand LB.19 The speciic IMR
was calculated for each basic cause of death. The deter-mination of the basic cause of death followed the recom-mendations of the International Statistical Classiication of Diseases and Related Health Problems (ICD-10). The causes were grouped in accordance with a reduced list of compiled causes of infant death: perinatal problems (ICD-10: P00-P96), acute respiratory infections (ICD-10: J00-J39), diarrheal diseases (ICD-10: A00- A09), other infectious and parasitic diseases (ICD-10: A15-B99), congenital malformations (ICD-10: Q00-Q99), neoplasms (ICD-10: C00-C97), external causes (ICD-10: V01- Y98), and other causes (other codes ICD-10).
The elaboration of the Living Conditions Index (LCI) for each neighborhood was performed based on the demographic data from the 2010 census of the Brazilian Institute of Geography and Statistics (IBGE),d by means
of adapting the methodology described by Costa et al5
(2001), who used ive indicators related to the proxy vari-ables of living conditions. Two of the indicators were excluded for not having statistically signiicant differ -ences between the neighborhoods: average number of residents per household and percentage of households connected to the water supply network. Three indicators were used representing education, income, and housing: proportion of illiterate people who were heads of house-holds; proportion of households earning less than 1/4 of
the minimum wage per capita; and proportion of house-holds in subnormal clusters.
The LCI was established for each neighborhood, based on the aforementioned indicators. The organization of scores enabled the grouping of each district into four strata (quartiles), comprising relatively homogeneous areas of living conditions according to the inal score: “high” (3-24), “intermediate” (25-44), “low” (45-60), and “very low” (62-90). This stratiication was chosen to maintain the balance among the divisions as each stratum was composed of 25.0% of the observations. The irst three strata were composed of ten neighbor -hoods and the last one was composed of nine. The LCI was spatially distributed on the thematic map by means of the ArcGIS software (Figure 1), which makes the creation and the modeling of maps possible.
The Student’s t-test with p < 0.05 signiicance level was used to compare the average rates of infant mortality and speciic mortality during both periods.
This study was approved by the Ethics and Research Committee of Universidade Tiradentes (Protocol 060 711) and complied with all the recommendations of Resolution 466/2012 of the National Commission on Research Ethics.
RESULTS
The IMR decreased from 29.5 in 2001 to 17.7 deaths per thousand LB in 2010 (Figure 2). The average IMR decreased in all the living condition strata between the two ive-year periods. The strata “very low” and “high” were the ones with the highest reduction percentages (34.7% and 33.8%, respectively). Average infant mortality rates differed between the two periods in all the living condi-tion strata, except for the “intermediate” strata (Table 1).
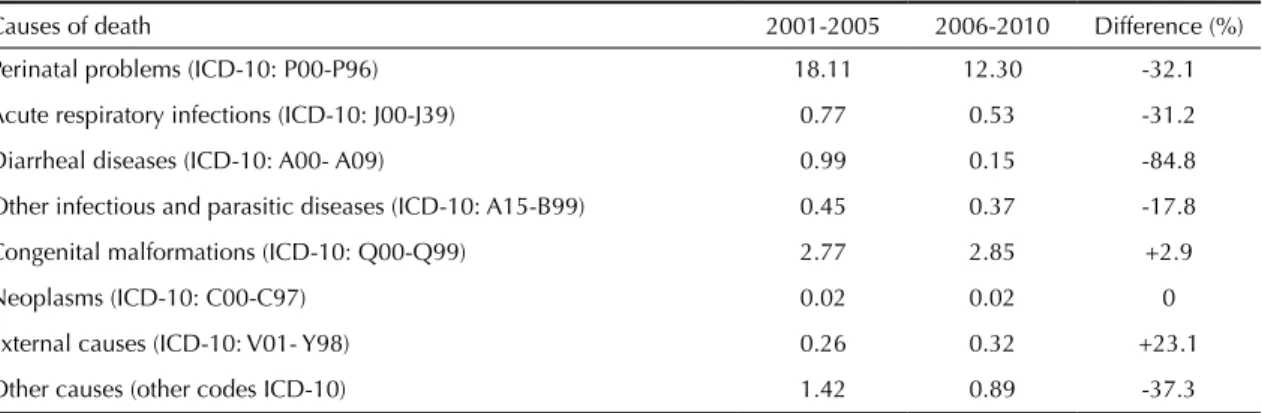
The main causes of death in 2001-2005 were perinatal problems, with an average IMR of 18.1 deaths per thou-sand LB, which signiicantly reduced during 2006-2010 to 12.3. Deaths from diarrheal causes and from other infectious and parasitic diseases have ceased to exist in the “high” strata. This did not occur in the other strata, despite the signiicant reduction (Table 3).
Deaths from diarrheal diseases showed the greatest reduction (-84.8%). The causes of infant mortality due to congenital malformations and external causes presented an increase over the study period (Table 2).
DISCUSSION
IMR decreased signiicantly between the two ive-year periods in Aracaju. This decrease has been associated
d Instituto Brasileiro de Geografia e Estatística. SIDRA Sistema IBGE de Recuperação Automática. Censo Demográfico e Contagem da
to improvements in access to prenatal care,21 water
supply,18 sanitation, and an increase of public
expen-diture on health in Brazil.22
The expansion of the Primary Health Care (PHC) in Brazil10,21 enables greater access to basic health
services by the population, which is important for prenatal, delivery and postpartum care, as well as child care after discharge from the hospital. The Estratégia
de Saúde da Família (Family Health Strategy) had an
important role in reducing child mortality in Brazilian municipalities from 1996 to 2004.4 The program’s
coverage in Aracaju went from 61.8% in 2002 to 84.8% in 2010.e The same occurred in Sao Paulo,
where the decrease in infant mortality was inluenced by the growth of GDP per capita and by the coverage provided by the Equipes de Saúde da Família (Family Health Teams) between 1998 and 2008.10 The
Figure 1. Spatial distribution of the Living Conditions Index according to strata in neighborhoods. Aracaju, SE, Northeastern Brazil, 2001 to 2010.
e Ministério da Saúde. Departamento de Atenção Básica. Brasília (DF); 2013 [citado 2013 Jun 27]. Available from: http://dab.saude.gov.br/
Figure 2. Infant mortality per thousand live births. Aracaju, SE, Northeastern Brazil, 2001 to 2010.
0
2001 29.5
22.5
23.1 22.4
20.0
16.5
17.4 16.8 17.7
28.9
2002 2003 2004 2005 2006 2007 2008 2009 2010
Infant mortality r
ate per thousand li
ve
births
5 10 15 20 25 30 35
Year
reorganization of the PHC in Colombia was associ-ated to a reduction of 19.0% of IMR between 2003 and 2007, primarily of deaths associated to socioeco-nomic inequalities and housing.13
The “high” strata showed lower average rates in comparison to other strata in the two periods, in the comparisons of the average and speciic IMR. This indicates inequalities in the occurrences of infant death between the strata, accentuated from 2006 to 2010, when the risk increased in the ”intermediate,” “low,” and “very low” strata in comparison to the previous period. Despite the slowing down of IMR in all the strata during that decade, inequality with regards to infant mortality increased in the areas with the worst living conditions in comparison to areas with better conditions. Maia et al11 (2012)
pointed to extreme inequalities in the proile of infant mortality in ive Brazilian municipalities of different regions. The inequalities were strongly associated with socioeconomic conditions and access to health services, becoming an indicator of lack of equality. The chances of death in children under the age of one, were also higher among children from disad-vantaged social classes in the United Kingdom from 1994 to 2011.23
In Belgium, from 1999 to 2008, 85.0% of deaths in children under the age of one occurred during the irst month of life (neonatal deaths), especially during the irst week, mainly due to perinatal problems related to prematurity.15 In Aracaju, from 2001 to 2010,
nearly 77.0% of deaths occurred in the irst month of life, and perinatal problems accounted for 70% of all infant deaths, rendering it the main cause of death.
The reduction in 32.0% of deaths due to perinatal causes, from 2006 to 2010, suggests an improvement in prenatal access and hospital care, especially in neonatal intensive care units.3,11,22
Congenital malformation was the second cause of death, accounting for about 13.0% of all deaths and the specific rate remained stable, with varia-tions among strata. The average IMR for this cause in the “intermediate” stratum went from 3.3 deaths per thousand LB in 2001-2005 to 4.3 in 2006-2010. Other Latin American studies showed percentage variations in the occurrence of congenital malfor-mations between 2.0% and 5.0%.1,3,7 Despite these
deaths being difficult to prevent, improvements in family planning and in prenatal care can contribute towards reducing them, since many anomalies are linked to environmental and nutritional factors related to the mother, such as the central nervous system.3 Other studies to determine the causes
would be required.
The average IMR due to diarrheal diseases from 2001 to 2005 is a strong indicator of inequality in health, greater in the “low” and “very low” strata. Moreover, the occurrence of this cause of death was sporadic from 2006 to 2010. The decrease of the rate per diarrheal causes was the greatest among all causes and may be associated to improvements in sanitation and greater access to health services.14
Table 1. Average infant mortality rate per thousand live births. Aracaju, SE, Northeastern Brazil, 2001 to 2005 and 2006 to 2010.
Living Condition Index
Average infant mortality rate
p*
2001-2005 2006-2010
High 20.7 13.7 0.020
Intermediate 23.1 18.4 0.100
Low 25.4 18.0 0.009
Very low 30 19.6 < 0.001
Aracaju, SE 25.3 17.7 0.002
* Student t test
Table 2. Specific average of mortality rate per 1,000 live births. Aracaju, SE, Northeastern Brazil, 2001 to 2005 and 2006 to 2010.
Causes of death 2001-2005 2006-2010 Difference (%)
Perinatal problems (ICD-10: P00-P96) 18.11 12.30 -32.1
Acute respiratory infections (ICD-10: J00-J39) 0.77 0.53 -31.2
Diarrheal diseases (ICD-10: A00- A09) 0.99 0.15 -84.8
Other infectious and parasitic diseases (ICD-10: A15-B99) 0.45 0.37 -17.8
Congenital malformations (ICD-10: Q00-Q99) 2.77 2.85 +2.9
Neoplasms (ICD-10: C00-C97) 0.02 0.02 0
External causes (ICD-10: V01- Y98) 0.26 0.32 +23.1
Other causes (other codes ICD-10) 1.42 0.89 -37.3
ICD-10: tenth revision of the International Classification of Diseases
The decrease suggests that most neighborhoods experi-enced improvements in sanitation and access to health services from 2006 to 2010, especially those classiied as having “low” and “very low” LCI. Nevertheless, despite the ample reduction, especially in the “high” stratum, the other strata showed deaths due to diarrhea, indicating that they possess important differences in health conditions in comparison to those with better living conditions.
There was a reduction in deaths due to respiratory causes, represented mainly by pneumonia, which like the diarrhea, is treatable through primary care.16 The
decrease in IMR from respiratory causes probably occurred due to improved access to health services, proper management of cases, and the use, within the public health system, of vaccine against Haemophilus inluenzae, an important causative agent of pneumonia in this age range.2
The increase of deaths in children under the age of one due to external causes,2 especially in the “low”
and “very low” LCI neighborhoods, indicates the issue of accidents and violence in this stratum of living conditions, showing the social and health inequalities to which the population is subject.17 In
the municipality of Cuiabá, upon studying infant
deaths due to external causes, it was noted that the more children in a family, the lower was the educa-tional level, and that the lower the mother’s age, the greater were the dificulties in preventing accidents within this age group.12
Given that this study was based on averages of social and demographic variables and on IMR itself, some limitations are inherent to this type of research. Local differences within the same neighborhood could become masked in the average, thus rendering them impossible to be made evident. However, despite it being a study using aggregated data, it is nonetheless extremely important for the assessment and planning of health care. The “low” and “very low” strata had the worst average rates, except for the analysis of congen-ital malformations, conirming that, despite progress, health inequalities persist in neighborhoods with the worst living conditions.
7
Causes of death
2001-2005 2006-2010
High Intermediate Low Very Low Aracaju High Intermediate Low Very Low Aracaju
Perinatal problems (ICD-10: P00-P96)
15.7 16.4 18.5 20.4 18.1 10.4 12.3 12.7 13.2 12.3
Congenital malformations (ICD-10:
Q00-Q99) 2.4 3.3 2.7 2.7 2.8 1.8 4.3 2.5 3.0 2.8
Acute respiratory infections (ICD-10:
J00-J39) 0.4 0.7 0.8 1.0 0.8 0.3 0.2 0.8 0.6 0.5
Diarrheal diseases (ICD-10: A00- A09)
0.2 0.7 1.1 1.6 1.0 – 0.2 0.2 0.1 0.1
Other infectious and parasitic diseases
(ICD-10: A15-B99) 0.4 0.3 0.5 0.5 0.5 – 0.2 0.3 0.4 0.3
Neoplasms (ICD-10: C00-C97)
– – 0.1 – – – – – 0.1 –
External causes (ICD-10: V01- Y98)
0.2 0.3 0.2 0.2 0.2 0.1 0.1 0.5 0.4 0.3
Other causes (other codes ICD-10)
1.0 1.0 1.1 2.3 1.4 1.0 0.8 0.8 1.0 0.9
1. Aguila A, Nazer J, Cifuentes L, Mella P, de la Barra P, Gutiérrez D. Prevalencia de malformaciones congénitas al nacer y factores asociados en Isla de Pascua, Chile (1988-1998). Rev Med Chile. 2000;128(2):162-6. DOI:10.4067/S0034-98872000000200005
2. Alves AC, França E, Mendonça ML, Rezende EM, Ishitani LH, Côrtes M CJW. Principais causas de óbitos infantis pós-neonatais em Belo Horizonte, Minas Gerais, Brasil, 1996 a 2004.
Rev Bras Saude Matern Infant. 2008;8(1):27-33.
DOI:10.1590/S1519-38292008000100004 3. Amorim MMR, Vilela PC, Santos ARVD, Lima ALM
V, Melo EFP, Bernardes HF, et al. Impacto das malformações congênitas na mortalidade perinatal e neonatal em uma maternidade-escola do Recife. Rev
Bras Saude Matern Infant. 2006;6(Suppl 1):19-25.
DOI:10.1590/S1519-38292006000500003 4. Aquino R, Oliveira NF, Barreto ML. Impact of the
Family Health Program on Infant Mortality in Brazilian Municipalities. Am J Public Health. 2009;99(1):87-93. DOI:10.2105/AJPH.2007.127480
5. Costa MC, Azi PA, Paim JS, Silva LM. Infant mortality and living conditions: the reproduction of social inequalities in health during the 1990s. Cad Saude Publica. 2001;17(3):555-67. DOI:10.1590/S0102-311X2001000300011 6. Frias PG, Szwarcwald CL, Lira PIC. Estimação
da mortalidade infantil no contexto de
descentralização do sistema único de saúde (SUS).
Rev Bras Saude Matern Infant. 2011;11(4):463-70.
DOI:10.1590/S1519-38292011000400013 7. García H, Salguero GA, Moreno J, Arteaga
C, Giraldo A. Frecuencia de anomalías congénitas en el Instituto Materno Infantil de Bogotá. Biomedica. 2003;23(2):161-72. DOI:10.7705/biomedica.v23i2.1208
8. Gurgel RG, Bohland AK, Vieira SCF, Oliveira DMP, Fontes PB, Barros VF, et al. Incidence of rotavirus and all-cause diarrhea in northeast Brazil following the introduction of a national vaccination program. Gastroenterology. 2009;137(6):1970-5. DOI:10.1053/j.gastro.2009.07.046
9. Gurgel RQ, Ilozue C, Correia JB, Centenari C, Oliveira SMT, Cuevas LE. Impact of rotavirus vaccination on diarrhoea mortality and hospital admissions in
Brazil. Trop Med Int Health. 2011;16(9):1180-4. DOI:10.1111/j.1365-3156.2011.02844.x 10. Lourenço EDC, Guerra LM, Tuon RA, Vidal e Silva
SMC, Ambrosano GMB, Corrente JE, et al. Variáveis de impacto na queda da mortalidade infantil no Estado de São Paulo, Brasil, no período de 1998 a 2008. Cienc Saude Coletiva. 2014;19(7):2055-62. DOI:10.1590/1413-81232014197.18822013 11. Maia LTS, Souza WV, Mendes ACG. Differences
in risk factors for infant mortality in five Brazilian cities: a case-control study based on the Mortality Information System and Information System on Live Births. Cad Saude Publica. 2012;28(11):2163-76. DOI:10.1590/S0102-311X2012001100016 12. Matos KF, Martins CBDG. Perfil epidemiológico
da mortalidade por causas externas em crianças, adolescentes e jovens na capital do Estado de Mato Grosso, Brasil, 2009.
Epidemiol Serv Saude. 2012;21(1):43-53.
DOI:10.5123/S1679-49742012000100005 13. Mosquera PA, Hernández J, Vega R, Martínez
J, Labonte R, Sanders D, et al. The impact of primary healthcare in reducing inequalities in child health outcomes, Bogotá-Colombia: an ecological analysis. Int J Equity Health. 2012;11:66. DOI:10.1186/1475-9276-11-66
14. Oliveira TCR, Latorre MRDO. Tendências da internação e da mortalidade infantil por diarréia: Brasil, 1995 a 2005. Rev Saude Publica. 2010;44(1):102-11. DOI:10.1590/S0034-89102010000100011
15. Pelfrene E, Cloots H, Hendrickx E. Infant mortality in the Flemish Region of Belgium 1999-2008: a time-to-event analysis. Arch Public Health. 2012;70(1):6. DOI:10.1186/0778-7367-70-6
16. Santos HG, Andrade SM, Birolim MM, Carvalho WO, Silva AMR. Mortalidade infantil no Brasil: uma revisão de literatura antes e após a implantação do Sistema Único de Saúde. Pediatr (São Paulo).
2010;32(2):131-43.
17. Silva JB, Barros MBA. Epidemiology and inequality: notes on theory and history. Rev
Panam Salud Publica. 2002;12(6):375-83.
DOI:10.1590/S1020-49892002001200003 18. Sousa TRV, Leite Filho PAM. Panel data
analysis of health status in Northeast Brazil.
Rev Saude Publica. 2008;42(5):796-804.
DOI:/10.1590/S0034-89102008005000047
REFERENCES
infant mortality as a multidimensional phenomenon that cannot be analyzed from a single perspective.
Despite the signiicant decrease in infant mortality in Aracaju, it still constitutes a serious problem in certain neighborhoods of the city. The actions of child health policies should consider the urban location, the char-acteristics of the locales and, social indicators to attain a more accurate estimate of the possible applicability of the resources available.
ACKNOWLEDGEMENTS
To the Secretaria de Planejamento of the city of Aracaju through its GIS department, for providing the thematic map of the city, whereby it was possible to spatially distribute the Living Conditions Index.
19. Szwarcwald CL, Leal MC, Andrade CLT, Souza PRB. Infant mortality estimation in Brazil: what do Ministry of Health data on deaths and live births say? Cad Saude Publica. 2002;18(6):1725-36. DOI:10.1590/S0102-311X2002000600027 20. Ventura RN, Oliveira EM, Silva EMK, Silva
NN, Puccini RF. Condições de vida e mortalidade infantil no município do Embu, São Paulo. Rev Paul Pediatr. 2008;26(3):251-7. DOI:10.1590/S0103-05822008000300009 21. Victora CG, Aquino EML, Leal MC, Monteiro
CA, Barros FC, Szwarcwald CL. Maternal and child health in Brazil: progress and
challenges. Lancet. 2011;377(9780):1863-76. DOI:10.1016/S0140-6736(11)60138-4
22. Volpe FM, Abrantes MM, Capanema FD, Chaves JG. The impact of changing health indicators on infant mortality rates in Brazil, 2000 and 2005.
Rev Panam Salud Publica. 2009;26(6):478-84.
DOI:10.1590/S1020-49892009001200002
23. Weightman AL, Morgan HE, Shepherd MA, Kitcher H, Roberts C, Dunstan FD. Social inequality and infant health in the UK: systematic review and meta-analyses. BMJ Open. 2012;2(3):e000964. DOI:10.1136/bmjopen-2012-000964
Research supported by the Coordenação de Aperfeiçoamento de Pessoal de Nível Superior (CAPES – Financial Aid – AUX-PE-PROSUP 2203/2010, Process 23038009763/201).
Based on the master’s thesis of Carvalho RAS, titled: “Avaliação das desigualdades na mortalidade infantil e assistência pré-natal em Aracaju/SE/Brasil”, presented to the Programa de Pós-Graduação em Saúde e Ambiente of the Universidade
Tiradentes, in 2013.