I1 1~~~~~~~~~~~Vol. 1, No. , 1980
Vol. 1, No. 41, 1980
Infant Mortality in the Americas
In this century, the concept of health as the intersec-toral product of a general process of development whose goal is the well-being of society has been endorsed by ex-perts in the social sciences throughout the world. The close relationship between the traditionally used health indicators-in particular, infant mortality and socio-economic factors-has been increasingly recognized, so much so that health indicators have become indicators of social development.
Infant mortality not only points to the occurrence of a biological phenomenon but also suggests conditions of housing, nutrition, education, environment, and other phenomena that characterize the style and quality of life of a particular society.
In recent years technologies have been developed that make it possible to prevent and successfully treat the diseases that cause the majority of infant deaths. Their use in the more advanced countries has brought about significant and steady declines in the mortality in the early age groups. In the developing countries, where deaths due to preventable discases of early childhood account for more than 60 per cent of the total, it has thus become possible to reduce mortality through the use of appropriate technologies.
Although almost all the Latin American countries have seen their infant mortality rates decline, they have not been able to narrow the gap that exists between them and the developed countries.
In analyzing the various goals established for the Americas in the 1960's, the Pan American Health
Orga-nization found that, in regard to the goal of reducing infant mortality, only a third of the proposed reduction of 50 per cent had been attained.' In the 1970's there was also a downward trend in almost the entire Region. but few countries succeeded in reaching the goal (Table 1). Around 1977, only 17 out of a total of 32 countries had reduced their rates by 20 per cent or more, while two others showed slight increases.
An analysis of infant mortality rates shows that, in general, the limitations of underdevelopment affect regis-tration systems. As a result, data are available for only 23 of 32 countries. It is also clear that some of the figures
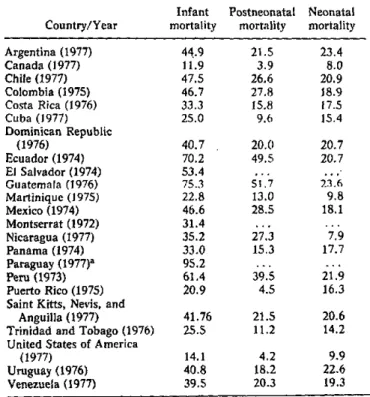
reflect substantial underregistration of vital events. Table 2 shows the information PAHO has received from the countries in recent years. Neonatal mortality (which includes deaths in infants aged 28 days or under) is more connected with biological factors (endogenous mortality), while postneonatal mortality is connected with socioeconomic factors derived froni adverse environ-mental conditions (exogenous mortality). This explains why neonatal mortality is considered more difficult to reduce, at least in the conditions prevailing in the Region of the Americas, since, to do so, major efforts are re-quired in developing institutionalized services of greater complexity. Postneonatal mortality can be substantially reduced through the application of primary health care
Pan American Health Organization. Facts on HeaIlth Progress. 1971. Scientific Publication 227. Washington, D.C.. 1971.
IN THIS ISSUE . . .
* Infant Mortality in the Americas
* Diseases Subject to the International Health Regulations · Smallpox Eradication
* Recent Influenza Activity * Tuberculosis in Costa Rica
* Status of Eastern Equine Encephalitis in Venezuela
* Human Salmonella Isolates-United States, 1979 * Cholera in the World in 1979
* Primary Resistance to Antituberculosis Drugs in Chile, 1978 * Pan American Center for Human Ecology and Hcalth * Reports of Meetings and Seminars
* Calendar of Seminars and Courses
Table 1. Infant mortality rates per 1,000 live births, around 1960, percentage variations.
1969, 1977 and total and
Variation Variation
Country 1960 1969 1977a 1960-1977a %
Argentina 62.4 61.1 44.9 -17.5 -28.0
Canada 27.3 19.3 11.9 -14.9 -54.6
Chile 120.3 78.7 47.5 -72.8 -60.5
Colombia 99.8 71.4 46.7 -53.1 -53.2
Costa Rica 68.6 67.1 27.8 -40.8 -59.5
Cuba 35.4 47.7 25.0 -10.4 -29.4
Dominican Republic 100.6 61.9 40.7 -59.9 -59.5
El Salvador 76.3 63.3 53.4 -22.9 -30.0
Guatemala 91.9 91.3 75.3 -22.2 -24.2
Mexico 74.2 66.7 54.7 -27.6 -37.2
Nicaragua 70.2 54.4 35.2 -35.0 -49.9
Panama 56,9 39.9 33.0 -23.9 -42.0
Paraguayb 90.7 91.1 95.2 + 4.5 + 5.0
Peru 92.1 68.9 72.4 -30.7 -33.3
Puerto Rico 43.7 29.7 20.9 -22.8 -52.2
Trinidad and Tobago 45.4 39.8 25.5 -19.9 -43.8 United States of America 26.0 20.9 14.1 -11.9 -45.8
Uruguay 47.4 48.7 40.8 - 6.6 -13.9
Venezuela 52.9 46.9 39.5 13.4 -25.3
aAround 1977. bReporting area.
measures; accordingly, the study of this mortality is of interest in defining levels of infant health.
As may be seen from Table 2, in ten countries of the Americas neonatal mortality is still higher than post-neonatal mortality. But this obviously does not mean that the greater efforts should now be concentrated on perinatal care.
Table 3 shows the leading causes of death by order of importance in infants under 1 year of age in the Ameri-cas in 1969 and 1975. The harmful environmental factors that cause deaths are expressed, inter alia, in diseases such as enteritis, diarrheal diseases, influenza, and
pneu-monia.
Deaths due to infectious and parasitic diseases fell from 693 per 100,000 population to 484 (30 per cent) be-tween 1972 and 1975. This reduction was probably due in part to the lower mortality from enteritis and other diarrheal diseases, which are an important component of the group of infectious and parasitic diseases that are responsible for a high percentage of deaths in children under 1 year of age in many Latin American countries.
Mortality from respiratory diseases fell from 470 per 100,000 population in 1972 to 361 (23 per cent) in 1975. Those due to congenital anomalies and diseases of early childhood declined by 15 per cent during the same period (from 299 to 253 per 100,000 population). Mortality from ill-defined causes and the remaining diseases fell by 26 *nd 12 per cent, respectively.
Table 2. Mortallty rates in chlldren under 1 year of age per 1,000 live births in 23 countries in the Americas (most recent year for which data are available).
Infant Postneonatal Neonatal Country/Year mortality mortality mortality
Argentina (1977) 44.9 21.5 23.4
Canada (1977) 11.9 3.9 8.0
Chile (1977) 47.5 26.6 20.9
Colombia (1975) 46.7 27.8 18.9
Costa Rica (1976) 33.3 15.8 17.5
Cuba (1977) 25.0 9.6 15.4
Dominican Republic
(1976) 40.7 20.0 20.7
Ecuador (1974) 70.2 49.5 20.7
El Salvador (1974) 53.4 ...
Guatemala (1976) 75.3 51.7 23.6
Martinique (1975) 22.8 13.0 9.8
Mexico (1974) 46.6 28.5 18.1
Montserrat (1972) 31.4 ...
Nicaragua (1977) 35.2 27.3 7.9
Panama (1974) 33.0 15.3 17.7
Paraguay (1977)a 95.2
Peru (1973) 61.4 39.5 21.9
Puerto Rico (1975) 20.9 4.5 16.3
Saint Kitts, Nevis, and
Anguilla (1977) 41.76 21.5 20.6
Trinidad and Tobago (1976) 25.5 11.2 14.2 United States of America
(1977) 14.1 4.2 9.9
Uruguay (1976) 40.8 18.2 22.6
Venezuela (1977) 39.5 20.3 19.3
a Reporting area. ... No data available.
Table 3. Leading causes of death In children under 1 year of
age in North America, MIddie America, and South America,
around 1969 and 1975.
North America
Cause %
1 57.1
2 15.5
3 9.4
5 3.5
4 1.2
7 13.3
Total 100.0
Nornh America
Cause %
1 52.2
2 17.4
3 4.4
5s 2.9 4 1.4 7 21.7 Total 100.0
1969 Middle America
Cause %
3 22.9
4 22.2
1 17.4
2 2.8
8 2.5
7 32.2
Total 100.0
1975 Middle America
Cause %
4 22.4
3 21.0
1 18.2
2 3.3
6 2.5
7 32.6
Total 100.0
South America
Cause %
3 19.7
1 18.6 4 16.5 6 6.3 2 3.5 7 35.4 Total 100.0
South America
Cause % 1 21.1
3 17.8 4 17.1 6 4.7 2 4.4 7 34.9 Total 100.0
1. Causes of perinatal 5. Accidents
mortality 6. Bronchitis, emphysema and 2. Congenital anomalies asthma
3. Influenza and pneumonia 7. Other diseases 4. Enteritis and other diarrheal 8. Avitaminosis and other
diseases nutritional deficiencies
Source: Pan American Health Organization. Las condiciones de
salud del niño en las Américas. Scientific Publication 381.
Wash-ington, D.C., 1979.
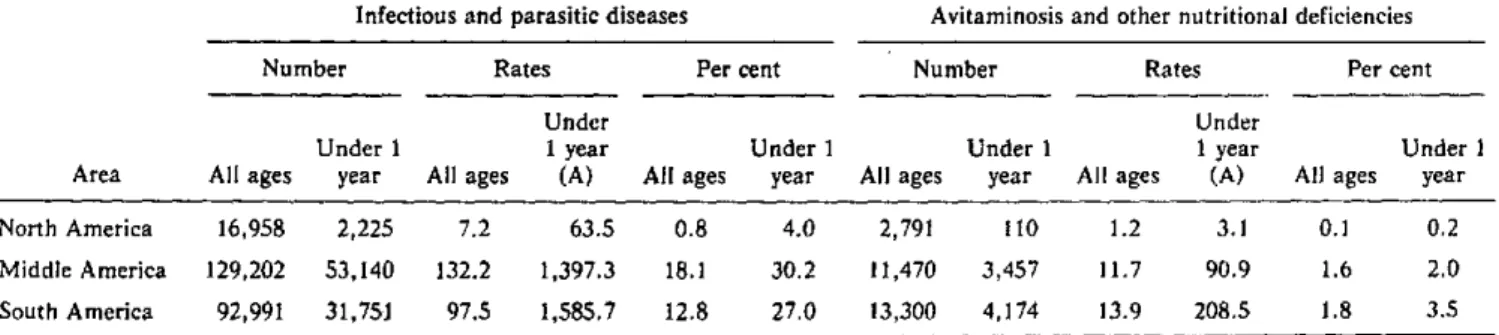
In South America and Middle America deaths from infectious and parasitic diseases, expressed as percent-ages, were approximately seven times higher than in
North America for the age group 0-1 year. The data are for around 1975 (Table 4). Adverse environmental effects and limited access to primary health care services are the probable direct causes of this excess of deaths.
Mortality from malnutrition is undoubtedly a deter-mining cause that is often not identified as such but which underlies another final diagnosis of the cause of death.
Despite this obvious underregistration, it should be pointed out that malnutrition is among the five leading causes of death in 19 out of 29 countries in the Americas, according to data available for 1975 for the age group under 1 year.
Table 4 shows thc deaths fron ihis (liscase ii lihrcc subregions of the Americas, based on data provided by 29 countries, around 1975.
The Inter-American Investigation of Mortality in Childhood2 found that the rate for all types of nutritional deficiencies reached a peak in children aged 2-3 months of age and then declined in the older age groups. The fre-quency of protein nialnutrition steadily increased and reached its peak in children aged 12-16 months, and then declined toward the end of the second year of life.
(Source: Maternal and Child Health Program, Division of Comprehensive Health Services, PAHO)
2 Puffer, R. R. and C.V. Serrano, Patlerns o/ Mortlilty iii Chihllhood.
PAHO Scientific Publication 262. Washington. D.C.. 1973.
Table 4. Number of deaths from infectious and parasitic diseases, avitaminosis and other nutritional deficiencies in children under 1 year of age, wlth rates per 100,000 population, and as a percentage of all deaths (around 1975).
Infectious and parasitic diseases Avitaminosis and other nutritional deficiencies
Number Rates Per cent Number Rates Per cent
Under Under
Under 1 1year Under 1 Under 1 1 year Under 1
Area All ages year All ages (A) All ages year All ages year All ages (A) All ages year
North America 16,958 2,225 7.2 63.5 0.8 4.0 2,791 110 1.2 3.1 0.1 0.2
Middle America 129,202 53,140 132.2 1,397.3 18.1 30.2 11,470 3,457 11.7 90.9 1.6 2.0 South America 92,991 31,751 97.5 1,585.7 12.8 27.0 13,300 4,174 13.9 208.5 1.8 3.5
Source: Pan American Health Organization. Las condiciones de salud del niño las Américas. Op. Cit.