l ABSTRACTS AND REPORTS 73
INFANT MORTALITY IN THE AMERICAS
In this century, the concept of health as the
intersectoral product of a general process of
development whose goal is the well-being of
society has been endorsed by experts in the
social sciences throughout the world. The
close relationship between the traditionally
used health indicators-in particular infant
mortality and socioeconomic factors-has
been increasingly recognized, so much so that
health indicators have become indicators of
social development.
Infant mortality not only points to the oc-
currence of a biological phenomenon but also
suggests conditions of housing, nutrition, edu-
cation, environment, and other phenomena
that characterize the style and quality of life of
a particular society.
In recent years technologies have been
developed that make it possible to prevent and
successfully treat the diseases that cause the
majority of infant deaths. Their use in the
more advanced countries has brought about
significant and steady declines in mortality
among young age groups. In the developing
countries, where deaths due to preventable
diseases of early childhood account for more
than 60 per cent of the total, it has thus
become possible to reduce mortality through
the use of appropriate technologies. Although
almost all the Latin American countries have
seen their infant mortality rates decline, they
have not been able to narrow the gap that
exists between themselves and the developed countries.
In analyzing the various goals established
for the Americas in the 196Os, the Pan Ameri-
can Health Organization found that, in
regard to the goal of reducing infant mortali-
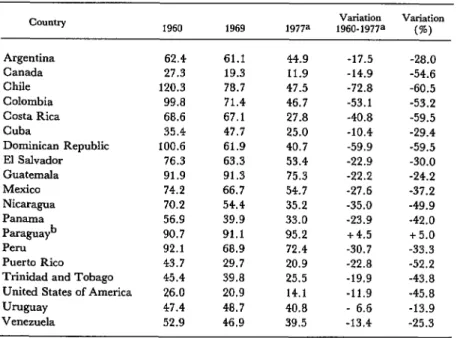
Table 1. Infant mortality per 1,000 live births, around 1960, 1969, and 1977 and the net change in 1960-1977.
COUIltry Variation Variation
1960 1969 1977= 1960-1977= (%)
Argentina 62.4 61.1 44.9 -17.5 -28.0
Canada 27.3 19.3 11.9 -14.9 -54.6
Chile 120.3 78.7 47.5 -72.8 -60.5
Colombia 99.8 71.4 46.7 -53.1 -53.2
Costa Rica 68.6 67.1 27.8 -40.8 -59.5
Cuba 35.4 47.7 25.0 -10.4 -29.4
Dominican Republic 100.6 61.9 40.7 -59.9 -59.5
El Salvador 76.3 63.3 53.4 -22.9 -30.0
Guatemala 91.9 91.3 75.3 -22.2 -24.2
Mexico 74.2 66.7 54.7 -27.6 -37.2
Nicaragua 70.2 54.4 35.2 -35.0 -49.9
Panama 56.9 39.9 33.0 -23.9
Paraguayb
-42.0
90.7 91.1 95.2 i-4.5 f 5.0
Peru 92.1 68.9 72.4 -30.7 -33.3
Puerto Rico 43.7 29.7 20.9 -22.8 -52.2
Trinidad and Tobago 45.4 39.8 25.5 -19.9 -43.8
United States of America 26.0 20.9 14.1 -11.9 -45.8
UNguay 47.4 48.7 40.8 - 6.6 -13.9
Venezuela 52.9 46.9 39.5 -13.4 -25.3
74 PAHO BULLETIN l vol. 15, no. 1, 1981
ty, only a third of the proposed reduction of 50
per cent had been attained.’ In the 1970s
there was again a downward trend in almost
the entire Region, but few countries suc-
ceeded in reaching the goal (Table 1). By
around 1977, only 17 out of a total of 32 coun- tries had reduced their rates by 20 per cent or
more, while two others showed slight in-
creases.
An analysis of infant mortality rates shows
that, in general, the limitations of underdevel-
opment affect registration systems. As a
result, data are available for only 23 of 32
countries. It is also clear that some of the
‘Pan American Health Organization, Facls on Health
Progms: IY71, PAHO Scientific Publication 227, Wash- ington, D.C., 1971.
figures reflect substantial underregistration of
vital events.
Table 2 shows the information PAHO has
received from the countries in recent years.
Neonatal mortality, which includes deaths
among infants 28 days of age or less, is more
connected with biological factors (“endoge-
nous” mortality), while postneonatal mortali-
ty is connected with socioeconomic factors
derived from adverse environmental condi-
tions (‘ ‘exogenous’ ’ mortality). This explains
why neonatal mortality is considered more
difficult to reduce, at least under the condi-
tions prevailing in the Region of the Ameri-
cas, since doing so would require major efforts
to develop institutionalized services of greater
complexity. Postneonatal mortality can be
substantially reduced through the application
Table 2. Mortality among children under 1 year of age per 1,000 live births in 23 countries in the Americas (most recent year for
which data are available).
Country/year mortality Infant Postneonatal
mortality Neonatal mortality Argentina (1977)
Canada (1977) Chile (1977) Colombia (1975) Costa Rica (1976)
Cuba (1977)
Dominican Republic (1976) Ecuador (1974)
El Salvador (1974) Guatemala (1976) Martinique (1975) Mexico (1974)
Montserrat (1972)
Nicaragua (1977) Panama (1974) Paraguay (i977)a Peru (1973) Puerto Rico (1975) Saint Kitts, Nevis, and
Anguilla (1977)
Trinidad and Tobago (1976) United States of America (1977) Uruguay (1976)
Venezuela (1977)
44.9 11.9 47.5 46.7 33.3 25.0 40.7 70.2 53.4 75.3 22.8 46.6 31.4 35.2 33.0 95.2 61.4 20.9 41.76 25.5 14.1 40.8 39.5
21.5 23.4
3.9 8.0
26.6 20.9
27.8 18.9
15.8 17.5
9.6 15.4
20.0 20.7
49.5 20.7
. . 51.7 13.0 28.5 . . . 23.6 9.8 18.1 . . . 27.3 15.3 . . 7.9 17.7 . . . 39.5 4.5 . . . 21.9 16.3
21.5 20.6
11.2 14.2
4.2 9.9
18.2 22.6
20.3 19.3
l ABSTRACTS AND REPORTS 75
Table 3. Leading causes of death among children under 1 year of age in North America, Middle America, and South America,
around 1969 and 1975. 1969 North America Middle America
CaW3 % CaWZ. %
South America
Cause %
1 57.1 3 22.9 3 19.7
2 15.5 4 22.2 1 18.6
3 9.4 1 17.4 4 16.5
5 3.5 2 2.8 6 6.3
4 1.2 a 2.5 2 3.5
7 13.3 7 32.2 7 35.4
Total 100.0 Total 100.0 Total 100.0
1975 North America
Cause %
Middle America
CalMe %
South America
Callse %
1 52.2 4 22.4 1 21.1
2 17.4 3 21.0 3 17.8
3 4.4 1 la.2 4 17.1
5 2.9 2 3.3 6 4.7
4 1.4 6 2.5 2 4.4
7 21.7 7 32.6 7 34.9
Total 100.0 Total 100.0 Total 100.0
causes of perinatld mortality: 1. Congenital anomalies 2. Influenza and pneumonia
3. Enteritis and other diarrheai diseases 4. Accidents
5. Bronchitis, emphysema, and asthma 6. Other diseases
7. Avitaminosis and other nutritional deficiencies
Source: Pan American Health Organization, Las condicimes de s&d &I niiio en 1a.r ArGtic~. PAHO Scientific Publication 381, Washington, D.C., 1979.
of primary health care measures; accordingly,
the study of this mortality is of interest in
defining levels of infant health.
As may be seen from Table 2, in 10 coun-
tries of the Americas neonatal mortality is still
higher than postneonatal mortality. But this
obviously does not mean that the greater ef-
forts should not be concentrated on perinatal
care.
Table 3 shows the leading causes of death
by order of importance in infants under 1 year
of age in the Americas during 1969 and 1975.
The harmful environmental factors that cause
deaths are expressed, inter alia, in data on
diseases such as enteritis, other diarrheal dis-
eases, influenza, and pneumonia.
76 PAHO BULLETIN l VOW. 15, no. 1, 1981
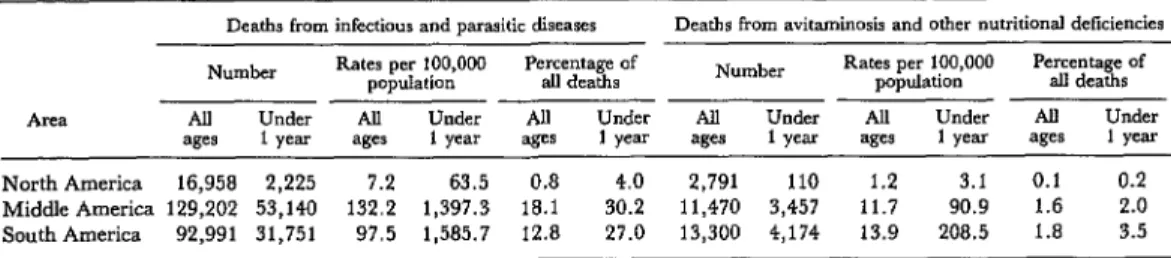
Table 4. Numbers of infant and overall deaths from infectious and parasitic diseases, avitaminosis and other nutritional deficiencies, around 1975.
Deaths from infectious and parasitic diseases Deaths from avitaminosis and other nutritional deficiencies
Number Rates per 100,000 Rates per 100,000 Percentage of population P’r$m~?e~Of Number population dl deaths
ARZI All Under AU Under All Under All Under AU Under All Under
ages 1 year ages 1 year ages 1 year ages 1 year ages 1 year ages 1 year
North America 16,958 2,225 7.2 63.5 0.8 4.0 2,791 110 1.2 3.1 0.1 0.2
Middle America 129,202 53,140 132.2 1,397.3 18.1 30.2 11,470 3,457 11.7 90.9 1.6 2.0
South America 92,991 31,751 97.5 1,585.7 12.8 27.0 13,300 4,174 13.9 208.5 1.8 3.5
Sourw Pan American Health Organization, Las condiciona dc s&d dcl nitio m lartlmtricar, PAHO Scientific Publication 381, Washington, D.C , 1979.
population to 484, between 1972 and 1975.
This reduction was probably due in part to
lower mortality from enteritis and other diar-
rhea1 diseases, which are an important compo-
nent of the group of infectious and parasitic
diseases responsible for a high percentage of
deaths in children under 1 year of age in many
Latin American countries.
Mortality from respiratory diseases fell 23
per cent, from 470 per 100,000 population in
1972 to 361 in 1975. Deaths due to congenital
anomalies and diseases of early childhood
declined by 15 per cent during the same
period (from 299 to 253 per 100,000 popula-
tion). Mortality from ill-defined causes and
the remaining diseases fell by 26 and 12 per
cent, respectively.
In South America and Middle America
deaths from infectious and parasitic diseases,
expressed as percentages, were approximately
seven times higher than in North America for the age group O-l year. The data relate to the
period around 1974 (Table 4). Adverse en-
vironmental effects and limited access to pri-
mary health care services are the probable direct causes of this excess of deaths.
Mortality from malnutrition is undoubtedly
a determining cause that is often not identified
as such but that underlies some other diag-
nosed cause of death. Despite this obvious
underregistration, it should be pointed out
that malnutrition is among the five leading
causes of death among those under 1 year of age in 19 out of 29 countries in the Americas, according to data available for 1975.
Table 4 shows the deaths from this disease
in three subregions of the Americas, based on
data provided by 29 countries, around 1975.
The Inter-American Investigation of Mor-
tality in Childhood” found that the rate of
death from all types of nutritional deficiencies
reached a peak in children 2-3 months of age
and then declined in the older age groups.
However, the frequency of protein malnutri-
tion increased steadily, reaching its peak in
children 12-16 months of age and then declin- ing toward the end of the second year of life.
“R. R. Puffer and C. V. Scrrano, Pafttms ofA&altly zn
Childhood, PAHO Scientific Publication 262, Pan American Health Organization, Washington, D.C.,
1973.
Source: Pan American Health Organization, Epidemio- logkul Bulletin 1(4):1-3, 1980. Based on material provided