Principal components and
generalized linear modeling
in the correlation between
hospital admissions and air
pollution
Componentes principais e
modelagem linear generalizada
na associação entre atendimento
hospitalar e poluição do ar
I Programa de Pós-Graduação em Engenharia
Ambiental. Univesidade Federal do Espírito Santo. Vitória, ES, Brasil
II Departamento de Estatística. Universidade
Federal do Espírito Santo. Vitória, ES, Brasil
III Departamento de Estatística. Universidade
Federal de Minas Gerais. Belo Horizonte, MG, Brasil
Correspondence: Juliana Bottoni de Souza
Rua Manoel Coutinho, 175 Porto de Santana 29153-020 Cariacica, ES, Brasil
E-mail: [email protected] Received: 8/5/2013
Approved: 2/14/2014
Article available from: www.scielo.br/rsp
ABSTRACT
OBJECTIVE: To analyze the association between concentrations of air pollutants and admissions for respiratory causes in children.
METHODS: Ecological time series study. Daily figures for hospital admissions of children aged < 6, and daily concentrations of air pollutants
(PM10, SO2, NO2, O3 and CO) were analyzed in the Região da Grande
Vitória, ES, Southeastern Brazil, from January 2005 to December 2010. For statistical analysis, two techniques were combined: Poisson regression with generalized additive models and principal model component analysis. Those
analysis techniques complemented each other and provided more signiicant
estimates in the estimation of relative risk. The models were adjusted for temporal trend, seasonality, day of the week, meteorological factors and
autocorrelation. In the inal adjustment of the model, it was necessary to
include models of the Autoregressive Moving Average Models (p, q) type in the residuals in order to eliminate the autocorrelation structures present in the components.
RESULTS:For every 10:49 μg/m3 increase (interquartile range) in levels of
the pollutant PM10 there was a 3.0% increase in the relative risk estimated using the generalized additive model analysis of main components-seasonal autoregressive – while in the usual generalized additive model, the estimate was 2.0%.
CONCLUSIONS:Compared to the usual generalized additive model, in
general, the proposed aspect of generalized additive model − principal
component analysis, showed better results in estimating relative risk and
quality of it.
DESCRIPTORS: Air Pollution, adverse effects. Patient Admission. Hospitalization. Respiratory Tract Diseases, epidemiology. Time Series Studies. Ecological Studies.
Juliana Bottoni de SouzaI
Valdério Anselmo ReisenII
Jane Méri SantosI
The impact of air pollution on human well-being is the main motivation behind its study and control. Air pollu-tion affects the populapollu-tion’s health, even when levels are below those set by legislation.6 Studies have
indi-cated signiicant associations between daily levels of
pollutant concentration and admissions for respiratory or cardiovascular causes,2,4,10,11 among others. The lungs
are the main target of air pollution attack, especially in the case of the principal offenders: particulate matter (PM10), sulfur dioxide (SO2) and (O3).
Poisson regression with generalized additive models is a statistical tool used to measure and quantify the association between air pollutants and adverse health effects, given the characteristics of the health outcome variable (hospital admission). In this meth-odology, the co-variables (pollutants) are included in the regression model individually, although the pollut-ants are co-related. Another alternative is to analyze
RESUMO
OBJETIVO: Analisar a associação entre concentrações dos poluentes atmosféricos e atendimentos diários por causas respiratórias em crianças.
MÉTODOS: Estudo ecológico de série temporal. Foram analisadas as contagens diárias de admissões hospitalares de crianças < 6 anos e as
concentrações diárias de poluentes atmosféricos (PM10, SO2, NO2, O3 e
CO), na Região da Grande Vitória, ES, de janeiro de 2005 a dezembro de 2010. Foram combinadas duas técnicas para a análise estatística: modelo de regressão de Poisson em modelos aditivos generalizados e análise de componentes principais. Essas técnicas complementaram-se e forneceram estimativas mais expressivas na estimação do risco relativo. Os modelos foram ajustados para efeitos da tendência temporal, sazonalidade, dias da semana, fatores meteorológicos e autocorrelação. No ajuste final do
modelo, foi necessária a inclusão de modelos do tipo Autoregressive
Moving Average Models (p,q) nos resíduos, para eliminar as estruturas de autocorrelação presente nas componentes.
RESULTADOS: O aumento de 10.49 μg/m3 (intervalo interquartílico) nos níveis
do poluente PM10 resultou num aumento de 3,0% do valor do risco relativo
estimado por meio do modelo aditivo generalizado – análise de componentes principais-sazonal autorregressivo –, enquanto no modelo aditivo generalizado usual a estimativa foi de 2,0%.
CONCLUSÕES:Em comparação ao modelo aditivo generalizado usual, em geral, a vertente proposta do modelo aditivo generalizado – análise de componentes principais apresentou melhores resultados na estimativa do risco relativo e na qualidade do ajuste.
DESCRITORES: Poluição do Ar, efeitos adversos. Admissão do Paciente. Hospitalização. Doenças Respiratórias, epidemiologia. Estudos de Séries Temporais. Estudos Ecológicos.
INTRODUCTION
the principal components of the covariance matrix of pollutants. Evaluating adverse health effects through a combination of pollutants may be easier to interpret and more viable than isolating the effects of one single pollutant. This aspect of the research is current and relevant, and has been previously explored.7,11 Roberts
& Martins7 (2006) evaluated the association of PM 10,
O3, SO2, NO2 and CO pollutants and their effects on health. The problem of multi-co-linearity (correlation between the pollutants) is solved by principal compo-nent analysis (PCA). This is a multiple analysis statis-tical technique used to reduce dimensionality in a data set while preserving maximum variability of the co-variables,4 allowing pollutants to be grouped into
of the pollutants on daily mortality was analyzed by
Wang & Pham11 (2011), using the PCA and a robust
method. The results show more expressive estimates of relative risk (RR) when applied to the PCA multiple analysis technique, evidencing stronger associations between the variables.
Using the PCA requires data obtained through indepen-dent replications. However, when using them to make statistical inferences, due attention needs to be paid to co-variables correlated in time, such as air pollutants.
Statistical stationarity must be satisied. The principal
components are linear combinations of the co-vari-ables, the properties of which are transferred linearly to the components.
The effect of the correlations on the inferential context
has been studied by Zamprognoa and theoretically and
empirically shows the temporal correlation effect of the co-variables when this procedure is neglected. In proposition 1, the author shows that the components are temporally correlated. PCA in regression should be used with caution, as it bears the temporal structure of the variables.
The aim of this study was to analyze the association between concentrations of air pollutants and daily hospital admissions of children for respiratory causes.
METHODS
This was an ecological time series study. The hospital admissions of 59,353 children aged < 6 in Grande Vitória, ES, between January 1, 2005 and December 31, 2010,
were analyzed. Data were obtained from the Hospital
Infantil Nossa Senhora da Glória children’s hospital (HINSG) records, where the main children’s emergency room for the Grande Vitória region is based. Respiratory
disease was classiied according to the International Classiication of Diseases (ICD-10) categories.
Data on daily pollutant levels – particulate matter (PM10), sulfur dioxide (SO2), nitrogen monoxide (NO2),
ozone (O3) and carbon monoxide (CO) – and the
mete-orological variables were obtained from the Instituto
Estadual de Meio Ambiente e Recursos Hídricos
(IEMA – State Institute for the Environment and Water Resources), measured and collected at eight monitoring stations from the air quality automatic monitoring network (RAMQAr).
The data collection included the 24h period for all of
the pollutants and began in the irst half hour of the
day. The 24h mean for PM10 and SO2 and 8h moving
average for CO and O3 were considered, as was the 24h
maximum for NO2 from each station. The daily mean of
the variables from all the stations were the co-variables used in the generalized additive model (GAM) and its extension, the GAM-PCA. The atmospheric variables
were measured in μg/m3 and the meteorological
vari-ables (temperature and relative humidity) measured in their units (ºC and %, respectively).
The variables in question were modelled using time series, regression models and multiple analysis tech-niques. The aspects of the GAM enabled parametric and non-parametric functions in adjusting the mean data curve. The outcome was modelled assuming that the basic distribution of the number of health events (hospital admissions) followed Poisson distribution. The daily number of admissions for respiratory disease was the dependent variable, and the daily concentra-tions of air pollutants the independent variables. A common characteristic of the variables was missing observations, either due to incorrect measurements, equipment failure or invalid measurements, among others. These variables were adjusted using imputa-tion, as described by Junger,b in which the estimates
are obtained using spatial correlation between the levels of pollutant and by autocorrecting of the levels of this pollutant.
The models were analyzed and adjusted in stages. Seasonality was of short duration with indicator vari-ables for days of the week and holidays. The “loess”
smoothing function2 was used for long-term
season-ality. This enables non-linear dependence between the variables in question (admissions) and seasonality to be controlled. The confounding co-variables (temperature and relative humidity) were modelled using smoothing “splines”.2,10 The principal components were calculated
using a covariance matrix of the pollutants in question.
PCA multiple analysis was used to evaluate the joint effects of the pollutants, eliminating correlation between them and the simultaneous effect of the pollut-ants was investigated. The regression model used was the GAM and its extension, the GAM-PCA. The effects of pollution on health were calculated using RR, which expresses the probability of an individual developing a disease relative to exposure to a risk factor. The RR estimate was used to compare the proposed models,
RR was obtained by solving a system of equations from the GAM model and applying PCA. The results consider the interquartile variations of the pollutants and were calculated by %RR = (RR - 1)*100.
a Zamprogno B. Análise de componentes principais no domínio do tempo e suas implicações em dados autocorrelacionados [doctoral thesis].
Vitória: Programa de Pós-Graduação em Engenharia Ambiental do Centro Tecnológico da UFES; 2013.
b Junger WL. Análise, Imputação de dados e interfaces computacionais em estudos de séries temporais epidemiológicas [doctoral thesis].
GAM13 with marginal Poisson distribution is usually
reported in analyzing the association between the outcome variable and the explanatory co-variables. It is widely used as non-linear modelling describes the relationship between the variables in question.1,2,8,9
When {Yt}, t = 1,..., N, a time series count formed of non-negative integers. The conditional density of {Yt} given Ƒt-1, shown by Yt / Ƒt-1, possesses Poisson distribu-tion, with a mean µt , the following equation is satisied:
ƒ(yt ; µt / Ƒt-1) = e
-µt µ
t yt
yt ! , t = 1,..., N. (1)
when X = [x1, ... , xp]' (2)
The vector of dimension p of the co-variables which can include previous values Yt as well as other auxiliary data, such as the pollutants, confounding variables (trends, seasonality and meteorological variables among others).5
The curve which describes the relationship between Yt
and X, the co-variance vector, is obtained by the loga-rithmic transformation of µt :
log (µt) =
∑
βj Xj +∑
ƒ(xj)j = 0 j = q + 1
p q
with q ≤ p (3)
When βj is the vector of the coeficients to be estimated (co-variables) and ƒ(xj) are the smoothing functions for the confounding variables (temperature and humidity) and long-term seasonality present in the data. β0 corre-sponds to the intercept of the curve associated with the vector of unitary values.
RR is a measure often used in epidemiological studies to measure the impact of the concentration of air pollut-ants on the health of the exposed population. RR can
be deined as the relationship of the probability of an
event occurring after certain exposure to a risk factor, in the case of this study, exposure to concentrated levels of air pollutants. In the case of the GAM model with marginal Poisson distribution, RR(x) is estimated using the following formula:12
RR(x = ξ) = e(ξ β )
with i= 1, 2,..., p (4)
In which ξ is the variation in the concentrations of the pollutant which can, for example, assume the value
10 µg/m3, of the interquartile variation, among others,
and is the estimated coeficient associated with the
pollutant being studied. When the level of signii
-cance is α, the hypothesis to be tested is deined as
H0: RR(x) = 1 against H1: RR(x) > 1. Not rejecting H0 statistically implies that the pollutant studied does not adversely affect health.
PCA is a statistical multi-analysis technique that aims to reduce the dimensionality of the data’s matrix space by linear transformation of the original variables.
Correlation between the variables implies multi-colin-earity is occurring in the regression models. In this article, the PCA technique was used to solve a problem of correlation between the pollutants, the variability of
the system as determined by k variables can only be
explained for k principal components. However, a large
part of this variability may be explained by a lower r
number of components, r ≤ k.4
When (λ1, α1), (λ2, α2), ... , (λk, αk ) the eigenvalues
-eigen-vectors pairs, respectively, of the Σ matrix of covari -ance of the X vector. The i-th principal component of
Σ is given by
CPi = α'
ix = αi1x1 + αi 2x2 + ... + αikxk, i = 1, 2, ... , k. (5)
The co-variables produced by applying PCA, deined
here as PC, are linear combinations of the original envi-ronmental variables. Including new co-variables in the
GA < model is deined using the following formula:
log (µt) =
∑
νi CPi +∑
ƒ(xi)i = 0 i = q + 1
p q
with q ≤ p (6)
In which νi is the estimated vector of the principal
components (PC) and ƒ(xi ) are the smoothing
func-tions for the confounding variables (temperature and humidity). The estimated RR for model 6 is given by:
RR (x = ξ) = e(ξ νi)
with i= 1, 2,..., p (7)
In which ξ is the variation in concentration of the pollutant given by the interquartile variation. is repre-sented by the expression:
∑
αijνi i = 1k
νi = , j= 1,..., k. (8)
in which αij corresponds to the associated auto vectors
of the co-variables j; is the estimated coeficient of the i-th principal component and is easily obtained using equations 5 and 6.
The coeficient is obtained with a linear solution of equations 5 and 6, in which the individual contribution of each pollutant is extracted from the linear combi-nation of all pollutants (equation 5) using equation 6.
RESULTS
The mean number of daily admissions was 27.1, SD 18.1 (Table 1).
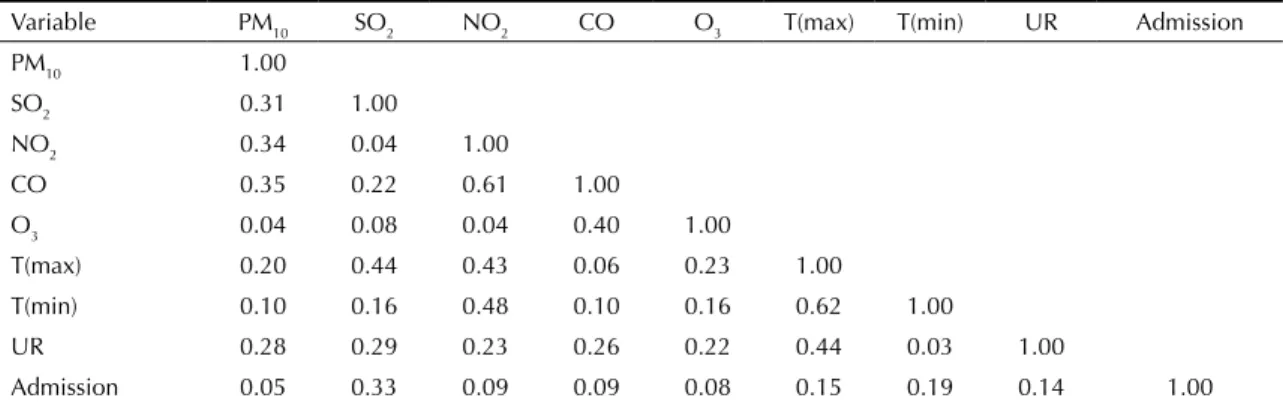
There was an indication of moderate and weak corre-lation between the air pollutants (Table 2).
The irst three components explained 83.2% of total
variability in the variables. The proportion of accumu-lated variability was used as a criterion when choosing the components in the GAM. Similar results in the
modelling were found when the irst four components were used. It was decided to use the irst three using
the criterion of parsimony as co-variables and they are shown in bold (Table 3).
The highest coeficients (auto vectors) of components
1, 2 and 3 were from CO, O3 and SO2, respectively. It was suggested to divide the clusters by each compo-nent grouped, e.g., pollutants with factorial loads > 0.5. Such suggestions are indicated by (*) for each principal component (Table 3).
An autoregressive seasonal model of the moving
average (SARMA) (1,0,0)(1,0,0)7 was adjusted for
the residuals of the GAM-PCA, resulting in the
GAM-PCA-SAR inal model. This eliminated
auto-correlation of the data.
Comparative study of the quality of fit of the
two proposed models was conducted using ,
defined as:
∑
e 2
i = 1
n
EQM = i
N
In which ei = Yi – Yi, with being the predictive value of , the number of hospital admissions, the GAM results were approximately 35.0% higher than those obtained by the GAM-PCA.
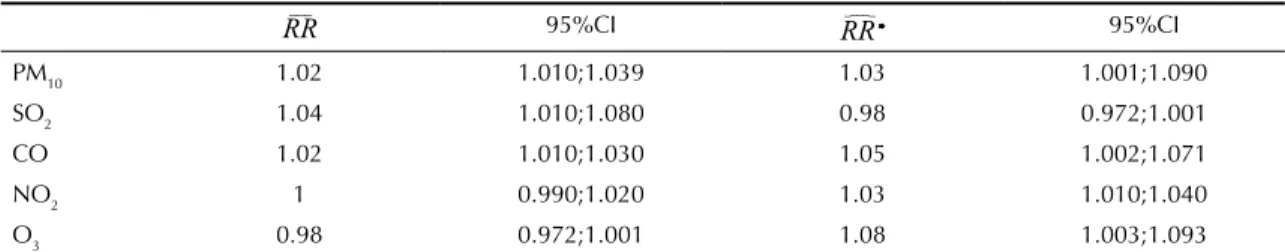
RR values for each pollutant and model were calcu-lated in order to compare the performance of the GAM and GAM-PCA-SAR adjusted models in the variables. The results were expressed by interquar-tile variation increment, once the RR analysis was conducted for pollutants of different scales (Table 4).
The estimated RR results were signiicant for all models. The most signiicant estimated RR models
were obtained principally through the proposed GAM-PCA model.
Table 1. Descriptive statistics of admissions for respiratory disease in areas covered by each monitoring station in the air quality monitoring network. Grande Vitória, ES, Southeastern Brazil, January 2005 to December 2010.
Variable Percentiles
Mean Standard deviation Minimum 25 50 75 Maximum
PM10 (µg/m3 ) 33.5 8.8 9.0 27.9 32.7 38.4 86.7
SO2 (µg/m3 ) 12.4 3.1 4.9 10.1 12.2 14.6 26.5
O3 (µg/m3 ) 31.9 8.4 12.1 26.0 30.7 36.6 72.3
NO2 (µg/m3 ) 24.8 6.9 9.0 19.6 24.1 29.4 62.6
CO (µg/m3 ) 885.8 231.3 295.0 724.8 866.6 1031.1 2141.5
Minimum temperature (ºC) 20.9 2.5 13.1 19.1 21.1 22.8 26.0
Mean temperature (ºC) 24.4 2.4 17.0 22.6 24.4 26.3 30.8
Maximum temperature (ºC) 29.3 3.3 19.4 27.2 29.4 31.6 39.7
Relative air humidity (%) 77.4 6.0 61.6 73.2 77.2 81.1 97.3
Admissions 27.1 18.1 1.0 13.0 24.0 37.0 121.0
Table 2. Correlation between pollutants, meteorological variables and admissions. Grande Vitória, ES, Southeastern Brazil, January 2005 to December 2010.
Variable PM10 SO2 NO2 CO O3 T(max) T(min) UR Admission
PM10 1.00
SO2 0.31 1.00
NO2 0.34 0.04 1.00
CO 0.35 0.22 0.61 1.00
O3 0.04 0.08 0.04 0.40 1.00
T(max) 0.20 0.44 0.43 0.06 0.23 1.00
T(min) 0.10 0.16 0.48 0.10 0.16 0.62 1.00
UR 0.28 0.29 0.23 0.26 0.22 0.44 0.03 1.00
RR estimates for PM10 increased from approximately
2.0% ( ) to 3.0% ( *). Signiicant increases in
estimated RR values were observed for CO. In this
case, = 1, 020, * = 1, 048. Thus, the proposed
GAM-PCA-SAR model shows more signiicant results
in the expected increase in the number of admissions for respiratory causes, compared with the usual GAM.
DISCUSSION
This article proposes the use of two statistical tech-niques aiming to improve the performance of the model of association between air pollutants and hospital
admissions for respiratory disease. It was veriied that
the RR estimates were better in general levels of anal-ysis, especially when compared with the models usually used in the literature. The PCA technique eliminates correlation between the pollutants studied.
The model proposed in this study is denominated the GAM-PCA, and uses the principal components of the original data as co-variables in the GAM model. As there is auto-correlation in these components, this property is transferred to the residuals of the adjusted GAM-PCA model. The residuals of this model were adjusted using the autoregressive integrated seasonal model of the
moving average (SARIMA) (1,0,0)(1,0,0)7. The inal
model was deined as GAM-PCA-SAR, with the use of
the SAR model, particular case of the SARIMA model.
The quality of it of the dominated models was calcu -lated using estimated mean squared error (MSE). The results indicate that the MSE of the usual GAM model was 35.0% higher than that of the proposed GAM-PCA-SAR model, in other words, the proposed model showed better results than that usually used in the literature.
The levels of concentration of pollutants studied did not exceed the primary standard of air quality recom-mended by the National Environmental Council
(CONAMA),c or the limits set by the World Health
Organization (WHO).d However, other studies have
shown that pollutants can have harmful effects on human health, even at levels of exposure below the levels set as acceptable.a
Harmful effects on the health of children in the Grande Vitória region from exposure to concentrations of pollut-ants were obtained by estimating Relative Risk in the proposed regression models GAM, GAM-PCA-SAR.
Based on the theoretical and empirical studies presented
by Zamprogno,a the PCA technique can be applied
without leading to spurious interpretations and tests when the auto-correlation of the process is weak.
Descriptive and graphic analyses motivated the use of the PCA technique with the data on air pollutants, even with the indication that the correlation and auto-correlation of the pollutants is weak.
An increase of 10.5 μg/m3 (interquartile interval) in
the levels of particulate material (PM10) lead to *
for 1.029 (95%CI 0.991;1.09) in the GAM-PCA-SAR model. Similar interpretations can be observed for other pollutants in the usual GAM. The results found in this study using GAM and GAM-PCA corroborate those found in studies conducted by Roberts & Martins7
(2006). The authors consider the relationship between morbidity and concentrations of air pollutants for data recorded in Korea. The article proves that using PCA improves estimates of relative risk.
The results of this study indicate the signiicant rela -tionship between concentrations of levels of pollut-ants and the number of hospital admissions in children Table 3. Result of the factorial loads and statistics of application of principal component analysis (PC). Grande Vitória, ES, Southeastern Brazil, January 2005 to December 2010.
Variable CP 1 CP 2 CP 3 CP 4 CP 5
Standard deviation 1.4315 10.431 10.115 0.7741 0.4904
Proportion of variance 0.4098 0.2176 0.2046 0.1198 0.0481
Proportion of accumulated variance 0.4098 0.6274 0.832 0.9519 1.0000
CO -0.6074* -0.1999 -0.2311 -0.2146 -0.7012
NO2 -0.5058* 0.3316 -0.0486 -0.2599 -0.5810
O3 0.2523 0.8615* -0.0363 -0.1995 -0.3911
PM10 -0.4680 0.3213 0.2784 0.7746 -0.0151
SO2 -0.3041 0.068 0.7992* -0.4966 0.1327
Values in bold refer to components used by the criterion of parsimony with co-variables.
c Ministério do Meio Ambiente. Conselho Nacional do Meio Ambiente. Resolução CONAMA nº 003, de 28 de junho de 1990. Dispõe sobre
o estabelecimento de padrões nacionais de qualidade do ar determinando as concentrações de poluentes atmosféricos. Diario Oficial Uniao.
22 ago 1990 [2013 Oct 21] Seção1:15937-9. Available from: http://www.mma.gov.br/port/conama/legiabre.cfm?codlegi=100
d World Healthy Organization. WHO Air quality guidelines for particulate matter, ozone, nitrogen dioxide and sulfur dioxide. Global update
Table 4. Relative Risk (RR) and 95% confidence interval of admissions for respiratory disease in children < 6 by interquartile
variation of the pollutants PM10, SO2, NO2, O3 and CO in the Grande Vitória Region. Grande Vitória, ES, Southeastern Brazil,
January 2005 to December 2010.
95%CI 95%CI
PM10 1.02 1.010;1.039 1.03 1.001;1.090
SO2 1.04 1.010;1.080 0.98 0.972;1.001
CO 1.02 1.010;1.030 1.05 1.002;1.071
NO2 1 0.990;1.020 1.03 1.010;1.040
O3 0.98 0.972;1.001 1.08 1.003;1.093
PM10: particulate matter; SO2: sulfur dioxide; O3: ozone; CO: carbon monoxide; NO2: nitrogen dioxide.
aged < 6, even in environments where levels are
below the limits recommended by CONAMAc and the
WHO.d The principal components obtained using the
variance/co-variance matrix applied to the processes
indexed in time show temporal correlation. It is
proposed that parametric ilters be used with the original
variables in order to remove temporal correlation. The
iltering method, using the vector auto regression (VAR)
model, is suggested as an alternative procedure for transforming atmospheric data in a white noise process.
It is recommended that the PCA technique be used to analyze frequency data, and that other susceptible popu-lation groups should be studied, as well as other types
of disease, such as cardiovascular disease. Other tech-niques could be used, such as the bootstrap technique,
to estimate conidence intervals with more precision,
and that of generalized linear autoregressive moving average (GLARMA) modelling, to resolve the problem of serial auto-correlation of the data.
ACKNOWLEDGEMENTS
Thanks to the Instituto Estadual de Meio Ambiente
(IEMA) and to the Hospital Infantil Nossa Senhora
REFERENCES
1. Chen R, Chu C, Tan J, Cao J, Song W, Xu X, et al. Ambient
air pollution and hospital admission in Shanghai, China. J
Hazard Mater. 2010;181(1-3):234-40.
2. Friedman J. Multivariate adaptive regression splines.
Ann Stat. 1991;19(1):1-67.
3. Gouveia N, Bremner SA, Novaes HM. Association between ambient air pollution and birth weight in
São Paulo, Brazil. J Epidemiol Community Health.
2004;58(1):11-7. DOI:10.1136/jech.58.1.11
4. Johnson RA, Wichern DW. Applied multivariate statistical analysis. 6th ed. New Jersey: Prentice Hall; 2007.
5. Kedem B, Fokianos K. Regression models for time
series analysis. 2th ed. Hoboken: Wiley; 2002. DOI:10.1002/0471266981
6. Martins L, Latorre MRDO, Saldiva PHN, Braga ALF. Relação entre poluição atmosférica e atendimentos por infecções de vias aéreas superiores no município de São Paulo: avaliação do rodízio de
veículos. Rev Bras Epidemiol. 2001;4(3):220-9.
DOI:10.1590/S1415-790X2001000300008
7. Roberts S, Martin M. Using Supervised Principal Components Analysisto Assess Multiple
Pollutant Effects. Environ Health Perspect.
2006;114(12):1977-82.
8. Freitas C, Bremner SA, Gouveia N, Pereira LAA, Saldiva PHN. Internações e óbitos e sua relação com a poluição atmosférica em São Paulo, 1993
a 1997. Rev Saude Publica. 2004;38(6):751-7.
DOI:10.1590/S0034-89102004000600001
9. Schwartz J. Harvesting and long term exposure effects in the relationship between air pollution and mortality.
Am J Epidemiol. 2000;151(5):440-8.
10. Wahba G. Splines in nonparametric regression. Encyclopedia of Environmetrics. 2000.
11. Wang Y, Pham H. Analyzing the effects of air pollution and mortality by generalized additive models with robust principal components.
Int J Syst Assur Eng Manag. 2011;2(3):253-9. DOI:10.1007/s13198-011-0072-7
12. Zou G. A modified poisson regression approach to
prospective studies with binary data. Am J Epidemiol.
2004;159(7):702-6. DOI:10.1093/aje/kwh09
Article based on the master’s dissertation of Souza JB, entitled: “Análise de Componentes Principais e a Modelagem Linear Generalizada: uma associação entre o numero de atendimentos hospitalares por causas respiratórias e a qualidade do ar, na
Região da Grande Vitória, ES”, presented to the Programa de pós-graduação em Engenharia Ambiental of the Universidade
Federal do Espírito Santo, in 2013.