Behavioral observation used to estimate pesticide exposure
for farm workers in Brazil
David A. Eckerman
1, 2, Cristiano Coelho
3, Lincoln S. Gimenes
2, Erick Röso Huber
3, Diane S.
Rohlman
4and W. Kent Anger
41 University of North Carolina at Chapel Hill, USA 2 Universidade de Brasília, Brazil
3 Universidade Católica de Goiás, Brazil 4 Oregon Health & Science University, USA
Abstract
Assessment of the harm caused by exposure to pesticides requires that a measure of exposure be available. While such information is available without dificulty in controlled laboratory studies, estimating the exposure of humans who have been exposed in the real world is dificult. The dificulty is increased if exposures have taken place over an extended time period and the documentation of speciics is unavailable. Three methods of exposure assessment have previously been used: comparison of exposed and non-exposed groups, estimation of exposures through self-report of the individuals, and estimation of exposure through assessment of biomarkers or environmental levels. Each approach imposes limitations. We propose an additional approach – estimation of the degree of exposure for individuals through direct observation of their behavior and their use of personal protective equipment (PPE) during periods of exposure. We also obtain opinions from experts regarding the risk associated with the various behaviors and PPE use and combine these with the observations to create a personal risk index for each individual. By including information on chemicals in use during this period, we can characterize recent (observed) exposure for that individual. By these steps, the degree of risk may be determined for recent (observed) exposure. An estimate of long-term risk resulting from work-related exposures can be obtained for individuals by summing across their work histories. Keywords: exposure assessment, toxic impairment, pesticides, neurobehavioral impairment, cognitive impairment, human.
Received 25 January 2009; received in revised form 4 March 2009; accepted 4 March 2009. Available online 29 June 2009
David A. Eckerman, Department of Psychology, University of North Carolina at Chapel Hill, USA and Departamento de Processos Psicológicos Básicos, Instituto de Psicologia, Universidade de Brasília, Brazil. Cristiano Coelho and Erick Röso Huber, Departamento de Psicologia, Universidade Católica de Goiás, GO, Brazil Lincoln S. Gimenes, Departamento de Processos Psicológicos Básicos, Instituto de Psicologia, Universidade de Brasília, Brazil. Diane S. Rohlman and W. Kent Anger, Oregon Health & Science University, USA. Correspondence regarding this article should be directed to: David A. Eckerman, 200 Ridge Trail, Chapel Hill, NC, 27516, USA. Phone: +1-919-932-7612. E-mail: [email protected]
Introduction
Long-term exposure to concentrations of organophosphorus (OP) and other pesticides that do not produce frank toxicity or poisoning has been shown to impair behavior in many studies (e.g., Jors et al., 2006; Kamel & Hoppin, 2004). Behavioral studies of pesticide
the health effects of pesticides. Obtaining a quantitative measure of the level of exposure concentrations for an individual, however, is a challenge.
Three different approaches have been used by epidemiological studies to estimate exposures: 1) Comparison of health status in exposed versus non-exposed populations; 2) correlation of health status with estimates of individual exposures derived from self-reports or archival records such as work records; and 3) correlation of health status with estimates of individual exposure derived from biological or environmental assessment. In addition to these three we propose the use of a fourth: repeated direct observation of the work behaviors of individuals combined with an assessment of the exposure risk associated with these behaviors. Each approach also requires extrapolating the exposure across an estimated work history in order to evaluate the effects of pesticides over that period. These approaches have different strengths and limitations. We briely review these and conclude by advocating for an assessment of the value of the fourth approach: adjusted, summed observations.
Group comparisons
There is a long-standing tradition of carrying out ield studies that compare the health of an exposed group to that of an unexposed control or reference group in order to determine the danger of toxic exposures (e.g., Anger, 1990, 2003; Fiedler et al., 1997). Though such studies have been helpful in alerting us in regard to toxic dangers, the distribution of exposure concentrations may be broad within groups even to the extent that there may be overlap between the two groups. Thus, a key limitation of the group comparison is that conclusions must be tentative since the level of exposure is not characterized. Furthermore, the individuals in the two groups may differ in ways that would confound the comparison – differences such as age, educational and socio-economic level, etc.
Characterizing exposure of individuals through self-report or archival records
Some of the methodologically strongest evidence supporting the dangers of low-level exposure to pesticides has been obtained using self-reported exposure ratings (e.g., Fiedler et al., 1997; Jors et al., 2006; see Kamel & Hoppin, 2004 for a general review). Yet, the validity of retrospective self-reports is suspect for many reasons. Although there is evidence that recall is reasonably accurate in some populations (e.g., North American pesticide applicators who keep records of their work) (Hoppin, Yucel, Dosemeci, & Sandler, 2002), many sources of information attest that most individuals do not remember details of their lives very well, and might be especially untrustworthy when remembering risky behavior or aversive situations (e.g., Gimenes & Vasconcelos, 1997). All such reports are made in a social context that might bias recall to either over- or
under-report dangerous activities (e.g., Gimenes & Vasconcelos, 1997). The use of archival records would not automatically correct for such biases, since such records might themselves be biased to over- or under-report risky activities depending on their source. Thus, the limitation of self-report measures of exposure lies in their limited ability to be validated against what exposures actually took place and our general understanding that self-report measures are subject to bias.
Biological or environmental assessment of exposure
While this approach is the most deinitive of the four and has been useful in ield assessments of health effects of toxic exposures, there are many issues that need to be considered during data collection and interpretation of the results (Barr et al., 2006; Fenske, Bradman, Whyatt, Wolff, & Barr, 2005). Biological assessment of pesticide exposure in humans is most often accomplished through biomonitoring of urine or blood, although saliva and hair have also been examined (Henn, McMaster, & Padilla, 2006; Barr et al., 2006; Lu, Showlund-Irish, & Fenske, 2003; Ostrea et al., 2006). OP pesticides are metabolized quickly by the body and eliminated in the urine and there is often great variability within and across samples (Barr et al., 2006; Fenske et al., 2005). These issues need to be considered when designing a sampling plan. Although spot-urine samples are convenient, they often do not provide an accurate assessment of the current exposure because of the short half-lives of the pesticides (Needham & Sexton, 2000). In order to assess exposure to pesticides over an extended time period, it is necessary to collect samples at multiple time points (Fenske et al., 2005). Identifying organophosphate metabolites in urine eventually may provide a way to measure extended exposures, though the use of repeated samples may be needed (Geer et al., 2004; Simcox et al., 1999); for example, a review of ive published studies shows good correspondence between externally measured doses of Chlorpyrifos (an OP pesticide) and urine levels of Chlorpyrifos excreted over a four-day period, when appropriate corrections were entered for dermal versus inhalation absorption. Hines and Deddens (2001) found evidence of increasing OP pesticides in urine samples for up to three days after exposure (rising cumulative dose). Simcox et al. (1999) found that metabolites of an OP pesticide (azinphos-methyl) were detectable in urine samples for up to 16 weeks after exposure in apple orchard workers. Thus, by proper sampling, emerging analyses may well allow a biological assessment of recent exposure to pesticide (Pope, 1999). The question then becomes how to extend this assessment of recent exposure into a measure of long-term exposure.
measures of exposure lies in the dificulty of tying these measures to the long-term, low-level exposures to pesticides that appear to produce changes in cognition and behavior.
Repeated direct observation of activities
We provide an additional measure for indexing the level of an individual’s exposure by making repeated observations of the individual’s activities – activities predetermined to provide a risk of exposure. Each of these activities is assigned an exposure-risk factor based on expert judgment. An additional adjustment is made for the level of protection an individual is seen wearing during the activity (e.g., mask, gloves, type of shoes, special clothing). This approach, then, involves using direct observations to indicate the frequency with which speciic individuals participate in risky activities combined with a collective judgment about the relative risk of pesticide exposure that result from these activities. This personal index of risky behavior can then be combined with an assessment of the pesticides being used during those observation periods to provide an estimate of recent exposure for each individual. We believe that this approach will provide a useful alternative to exposure estimation by self-report and biomonitoring. The present report reviews our approach to obtaining, adjusting, and summing observations to provide such an estimate.
Methods
Participants and Locations
Nineteen farm workers from two tomato farms near Goianópolis, Goiás, Brazil consented to participate in our research. The workers typically work for the same farmer throughout the year and are paid, in part, with a percentage of the farm income from the harvest. All participants were male.
Each farm occupied approximately 7 acres of a gently sloping ield, arranged with parallel rows of staked tomatoes spaced approximately 1m apart and following the topographical contours of the hillside. The tomatoes on these farms grow on stakes to reduce contact with vermin – a fact that considerably increases the worker’s exposure to sprayed pesticides. Each row was divided into approximately 20m sections, with downhill paths about 2m wide separating the farm into rectangular sections. These paths are designed to allow water to low downhill from a system of pipes running along the top row, so that the water can be temporarily diverted into each row until the whole section has been irrigated. Typically workers are responsible for all farming activities taking place in one or two of these rectangular sections. A large (200 KL) vat in which pesticides are mixed with water is placed at the top of each section. Workers illed backpack sprayers (20 KL) from these vats and applied pesticides to the plants. Pesticides
were sprayed daily for the irst weeks of a growing cycle (usually 14 weeks) and every three days thereafter (spraying did not occur on days preceding the harvest of tomatoes). The pesticides used on the farms are shown in Table 1. English chemical classes are indicated along with Portuguese names for the chemicals.
Observations
Three researchers visited each farm approximately once a week for 12 weeks. These unannounced visits occurred either in the morning or afternoon. Two researchers circulated through the farm twice (approximately an hour apart) and independently observed what each worker was doing when he was encountered.
Observations were made using a checklist of possible farm activities as well as a list of protective clothing that could be worn by the workers. The third researcher interviewed the farm manager about ongoing activities at the farm as well as activities and worker attendance since the last visit. This interview included a listing of chemicals used on the farm and the frequency of use.
Estimating Exposure
Two researchers independently rated the exposure-risk for each possible farm activity and the exposure-risk-reduction for each type of protective clothing on the checklist; 100 was the highest risk rated and 40 was the minimum risk (i.e., simply being on the farm). Risk-reduction was separately rated for each type of clothing matched against each farm activity and set as a percentage reduction for the exposure risk for that activity. Thus, for example, wearing a mask reduced the risk number for spraying from 100 to 80.
This matrix of values was then applied to the observations collected for each worker to determine his exposure index for each observation day. The exposure value for each activity was added to the daily sum for a worker after being reduced by the protection offered for that activity by his clothing. An average daily exposure value was calculated across all observation days for each worker.
Results
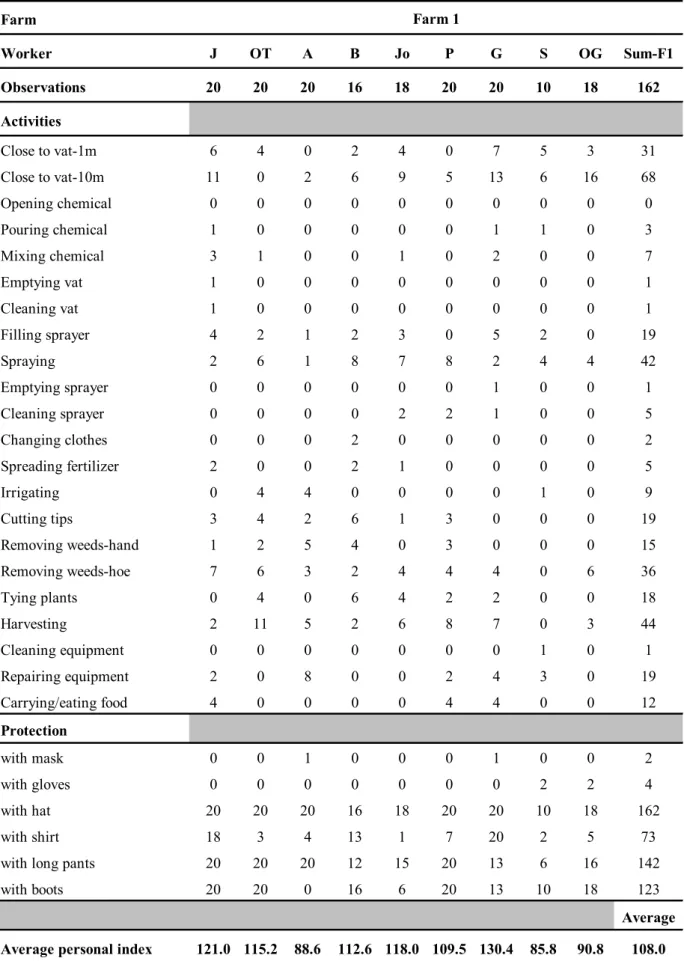
Table 1. Observations and Calculations for individual workers on the two farms. Farm
Worker J OT A B Jo P G S OG Sum-F1
Observations 20 20 20 16 18 20 20 10 18 162
Activities
Close to vat-1m 6 4 0 2 4 0 7 5 3 31
Close to vat-10m 11 0 2 6 9 5 13 6 16 68
Opening chemical 0 0 0 0 0 0 0 0 0 0
Pouring chemical 1 0 0 0 0 0 1 1 0 3
Mixing chemical 3 1 0 0 1 0 2 0 0 7
Emptying vat 1 0 0 0 0 0 0 0 0 1
Cleaning vat 1 0 0 0 0 0 0 0 0 1
Filling sprayer 4 2 1 2 3 0 5 2 0 19
Spraying 2 6 1 8 7 8 2 4 4 42
Emptying sprayer 0 0 0 0 0 0 1 0 0 1
Cleaning sprayer 0 0 0 0 2 2 1 0 0 5
Changing clothes 0 0 0 2 0 0 0 0 0 2
Spreading fertilizer 2 0 0 2 1 0 0 0 0 5
Irrigating 0 4 4 0 0 0 0 1 0 9
Cutting tips 3 4 2 6 1 3 0 0 0 19
Removing weeds-hand 1 2 5 4 0 3 0 0 0 15
Removing weeds-hoe 7 6 3 2 4 4 4 0 6 36
Tying plants 0 4 0 6 4 2 2 0 0 18
Harvesting 2 11 5 2 6 8 7 0 3 44
Cleaning equipment 0 0 0 0 0 0 0 1 0 1
Repairing equipment 2 0 8 0 0 2 4 3 0 19
Carrying/eating food 4 0 0 0 0 4 4 0 0 12
Protection
with mask 0 0 1 0 0 0 1 0 0 2
with gloves 0 0 0 0 0 0 0 2 2 4
with hat 20 20 20 16 18 20 20 10 18 162
with shirt 18 3 4 13 1 7 20 2 5 73
with long pants 20 20 20 12 15 20 13 6 16 142
with boots 20 20 0 16 6 20 13 10 18 123
Average
Average personal index 121.0 115.2 88.6 112.6 118.0 109.5 130.4 85.8 90.8 108.0
Z-score (overall) 1.43 0.97 -1.15 0.77 1.20 0.52 2.19 -1.37 -0.97
Table 1 (continued) Farm
Worker A Da Dj E F G JC S V Va Sum-F2
Observations 14 14 14 20 14 16 20 20 18 10 160
Activities
Close to vat-1m 1 0 0 1 0 1 0 1 0 0 4
Close to vat-10m 6 6 4 6 5 4 5 5 4 4 49
Opening chemical 0 0 0 0 0 0 0 0 0 0 0
Pouring chemical 0 0 0 0 0 0 0 0 0 0 0
Mixing chemical 0 0 0 0 0 0 0 0 0 0 0
Emptying vat 0 0 0 0 0 0 0 0 0 0 0
Cleaning vat 0 0 0 0 0 0 0 0 0 0 0
Filling sprayer 0 0 0 2 0 0 1 1 0 0 4
Spraying 0 2 2 0 0 0 1 1 0 0 6
Emptying sprayer 0 0 0 0 0 0 0 0 0 0 0
Cleaning sprayer 0 0 0 0 0 0 0 0 0 0 0
Changing clothes 0 0 0 0 0 0 0 0 0 0 0
Spreading fertilizer 0 2 0 3 1 2 2 2 2 3 17
Irrigating 6 0 0 6 0 4 6 7 5 0 34
Cutting tips 2 3 4 1 1 0 1 0 1 1 14
Removing weeds-hand 2 3 4 0 0 0 1 0 1 1 12
Removing weeds-hoe 0 1 0 0 0 0 0 1 0 0 2
Tying plants 2 2 2 2 1 2 2 2 2 0 17
Harvesting 2 7 0 1 2 3 3 4 4 3 29
Cleaning equipment 0 0 0 0 0 0 0 0 0 0 0
Repairing equipment 2 3 0 0 0 0 1 0 1 0 7
Carrying/eating food 1 3 0 2 2 1 0 3 2 0 14
Protection
with mask 0 0 2 0 0 0 0 0 0 0 2
with gloves 2 0 2 0 0 0 4 1 0 3 12
with hat 12 14 14 20 12 16 19 20 18 10 155
with shirt 3 14 12 2 6 4 8 19 4 10 82
with long pants 0 14 14 20 13 8 20 20 12 10 131
with boots 0 13 14 20 13 14 20 19 12 10 135
Average
Average personal index 110.8 95.0 93.1 94.9 89.7 99.2 106.2 109.7 102.1 89.3 99.0
also observed whether the worker was wearing protective clothing as noted in the table. For each activity, the risk was reduced by a speciic value for each speciic kind of protective clothing that the worker was using. Multiple protections produced greater protection by a simple sum of these reductions. For each worker, a risk index was determined for each day by adding up the risk associated with each activity (reduced by the speciic amounts the observed protections changed the risk of that activity). The average of these daily summed risks is shown in the next to bottom row of the table, along with the average for each farm. The mean and standard deviation was determined for these average individual values and a z-score was calculated for each worker (bottom row). These are the z-scores that were used in generating the frequency distribution shown in Figure 1.
Individuals performed different activities during our observations. Some individuals were often close to the vat while others were rarely there. Some were observed spraying many times, while others were rarely or never seen spraying. Our observations are, of course, only a sample of the work done. One clear similarity between the farms is that on both of them harvesting the tomatoes was a common activity. Yet, there are also differences between the farms. One clear difference between the two farms, for example, is that we saw less spraying on Farm 2 than on Farm 1, where spraying was among the most common activities. On the other hand, we saw more spreading of fertilizer and irrigating on Farm 2 than on Farm 1. On Farm 2 these were among the most common activities. As our observations were rarely made early in the morning, perhaps spraying took place on Farm 2 when we were not present to observe it and spreading of fertilizer and irrigating took place on Farm 1 when we were absent. The two farms were more similar in the use of protective equipment by their workers. Masks were almost never seen and gloves were rarely seen. Hats, long pants, and shoes (boots), on the other hand, were used by almost all (one worker was never seen wearing long pants or shoes).
In total, our observations showed a great diversity of activities and protective clothing use. Speciically, the sample that we obtained appears to provide a basis to distinguish the risk of exposure across these individuals. Personal indexes range from a low of 85 to a high of 130, and these were both for individuals on Farm 1. There may be a slight difference between the two farms, yet the average individual indexes showed considerable overlap between the two farms. The similarity was suficient to allow us to consider personal indexes from both farms to fall along a continuum ranging from the lowest to the highest risk of exposure. After determining the personal index for each worker the means and standard deviations were calculated. Values for individual workers were then expressed as z-scores and presented as a worker’s level of exposure compared with those for other workers.
Figure 1 presents a frequency distribution of the individual index z-scores. The distribution for these 19 workers is somewhat skewed to the right – a clustering of lower-exposed workers and a spreading out of higher-exposed workers. The distribution appears to be suficiently symmetrical, however, to provide a reasonable set of exposure values for use when exploring the relation between individual exposure and individual behavioral measures that show toxic impairment. We will use the location of an individual worker within this distribution as a personal risk index to adjust upward or downward the estimate of exposure derived for this individual from work history data (obtained through interview or archival records). These work history data will themselves be adjusted by a factor determined by the types of chemicals in use during the period considered.
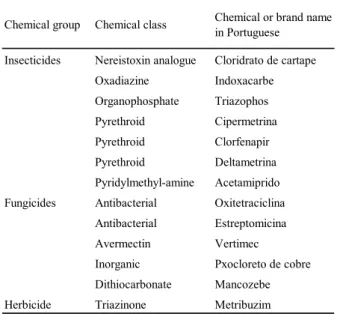
We have included the list of pesticides used on the farms during our observations in order to demonstrate how this information might be used to supplement the behavioral observations to determine the degree of Table 2. Pesticides used on the two Tomato Farms.
Figure 1. Frequency (N = 19) of workers within ±0.5 z-score units of the mean exposure index, ±0.5 to ±1.0 z-score units (plotted over ±0.8), ±1.0 to ±1.5 z-score units (plotted over ±1.3), and +1.5 to +2.0 z-score units (plotted over +1.8).
0 1 2 3 4 5 6
-1.3 -0.8 0 0.8 1.3 1.8
Z-score
N
um
be
r of w
orke
rs
Chemical group Chemical class Chemical or brand name in Portuguese
Insecticides Nereistoxin analogue Cloridrato de cartape
Oxadiazine Indoxacarbe
Organophosphate Triazophos
Pyrethroid Cipermetrina
Pyrethroid Clorfenapir
Pyrethroid Deltametrina
Pyridylmethyl-amine Acetamiprido
Fungicides Antibacterial Oxitetraciclina
Antibacterial Estreptomicina
Avermectin Vertimec
Inorganic Pxocloreto de cobre
Dithiocarbonate Mancozebe
exposure experienced by the workers. Since different pesticides have different toxicities, expert opinion will be sought to assign a risk value for each chemical at each observed dosage (see Discussion). Table 2 provides a listing of chemicals that were used during the period of observation for this report. When used in measuring exposure, observations for a speciic day will be linked to the speciic chemicals and dosages being used, thus allowing frequency and degree of exposure to be represented in the analysis.
Table 2 shows that a number of different pesticides were used during the period of observation and that they were drawn from a number of different chemical classes, including organophosphate compounds (a class of chemicals that has been used as pesticides since the 1940s), carbamates (used as pesticides since the 1960s), pyrethroids (used as pesticides since the 1980s), as well as more recently developed pesticides. On most days a “cocktail” of chemicals was sprayed. Our experts will rate the toxicity of these speciic mixtures to provide a level of risk for each day.
Discussion
We have demonstrated the initial steps for using behavioral observations of farm worker activities as a basis for estimating worker exposure to pesticides. In step 1, behavioral observations (Table 1) were combined with expert estimates of the risk associated with each of the observed activities in order to produce a personal index of risk for each individual and a distribution of exposure potential across a group of farm workers (Figure 1). This step locates each worker along a continuum of exposure risk, much as an IQ test locates individuals along a continuum of intellectual potential. In step 2, the chemicals being used are identiied (Table 2) in order to begin to specify the degree of exposure resulting from each worker’s activities. This second step is anticipated but was not completed in our present analysis. It provides an estimate for recent exposures for each worker, an estimate that may be cross-validated against self-report, environmental, and biological estimates of exposure in predicting behavioral impairments resulting from this exposure.
To characterize long-term rather than merely recent work-related exposures for individuals, however, a method must be developed to extend beyond the period of observation of recent activities. To accomplish an estimate of long-term exposure, information can be obtained regarding the work history of the individual and a list can be generated of the chemicals and amounts of exposure likely to have been associated with that work history. From the irst of these, “exposure duration” can be derived; from the second, “exposure dose” can be derived (once again by applying expert judgment regarding the risk associated with these chemicals). The exposure potential represented in Figure 1 can then
be calculated for this historical exposure to provide a personal “best-available” estimate of exposure for the speciic individual across that history of exposures. In this process, the individual’s risk potential (Figure 1) is treated as a stable personal tendency that would amplify or minimize exposure for that individual, given the work and chemical history.
Our approach to estimating exposure utilizes expert judgment for estimating the risk of speciic activities and the protection from risk offered by clothing and other personal protective equipment used during these activities. Expert opinion is also used to judge the risk associated with speciic chemicals. In our inal method for establishing each of these risks, expert judgment would be obtained and combined in a manner similar to the one recommended by Wallsten and Whitield (Wallsten & Whitield, 1986; Whitield & Wallsten, 1984, 1989) on how the U.S. EPA might estimate a “dose-response” effect of lead exposure on human health even though objective data for such an estimate were scarce at that time and the data that were available were subject to complex confounding. They demonstrated that a principled and objective combination of expert opinion provided a way of reaching a scientiically based evaluation of risk even when opinions differed from one scientist to another. Such is certainly the case at present regarding the evaluation of risk for pesticide exposures. Wallsten and Whitield’s protocol involved: 1) recruiting the participation of experts in the ield of the toxicology of pesticides; 2) presenting each expert with the same extended series of concrete but hypothetical exposure scenarios (e.g., example question for expert: “A twenty year old male tomato farm worker ills his backpack sprayer – [activity X] - 0 times each day from a vat containing Y amount of pesticide Z Please indicate your estimate of the likelihood that this worker will suffer from a memory impairment after 5 years of this work.). 3) use these exposure scenarios to provide estimates for a range of doses (i.e., a range of Y from the example above) for several representative pesticides (i.e., pesticides indicated as Z in the example above) so that a dose-response function can be derived that represents this expert’s judgment of the danger associated with each worker activity (activity X) and each pesticide; and 4) combine these dose-response curves in order to derive an “average estimated relative risk.”
We believe that behavioral observation, combined with such collected judgment regarding risks brought on by these activities and chemicals used will provide a relatively low-cost but valid scientific basis for estimating both recent and long-term toxic exposure.
Acknowledgments
The authors are indebted to the volunteers and farmers whose willingness to participate made this report possible. The work was approved by the Ethics Review Board of the Catholic University of Goiânia.
References
Anger, W.K. (1990). Worksite behavioral research: results, sensitive methods, test batteries, and the transition from laboratory data to human health. Neurotoxicology, 11, 629-720.
Anger, W. (2003). Neurobehavioural tests and systems to assess neurotoxic exposures in the workplace and community (invited paper). Occupational and Environmental Medicine, 60, 531-538.
Barr, D.B., Thomas, K., Curwin, B.D., Landsittel, D., Raymer, J., Lu, C., et al. (2006). Biomonitoring of Exposure in Farmworker Studies. Environmental Health Perspectives, 114, 936-942.
Bazylewicz-Walczak, B., Majczakowa, W., & Szymczak, M. (1999). Behavioral effects of occupational exposure to organophosphorous pesticides in female greenhouse planting workers. Neurotoxicology, 20, 819-826.
Bushnell, P.J., & Moser, V.C. (2005). Behavioral Toxicity of Cholinesterase Inhibitors. In: Ramesh C. Gupta (ed.). Toxicology of Organophosphate and Carbamate Pesticides (pp. 347-360). New
York: Elsevier.
Cole, D.C., Carpio, F., Julian, J., Leon, N., Carbotte, R., & De Almeida, H. (1997). Neurobehavioral Outcomes Among Farm and Nonfarm Rural Ecuadorians. Neurotoxicology and Teratology, 19, 277-286.
Eckerman, D.A., Gimenes, L.S., Curi de Souza, R., Galvão, P.R.L., Sarcinelli, P.N., & Chrisman, J.R. (2007). Age related effects of pesticide exposure on neurobehavioral performance of adolescent farm workers in Brazil. Neurotoxicology and Teratology, 29, 164-175.
Farahat, T.M., Abdelrasoul, G.M., Amr, M.M., Shebl, M.M., Farahat, F.M., & Anger, W.K. (2003). Neurobehavioral effects among workers occupationally exposed to organophosphorous pesticides.
Occupational and Environmental Medicine, 60, 279-286.
Fenske, R.A., Bradman, A., Whyatt, R.M., Wolff, M.S., & Barr, D.B. (2005). Lessons learned for the assessment of children’s pesticide exposure: critical sampling and analytical issues for future studies.
Environmental Health Perspectives, 113, 1455-1462.
Fiedler, N., Kipen, H., McNeil, K., & Fenske, R. (1997). Long-term use of organophosphates and neuropsychological performance.
American Journal of Industrial Medicine, 5, 487-496.
Geer, L.A., Cardello, N., Dellarco, M.J., Leighton, T.J., Zendzian, R.P., Roverts, J.D., et al. (2004). Comparative analysis of passive dosimetry and biomonitoring for assessing chlorpyrifos exposure in pesticide workers. Annals of Occupational Hygiene, 48(8), 683-695.
Gimenes, L.S., & Vasconcelos, L.A. (1997). Los desastres radioactivos y sus efectos a largo plazo: el caso Cesio-137. Desastres & Sociedad, 8, 55-62.
Gomes, J., Lloyd, O., Revitt, M.D., & Basha, M. (1998). Morbidity among farm workers in a desert country in relation to long-term exposure to pesticides. Scandinavian Journal of Work, Environment & Health, 24, 213-219.
Henn, B.C., McMaster, S., & Padilla, S. (2006). Measuring Cholinesterase Activity in Human Saliva. Journal of Toxicology and Environmental Health, Part A: Current Issues, 69, 1805-1818.
Hines, C.J., & Deddens, J.A. (2001). Determinants of Chlorpyrifos exposures and urinary 3,5,6-Trichloro-2-Pyridinol levels among termiticide applicators. Annals of Occupational Hygiene, 45, 309-321.
Hoppin, J.A., Yucel, F., Dosemeci, M., & Sandler, D.P. (2002). Accuracy of self-reported pesticide use and duration information from licensed pesticide applicators in the Agricultural Health Study. Journal of
Exposure Analysis and Environmental Epidemiology, 12, 313-318.
Jors, E., Morant, R.C., Aguilar, G.C., Huici, O., Lander, F., Vaelum, J., et al. (2006). Occupational pesticide intoxications among farmers in Bolivia: a cross-sectional study. Environmental Health: A Global Access Science Source, 5, 10.
Kamel, F., & Hoppin, J.A. (2004). Association of pesticide exposure with neurologic dysfunction and disease. Environmental Health Perspectives, 112, 950-958.
Kamel, F., Rowland, A.S., Park, L.P., Anger, W.K., Baird, D.D., Gladen, B.C., et al. (2003). Neurobehavioral performance and work experience in Florida farmworkers. Environmental Health Perspectives, 111, 1765-1772.
Korsak, R.J., & Sato, M.M. (1977). Effects of chronic organophosphate pesticide exposure on the Central Nervous System. Clinical Toxicology, 11, 83-95.
London, L., Myers, J.E., Nell, V., Taylor, T., & Thompson, M.L. (1997). An Investigation into Neurologic and Neurobehavioral Effects of Long-Term Agrichemical Use among Deciduous Fruit Farm Workers in the Western Cape, South Africa. Environmental Research, 73, 132-145.
Lu, C., Showlund-Irish, R., & Fenske, R.A. (2003). Biological monitoring of diazinon exposure using saliva in an animal model.
Journal of Toxicology and Environmental Health, 66, 2315-2325.
Needham, L.L., & Sexton, K. (2000). Assessing children’s exposure to hazardous environmental chemicals: an overview of selected research challenges and complexities. Journal of Exposure Analysis and Environmental Epidemiology, 10, 611-629.
Ostrea, E.M., Villanueva-Uy, E., Bielawski, D.M., Posecion Jr., N.C., Corrion, M.L., Jin, Y., et al. (2006). Maternal hair: an appropriate matrix for detecting maternal exposure to pesticides during pregnancy. Environmental Research, 101, 312-322.
Pope, C.N. (1999). Organophosphorus pesticides: do they all have the same mechanism of toxicity? Journal of Toxicology and Environmental Health, Part B, 2, 161-181.
Reidy, T.J., Bowler, R.M., Rauch, S.S., & Pedroza, G.I. (1992). Pesticide exposure and neuropsychological impairment in migrant farm workers. Archives of Clinical Neuropsychology, 7, 85-95.
Rohlman, D.S., Anger, W.K., Lasarev, M., Scherer, J., Stupfel, J., & McCauley, L. (2007). Neurobehavioral Performance of Adult and Adolescent Farmworkers. Neurotoxicology, 28, 374-380.
Rohlman, D.S., Bailey, S.R., Anger, W.K., & McCauley, L. (2001). Assessment of neurobehavioral function with computerized tests in a population of Hispanic adolescents working in agriculture.
Environmental Research, 85, 14-24.
Roldán-Tapia, L., Parrón, T., & Sánchez-Santed, F. (2005). Neuropsychological effects of long-term exposure to organophosphate pesticides. Neurotoxicology and Teratology, 27, 259-266.
Rothlein, J., Rohlman, D.S., Lasarev, M., Phillips, J., Muniz, J., & McCauley, L. (2006). Organophosphate pesticide exposure and neurobehavioral performance in agricultural and nonagricultural Hispanic workers. Environmental Health Perspectives, 114, 691-696.
Simcox, N.A., Camp, J., Kalman, D., Stebbins, A., Bellamy, G., Lee, I.-C., et al. (1999). Farmworker exposure to organophosphorus pesticide residues during apple thinning in Central Washington State.
American Industrial Hygiene Association Journal, 60, 752-761.
Steenland, K., Dick, R.B., Howell, R.J., Chrislip, D.W., Jines, C.J., Reid, T.M., et al. (2000). Neurologic functioning among termiticide applicators exposed to chlorpyifos. Environmental Health Perspectives, 108, 293-300.
Stephens, R., Spurgeon, A., Calvert, I.A., Beach, J., Levy, L.S., Berry, H., et al. (1995). Neuropsychological effects of long-term exposure to organophosphates in sheep dip. Lancet, 345(8958), 1135-1139.
Surowiecki, J. (2004). The wisdom of crowds: why the many are smarter than the few and how collective wisdom shapes business, economies, societies, and nations. New York: Doubleday.
Wallsten, T., & Whitield, R. (1986). Assessing the risks to young children associated with elevated blood-lead levels. In: National Training Information Service (Vol. EE87004219).
Whitield, R., & Wallsten, T. (1984). Estimating risks of lead-induced hemoglobin decrements under conditions of uncertainty: methodology, pilot judgments, and illustrative calculations. In:
National Training Information Service (Vol. DE85012293). Whitield, R.G., & Wallsten, T. S. (1989). A risk assessment for