Leprosy-related mortality in Brazil: a neglected condition
of a neglected disease
Francisco Rogerlaˆndio Martins-Melo
a,b, Adriana Vale´ria Assunc¸a˜o-Ramos
c,d, Alberto Novaes Ramos Jr
a,
Carlos Henrique Alencar
a, Renan Magalha˜es Montenegro Jr
a, Maria Leide Wand-Del-Rey de Oliveira
eand Jorg Heukelbach
a,f,*
aDepartment of Community Health, School of Medicine, Federal University of Ceara´, Fortaleza, Brazil;bFederal Institute of Education,
Science and Technology of Ceara´, Caucaia, Brazil;cSchool of Medicine, Health Sciences Center, University of Fortaleza, Fortaleza, Brazil; dMunicipal Secretary of Health of Fortaleza, Ceara´, Brazil;eTraining Center on Dermatology, University Hospital Clementino Fraga Filho,
Federal University of Rio de Janeiro, Rio de Janeiro, Brazil;fAnton Breinl Centre for Public Health and Tropical Medicine, School of Public Health, Tropical Medicine and Rehabilitation Sciences, James Cook University, Townsville, Australia
*Corresponding Author: Present address: Department of Community Health, School of Medicine, Federal University of Ceara´, Rua Prof. Costa Mendes, 1608, 5. andar, Fortaleza, 60.430-140, Ceara´, Brazil. Tel:+55 85 3366.8045; E-mail: [email protected]
Received 15 June 2015; revised 31 July 2015; accepted 5 August 2015
Background:Leprosy is a public health problem and a neglected condition of morbidity and mortality in several
countries of the world. We analysed time trends and spatiotemporal patterns of leprosy-related mortality in Brazil.
Methods:We performed a nationwide population-based study using secondary mortality data. We included
all deaths that occurred in Brazil between 2000 and 2011, in which leprosy was mentioned in any field of death certificates.
Results:Leprosy was identified in 7732/12 491 280 deaths (0.1%). Average annual age-adjusted mortality rate was
0.43 deaths/100 000 inhabitants (95% CI 0.40–0.46). The burden of leprosy deaths was higher among males, eld-erly, black race/colour and in leprosy-endemic regions. Lepromatous leprosy was the most common clinical form mentioned. Mortality rates showed a significant nationwide decrease over the period (annual percent change [APC]: 22.8%; 95% CI24.2 to22.4). We observed decreasing mortality rates in the South, Southeast and Central-West regions, while the rates remained stable in North and Northeast regions. Spatial and spatiotemporal high-risk clusters for leprosy-related deaths were distributed mainly in highly endemic and socio-economically deprived regions.
Conclusions:Leprosy is a neglected cause of death in Brazil since the disease is preventable, and a cost-effective
treatment is available. Sustainable control measures should include appropriate management and systematic monitoring of leprosy-related complications, such as severe leprosy reactions and adverse effects to multidrug therapy.
Keywords:Brazil, Epidemiology, Leprosy, Mortality, Spatial analysis, Time analysis
Introduction
Leprosy (Hansen’s disease), caused byMycobacterium leprae, is a neglected tropical disease (NTD) affecting 115 countries, mainly in Africa, the Americas, Southeast Asia and the Eastern Pacific.1,2Prevalence has decreased markedly since the introduc-tion of multidrug therapy (MDT) in the beginning of the 1980s.2In 2013, about 216 000 new cases of leprosy were recorded world-wide, with a global annual case detection rate of 3.81 per 100 000 inhabitants.1In 2012, there were about 7800 leprosy-related deaths and 151 000 disability-adjusted life years (DALYs) lost worldwide.3
Brazil has the second highest annual number of new cases of leprosy in the world, and harbours approximately 94% of cases on the American continent.1In 2013, about 31 000 new cases were recorded; 61% were classified as multibacillary disease.4The case detection rate was 15.44 cases per 100 000 inhabitants.4 Between 2004 and 2009, an annual average of about 250 leprosy deaths as underlying cause was recorded.5The disease is distrib-uted unevenly between the different regions: the Central-West, North and Northeast regions had the highest rates of occurrence and transmission in the country.4,6
In general, leprosy is considered a disease with a low case fatal-ity rate.5,7This may be caused by the fact that the disease is chronic
#The Author 2015. Published by Oxford University Press on behalf of Royal Society of Tropical Medicine and Hygiene. All rights reserved. For permissions, please e-mail: [email protected].
ORIGINAL
ARTICLE
at Universidade Federal do Cear� on February 1, 2016
http://trstmh.oxfordjournals.org/
and that the bacillus is virtually non-toxic.2,5,7,8Leprosy-related deaths are not systematically used in routine as surveillance indica-tors, and are widely neglected by health professionals and the scientific community.5,7,9–12However, the analysis of burden and spatial distribution of leprosy-related mortality is useful to monitor and evaluate the quality of disease control measures implemented in endemic areas.10To fill this gap, we analysed time trends and spatiotemporal patterns of leprosy-related mortality in Brazil from 2000 to 2011.
Methods
Study area
Brazil covers a total territory of 8.5 million km2and had an esti-mated population of 202.8 million in 2014. It is divided into five geographic regions (South, Southeast, Central-West, North and Northeast), 27 federal units (26 states and one federal district), and 5570 municipalities (Brazilian Institute of Geography and Statistics [Instituto Brasileiro de Geografia e Estatı´stica, IBGE]; http://www.ibge.gov.br).
Study design and population
We performed a nationwide study using secondary mortality data. We included all deaths that occurred in Brazil between 2000 and 2011, in which leprosy was mentioned on death certifi-cates, either as underlying or as associated cause of death (multiple causes of death).13
Leprosy-related causes of death were detected according to the 10th revision of theInternational Statistical Classification of Diseases and Related Health Problems (ICD-10): A30 (leprosy [Hansen disease]); B92 (sequelae of leprosy).14
Data collection
Mortality data were obtained from Brazil’s Mortality Information System (Sistema de Informac¸a˜o sobre Mortalidade [SIM]) of the Ministry of Health. SIM data are based on official death certificates and available as public domain at the website of the Informatics Department of the Unified Health System (Departamento de Informa´tica do Sistema U´nico de Sau´de [DATASUS]).15It is the physicians’ responsibility to complete the death certificate forms and to define underlying and associated causes of death. Death certificate forms are standardized throughout the country; the municipalities are responsible for data entry using a software package provided by the Ministry of Health.
Information available on death certificates includes: sex, age, race/colour, educational level, marital status, place of residence or occurrence of death, and causes of death (underlying/associated causes).
We downloaded and processed a total of 324 mortality data sets (one data set for each of the 27 federal units during 12 years), with a total of about 12.5 million entries. We checked data sets for completeness. Differing field codes were standardized. Death certificates could have more than one cause of death in the same line and not all lines were necessarily filled out. We thus cre-ated new variables for causes of death, if more than one cause was registered in a same line of the death certificates. Then, we
identified all death certificates in which leprosy was recorded either as underlying or as associated cause of death.16,17
Population data were obtained from the IBGE based on 2000 and 2010 demographic censuses and population estimates for inter-censuses years (2001–2009 and 2011), and extracted from the DATASUS website.18
Statistical analysis
Crude mortality rates (with their 95% CIs) stratified by sex, age group, race/colour and place of residence (macro-regions, federal units/states and municipalities) were calculated and expressed per 100 000 inhabitants. Age-adjusted rates were calculated by the direct method, using the Brazilian population of the 2010 Census as the standard. Age categories employed in standardiza-tion and calculastandardiza-tion of age-specific mortality rates were: 0–14, 15–29, 30–39, 40–49, 50–59, 60–69 and≥70 years. Rate ratios (RRs) and 95% CIs were calculated to determine differences among groups. Statistical significance of differences among groups was evaluated by thex2test.
Time trend analysis of indicators was performed using join-point regression model,19to identify joinpoints via a log-linear method, where the direction or the magnitude of the trends chan-ged significantly. The analysis started with 0 joinpoint, which represents a straight line without inflection points, and verified whether one or more joinpoints (in our analysis up to three) in the model were significant.19Each significant joinpoint that indi-cated a change in the slope (if any) was retained in the final regression model. Statistical significance was tested using the Monte Carlo permutation test, which chooses the best segment for each model. The annual percent change (APC) and its 95% CI were calculated for each segment to describe and quantify the trend, and to assess whether this trend is statistically signifi-cant (p,0.05).19
We analysed the spatial distribution and spatiotemporal pat-terns of leprosy-related mortality using the Brazilian municipal-ities of residence (n¼5565; territorial division of 2010) as the
geographical units of analysis. We calculated average leprosy-related mortality rates (per 100 000 inhabitants) on municipality level for the 12-year study period. To reduce random variations and provide higher stability of mortality rates in municipalities with small populations and rare events, we calculated smoothed mortality rates (per 100 000 inhabitants) by means of the Local Empirical Bayesian method.20Deaths with unknown municipality of residence were excluded.
We evaluated the presence of global spatial autocorrelation using Global Moran’s I index (ranging from21 to+1).21Index values close to zero indicate spatial randomness whereas posi-tive/negative values indicate posiposi-tive/negative spatial autocorrel-ation, respectively.21 Spatial autocorrelation was considered significant if p,0.05. Then, we evaluated the existence of local autocorrelation (Local Index of Spatial Association [LISA]) by means of Local Moran’s I index.22LISA was used to identify signifi-cant hot spots (High-High: high values spatial clusters), cold spots (Low-Low: low values spatial clusters), and spatial outliers (High-Low: high values surrounded with low value or Low-High: low values surrounded with high values) of mortality rates.22For spatial representation of the Local Moran’s index, Moran Maps were used considering municipalities with statistically significant differences (p,0.05).
at Universidade Federal do Cear� on February 1, 2016
http://trstmh.oxfordjournals.org/
We used retrospective Kulldorff’s space-time scan statistics to identify high-risk spatiotemporal clusters.23We used a Poisson probability model scanning for areas of high leprosy-related mor-tality, time aggregation of 1 year, with a maximum spatial cluster size equal to 30% of the population at risk, and a maximum tem-poral cluster size equal to 50% of the study period. Most likely or primary cluster and secondary clusters were detected through the log likelihood ratio test. We computed statistical significance using 999 Monte Carlo simulations.
Statistical analyses were performed using Stata software ver-sion 11.2 (StataCorp LP, College Station, TX, USA). Joinpoint regres-sion analyses were carried out using Joinpoint Regresregres-sion Program version 4.0.4 (United States National Cancer Institute, Bethesda, MD, USA). ArcGIS software version 9.3 (ESRI, Redlands, CA, USA) and TerraView software version 4.2 (Instituto Nacional de Pesquisas Espaciais [INPE], Sa˜o Jose´ dos Campos, SP, Brazil) were used for input, processing, analysis, calculation of autocorrelation indicators, and construction of thematic maps. Scan statistics were performed using SaTScan software version 9.1.1 (Harvard Medical School, Boston and Information Management Service Inc, Silver Spring, MD, USA).
Ethical considerations
This study was approved by the Ethical Review Board of the Federal University of Ceara´, Fortaleza, Brazil (process number 751 109/2014). Analysis was based on publicly available second-ary anonymous data, with no possibility of identification of individuals.
Results
In the 12-year study period, a total of 12 491 280 deaths were recorded in Brazil. Leprosy was mentioned in 7732 deaths (propor-tional mortality rate: 0.062%; 95% CI 0.060–0.063), with 2936 (38.0%) as an underlying cause, and 4796 (62.0%) as an asso-ciated cause. The average annual number of leprosy-related deaths was 644.3 per year (95% CI 620.8–667.9). The average annual crude leprosy-related mortality rate was 0.35 deaths/ 100 000 inhabitants (95% CI 0.32–0.38) and the age-adjusted rate 0.43 deaths/100 000 inhabitants (95% CI 0.40–0.46).
The most commonly mentioned leprosy-related cause of death was ‘unspecific leprosy’ (A30.9; 77.7% of deaths [6006/ 7732]). Of the specific clinical forms (A30.0 to A30.5), leproma-tous leprosy (A30.5: 6.6% [508/7732]) was the most common cause mentioned (Table1).
Epidemiological characteristics
Predominant socio-demographic characteristics of leprosy-related deaths were: male sex (71.4% [5518/7731]), white race/colour (46.2% [3260/7063]), married civil status (40.9% [2934/7173]), age≥70 years (38.8% [2992/7704]; mean: 62.3; median: 65.2; SD+17.8) and residency in the Southeast region (33.6% [2595/ 7732]). The state of Sa˜o Paulo (Southeast region) had the largest proportion of deaths (13.8% [1066/7732]).
The North, Northeast and Central-West regions had the highest regional leprosy-related mortality rates compared to the South region (Table2). The highest average annual age-adjusted rates
Table 1. Distribution of leprosy-related deaths according to clinical forms in Brazil, 2000–2011
Clinical form (ICD-10 codes) Underlying cause of deatha
Associated cause of deathb
Multiple causes of deathc
n % n % n %
Unspecified leprosy (A30.9) 2211 75.3 3795 79.1 6006 77.7
Sequelae of leprosy (B92) 287 9.8 540 11.3 827 10.7
Lepromatous leprosy (A30.5) 225 7.7 283 5.9 508 6.6
Indeterminate leprosy (A30.0) 77 2.6 92 1.9 169 2.2
Tuberculoid leprosy (A30.1) 49 1.7 77 1.6 96 1.2
Other forms of leprosy (A30.8) 43 1.5 50 1.0 93 1.2
Borderline leprosy (A30.3) 32 1.1 45 0.9 77 1.0
Borderline lepromatous leprosy (A30.4) 6 0.2 8 0.2 14 0.2
Borderline tuberculoid leprosy (A30.2) 6 0.2 4 0.1 10 0.1
Total 2936 100.0 4796d NC 7732d NC
ICD-10: 10th revision of theInternational Statistical Classification of Diseases and Related Health Problems.14
NC: Not calculated.
aUnderlying cause of death: the disease or injury that initiated the train of events leading directly to death, or the circumstances of the accident or
violence that produced the fatal injury. For each death, only a single underlying cause is selected from among all the conditions reported.13 bAssociated cause of death: other causes (immediate, intermediate and contributing causes) than the underlying cause, that intervened or
significantly contributed to the death.13
cMultiple causes of death: all diseases or injuries reported on the death certificate, i.e., any cause that contributed to the death. Multiple causes
include the underlying and all associated causes.13
dDeath certificates that registered at least one leprosy-related cause of death.
at Universidade Federal do Cear� on February 1, 2016
http://trstmh.oxfordjournals.org/
by state of residence were observed in Mato Grosso (1.83 deaths/ 100 000 inhabitants), Acre (1.50 deaths/100 000 inhabitants), and Tocantins (1.25 deaths/100 000 inhabitants) (Figure1and Supplementary Table 1).
Average annual age-adjusted mortality rates were higher in males than females (Table2). The highest age-specific rates were found in advanced age groups, with a maximum value in≥70 years-olds (3.65; 95% CI 3.22–4.13). RRs were significantly higher in all age groups as compared to,15 years-olds. Individuals with black race/colour had a higher rate than white race/colour (Table2).
Time trends
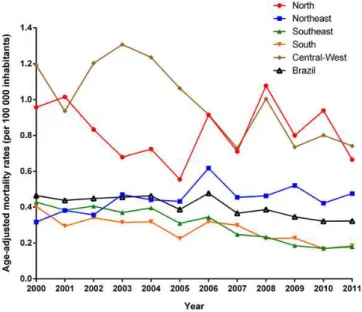
Age-adjusted mortality rates (APC 3.4; 95% CI24.9 to21.9) presented a significant decreasing trend at national level over the 12-year study period, with different patterns between regions (Figure2; Table3). There was a significant decrease in
age-adjusted mortality rates in the Southeast (APC 28.4; 95% CI 210.5 to 26.2), South (APC 26.0; 95% CI 28.4 to 23.4), and Central-West (APC24.6; 95% CI27.1 to22.0) regions, while the North and Northeast regions presented increasing, but not significant mortality trends (Table3).
Both males (APC22.9; 95% CI24.4 to21.3) and females (APC 24.5; 95% CI26.1 to22.8) showed significant decreasing mor-tality over the period studied. In all age groups mormor-tality decreased over the years, with significant trends in the age groups 15–29 years (APC24.5; 95% CI27.4 to21.4), 40–49 years (APC: –4.0; –6.6 to –1.4) 60–69 years (APC23.5; 95% CI25.0 to21.9) and≥70 years (APC24.2; 95% CI26.4 to21.9) (Table3).
Spatial distribution and high-risk clusters
In the 12-year study period, 36.6% (2039/5565) of Brazilian muni-cipalities registered at least one leprosy-related death. Figures3A Table 2. Epidemiological characteristics and leprosy-related mortality rates (per 100 000 inhabitants) by sex, race/colour, age group and region of residence, Brazil, 2000–2011
Variables Deaths Crude rate (95% CI)a Age-adjusted
rate (95% CI)a,b
Crude rate ratio p-value
n %
All leprosy-related deaths 7732 100.0 0.35 (0.32–0.38) 0.43 (0.40–0.46) Sexc
Male 5518 71.4 0.50 (0.46–0.55) 0.62 (0.57–0.67) 2.57 (2.17–3.05) ,0.001 Female 2213 28.6 0.20 (0.17–0.23) 0.24 (0.21–0.28) Ref.
Age group (years)c
,15 23 0.3 ,0.01 (0.00–0.01) NC Ref.
15–29 408 5.3 0.06 (0.05–0.09) NC 18.60 (4.34–79.68) ,0.001
30–39 567 7.4 0.17 (0.13–0.23) NC 48.98 (11.56–207.59) ,0.001
40–49 918 11.9 0.36 (0.29–0.45) NC 104.43 (24.91–437.83) ,0.001
50–59 1222 15.9 0.75 (0.62–0.91) NC 215.30 (51.58–898.75) ,0.001
60–69 1574 20.4 1.48 (1.25–1.76) NC 425.98 (102.35–1772.96) ,0.001
≥70 2992 38.8 3.65 (3.22–4.13) NC 1,046.96 (252.78–4336.36) ,0.001
Region of residence
North 910 11.8 0.51 (0.41–0.64) 0.88 (0.74–1.04) 2.04 (1.47–2.83) ,0.001 Northeast 2294 29.7 0.37 (0.32–0.43) 0.47 (0.42–0.54) 1.49 (1.13–1.96) 0.005 Southeast 2595 33.6 0.27 (0.24–0.31) 0.32 (0.28–0.36) 1.09 (0.83–1.44) NS
South 815 10.5 0.25 (0.20–0.32) 0.29 (0.24–0.37) Ref.
Central-West 1118 14.5 0.71 (0.58–0.87) 1.07 (0.91–1.26) 2.83 (2.07–3.87) ,0.001 Race/colorc
White (Caucasian) 3260 46.2 0.30 (0.26–0.34) NC Ref.
Black (Afro-Brazilian/Afro-descendant) 741 10.5 0.49 (0.38–0.63) NC 1.65 (1.25–2.18) ,0.001 Yellow (Asian-descendant) 33 0.5 0.19 (0.06–0.59) NC 0.65 (0.20–2.13) NS Brown (Mixed race/Pardo Brazilians) 3016 42.7 0.34 (0.30–0.39) NC 1.14 (0.96–1.36) NS Indigenous (Amerindians) 13 0.2 0.14 (0.03–0.75) NC 0.47 (0.07–3.09) NS
NC: not calculated; NS: not significant; Ref: reference.
aAverage annual crude- and age-adjusted mortality rates (per 100,000 inhabitants), calculated using the average number of leprosy-related
deaths as a numerator and population size in the middle of the studied period (central year: 2005.5) as a denominator. Population data on race/ colour was derived from the Brazilian National Censuses (2000 and 2010). Population size in relation to race/colour for the middle of the period was derived from an average of the 2000 and 2010 censuses.
b
Age-standardized to the 2010 Brazilian population.
cData not available in all cases (sex: 1, age group: 28, and race/colour: 669).
at Universidade Federal do Cear� on February 1, 2016
http://trstmh.oxfordjournals.org/
and B present the spatial distribution of the average annual crude and smoothed mortality rates, respectively. Average annual crude mortality rates among municipalities ranged from 0.0 to 28.2 deaths/100 000 inhabitants, and smoothed mortality rates from 0.0 to 11.2 deaths/100 000 inhabitants. We observed muni-cipalities with high leprosy-related mortality rates (.1.0 deaths/ 100 000 inhabitants) in all Brazilian regions, with concentration mainly in Central-West, North and Northeast regions (Figures3A and B). The Bayesian method generated more stable corrected mortality rates (Figure3B).
Global Moran’s I index for the study period showed significant positive spatial autocorrelation (0.156; p,0.01), evidencing the existence of spatial dependence among municipalities. Figure3C presents high-risk clusters of municipalities identified according to the LISA analysis. We identified high-risk mortality clusters (High/
High) covering areas in all Brazilian regions. There was a large con-centric cluster encompassing a wide geographic range covering from the northwest of Parana´ state, most municipalities of the states of Central-West region and the Tocantins state, the south-east and south areas of Para´ state, extending to Ceara´ state. Other high-risk clusters covered areas in the northwest of Rondoˆnia state, south and southwest of Amazonas state, and most municipalities of Acre state (Figure3C). Clusters of municipal-ities with low rates (Low/Low) were found covering large areas in the South, Southeast and Northeast regions (Figure3C).
The scan space-time analysis identified 13 significant spatio-temporal high-risk clusters for leprosy-related deaths covering areas in all Brazilian regions (Figure3D; Table4). The most likely cluster (primary cluster) was detected between 2006 and 2011, and included 1568 municipalities in the entire North region, most Figure 1. Spatial distribution of average annual age-adjusted leprosy-related mortality rates (per 100 000 inhabitants) by states of residence in Brazil, 2000–2011. This figure is available in black and white in print and in color at Transactions online.
at Universidade Federal do Cear� on February 1, 2016
http://trstmh.oxfordjournals.org/
of the Central-West region, and five states in the Northeast region (Figure3D). The annual crude mortality rate of this cluster was 0.7 deaths/100 000 inhabitants and the relative risk was 2.17 (p,0.001) (Table4). Secondary high-risk clusters were located in the states of Northeast, Southeast, South and Central-West regions (Figure3D). The relative risks of the secondary clusters ranged from 1.77 to 114.34, and annual mortality rates from 0.6 to 40.1 deaths/ 100 000 inhabitants (Table4).
Discussion
Our nationwide study provides a comprehensive overview of leprosy-related deaths in Brazil during a 12-year period. There was a decreasing mortality trend, with differing patterns among regions. The burden of leprosy deaths was higher for lepromatous leprosy, among males, elderly, black race/color and in leprosy-endemic regions. The high-risk areas for leprosy-related mortality were distributed mainly in highly endemic and socio-economically deprived areas.
The high leprosy mortality in males as observed in our study reflects the patterns of the disease in Brazil, since new cases are predominantly males, and development of more severe forms of the disease occurs more commonly in this gender.4,11This finding is similar to the results of previous mortality studies, analysing the underlying cause of death.5,7,9–12The predominance of leprosy in males in most parts of the world can be explained by the different cultural, socioeconomic, environmental and behavioural condi-tions. A lower adherence to medical care (both for diagnosis and treatment) can generate greater exposure and severity of leprosy in males.1,5,12
A higher risk for leprosy-related death was also observed among the elderly, corroborating findings of previous studies.5,11In the advanced age groups, there is a higher occurrence of chronic comorbidities, reduced effectiveness of treatment, which in turn
increase the chance of leprosy-related complications and deaths.11,12,24Interestingly, there was a considerable number of deaths in children and economically productive age group, which should have presented a better response to treatment.11
The higher death rates in individuals of black race/colour com-pared to the white population indicate possible social disparities and limited access to health services in the determination of leprosy-related deaths in Brazil.16,22,25However, the considerable number of missing entries regarding race/colour and the different recording procedures for this variable in information systems (IBGE: variable is self-reported; SIM: variable is registered by health professionals)5limits the validity, and interpretation of this infor-mation should be performed with caution.
The lepromatous form was the most frequent clinical presen-tation in leprosy-related deaths. Cases with lepromatous form present an increased risk of developing complications or have potentially more severe leprosy reactions.7,11,26These patients usually require a longer treatment time, are generally diagnosed at a later stage, and may be more likely to develop leprosy reac-tions, advanced disability grade, adverse events to the drugs
Table 3. Joinpoint regression analysis with corresponding annual percent change of leprosy-related mortality rates in Brazil, 2000–2011
Variable Mortality rate (per 100 000 inhabitants)
Annual percent change
95% CI p-value
Initial Final
Sex
Male 0.65 0.49 22.9a
24.4 to21.3 ,0.001 Female 0.29 0.16 24.5a 26.1 to22.8 ,0.001 Age group
(years)
,15 ,0.01 0.01 20.5 212.2 to 12.8 NS 15–29 0.08 0.04 24.5a 27.4 to21.4 0.001 30–39 0.18 0.15 20.6 22.4 to 1.2 NS 40–49 0.34 0.28 24.0a 26.6 to21.4 0.001 50–59 0.68 0.66 21.9 24.8 to 1.0 NS 60–69 1.74 1.13 23.5a 25.0 to21.9 ,0.001 ≥70 4.15 2.44 24.2a
26.4 to21.9 ,0.001 Region of
residence
Brazil 0.47 0.32 23.4a 24.9 to21.9 ,0.001 North 0.96 0.67 0.6 24.2 to 3.1 NS Northeast 0.32 0.48 2.5 20.4 to 5.5 NS Southeast 0.43 0.18 28.4a
210.5 to26.2 ,0.001 South 0.40 0.18 26.0a 28.4 to23.4 ,0.001 Central-West 1.19 0.74 24.6a
27.1 to 2.0 ,0.001
NS: not significant.
aSignificantly different from 0 (p ,0.05). Figure 2. Trends of age-adjusted leprosy-related mortality rates (per
100 000 inhabitants) in Brazil and regions, 2000–2011. This figure is available in black and white in print and in color at Transactions online.
at Universidade Federal do Cear� on February 1, 2016
http://trstmh.oxfordjournals.org/
(mainly MDT and corticosteroids), and post-treatment complica-tions.11,12 In the Philippines, mortality rate for lepromatous patients was five times higher as compared to the general popu-lation, while the risk of non-lepromatous patients was similar to the general population.9In a rural area in South India, the mortal-ity rate for lepromatous patients was 3.5 times higher than in the general population. The non-lepromatous patients had a two-fold mortality risk. Leprosy was considered to have contributed to about 1% of all deaths in this population.27However, the relatively high proportion of deaths (approximately 80%) in our study
without specification of the clinical form limits interpretation of data in this context.
The decreasing trend of leprosy-related mortality follows the observed pattern of decline of leprosy-related morbidity indica-tors in Brazil during recent years,4,28mainly due to efforts of the leprosy control programs, expansion of public healthcare and improvements in socioeconomic conditions.29,30The significant reduction of new leprosy cases and consequently of complications may be related to the expansion of the decentralization of the Brazilian Unified Health System (especially the expansion of Figure 3.Spatial distribution of leprosy-related deaths by municipality of residence, Brazil, 2000–2011: (A) average annual crude mortality rates (per 100 000 inhabitants); (B) average annual Bayesian-smoothed mortality rates (per 100 000 inhabitants); (C) LISA cluster analysis (Moran Map); (D) scan space-time clusters analysis. This figure is available in black and white in print and in color at Transactions online.
at Universidade Federal do Cear� on February 1, 2016
http://trstmh.oxfordjournals.org/
coverage and quality of primary health care), contributing to the decline of hidden prevalence in endemic areas in recent years.30,31 However, some endemic regions, such as the North and Northeast, did not present declining trends of mortality, despite the reduced disease burden.
During the study period, the risk and impact of leprosy-related mortality was highest in the Central-West, North and Northeast regions, mainly in the states of the Brazilian Amazon.28From 2001–2012, these areas presented the highest morbidity indica-tors in the country and were considered highly endemic regions.4,31In fact, the different spatial analysis tools used in this study identified large spatial and spatiotemporal high-risk clusters for leprosy-related mortality in these regions, and dis-played a heterogenous pattern across those areas. The distribu-tion of highly endemic areas for disease in Brazil can be explained by social and historical factors associated with the col-onization of the Amazon region, migration and maintenance of social inequities in the Northeast region.28 A large-scale Brazilian study showed that the distribution of leprosy is asso-ciated with municipalities with low socio-economic indicators, high urbanization and social inequality, primarily located in the
Central West, North and Northeast regions.32The guarantee of equal access to health services–prevention, diagnosis, rehabilita-tion and treatment–is important for leprosy control.6
Despite the expansion of primary health care coverage via the Family Health Program (Programa de Sau´de da Famı´lia) and imple-mentation of the Brazilian conditional cash transfer program (Programa Bolsa Famı´lia) which both had an operational and epi-demiological impact on leprosy,30control activities in endemic areas should take into account the multiple socioeconomic and environmental determinants.32In fact, leprosy is one of the dis-eases that form part of the ‘Brazil Without Extreme Poverty Plan’ (Plano Brasil Sem Mise´ria) of the Federal Government, which seeks to eliminate the disease as a public health problem by 2015 (prevalence lower than 1 case per 10 000 inhabitants).6The strategy used for disease control by the ‘General Coordination for Leprosy and Diseases under Elimination’ of the Ministry of Health consists of early detection and prompt treatment of cases to elim-inate the sources of infection and prevent sequels.6Innovative measures are applied, by integrating services and seeking partner-ships with the civil society to support disease control.29However, for effective and sustainable control of leprosy in endemic areas, Table 4. Significant spatiotemporal clusters of leprosy-related deaths defined using space-time scan statistics by municipality of residence, Brazil, 2000–2011
Cluster Time period
Number of municipalities
States Region Radius
(km)
Number of deaths
Expected number of deaths
Annual ratea
RR LLR p-value
1 2006–2011 1568 All States of North and
Central-West regions, Maranha˜o, Piauı´, Ceara´, Pernambuco, Bahia and Minas Gerais
North, Northeast, Central-West and Southeast
2637.8 1915 1018.5 0.7 2.17 375.39 ,0.001
2 2000–2005 1 Sa˜o Paulo Southeast 0.0 91 3.0 10.6 30.46 222.39 ,0.001
3 2000–2004 3 Minas Gerais Southeast 9.8 58 6.4 3.2 9.06 76.06 ,0.001
4 2000–2004 1 Parana´ South 0.0 31 1.4 7.6 21.64 65.68 ,0.001
5 2001–2006 1 Sa˜o Paulo Southeast 0.0 52 7.44 2.5 7.03 56.65 ,0.001
6 2000–2004 1 Minas Gerais Southeast 0.0 24 1.2 7.2 20.42 49.53 ,0.001
7 2000–2005 447 Mato Grosso do Sul, Sa˜o Paulo and Parana´
Central-West, Southeast and South
285.4 278 159.6 0.6 1.77 36.82 ,0.001
8 2000–2004 1 Rio de Janeiro Southeast 0.0 29 3.5 2.9 8.39 36.11 ,0.001
9 2001–2006 1 Santa Catarina South 0.0 9 0.1 40.1 114.34 33.73 ,0.001
10 2000–2003 3 Espı´rito Santo Southeast 17.2 32 5.9 1.9 5.46 28.12 ,0.001
11 2000–2004 10 Pernambuco Northeast 24.7 102 44.9 0.8 2.29 26.83 ,0.001
12 2002–2007 128 Minas Gerais and Espı´rito Santo
Southeast 125.6 91 45.9 0.7 2.00 17.35 0.007
13 2006–2011 9 Bahia Northeast 73.6 30 8.7 2.7 3.48 15.98 0.020
LLR: log likelihood ratio; RR: relative risk for the cluster compared with the rest of the country.
a
Leprosy-related mortality rates (per 100 000 inhabitants) during the clustering time.
at Universidade Federal do Cear� on February 1, 2016
http://trstmh.oxfordjournals.org/
specific control measures should be developed together with investments in improving the population’s living conditions and access to high-quality health.32,33In addition, there is the need of integrated health care, including assessment of patients after release from treatment, with the appropriate management and monitoring of leprosy reactions, in order to prevent progression to severe complications and deaths.12
Our study has some limitations. Despite the progress achieved during the observation period in terms of coverage of SIM database and improved quality of information about causes of death,16,25 data may be incomplete and present inconsistencies regarding quantity and quality of information over time and between regions.3,16,25,34In fact, coverage (ratio of reported/estimated deaths) varied considerably among Brazilian regions, from 75.3% in the North to 100.0% in the South in 2000; and 85.9% in the North to 98.5% in the South region in 2011 (http://tabnet. datasus.gov.br/cgi/idb2012/a1801b.htm). The proportion of deaths from ill-defined causes is also unequally distributed between socio-economic strata.3,16,17,25,34Interpretation of trend data and regional differences should consider these circumstances. The underlying cause of death may have been coded as a compli-cation or aggravation associated with leprosy, or as other causes not related to disease in which leprosy was recorded as an asso-ciated cause. We collected information based on multiple causes of death, i.e., the mention of leprosy in any field rather than only the underlying cause, to allow a more reliable estimation of the true magnitude of leprosy-related mortality in Brazil. In fact, leprosy-related mortality rates increased about 170% when mul-tiple causes of death were considered, evidencing an underestima-tion of leprosy-related deaths if only underlying causes of death are used as a basis for calculation. Another limitation is the instability of mortality data in expressing the risk of a rare event or when the population of the location is small.17,32To reduce this limitation, we used smoothed rates by means of the local Bayesian estimation method. Scan statistic also has some limitations. The cylindrical window imposed for scan space-time analysis to identify clusters may include places of low rates or with absence of deaths, if these places are surrounded by places characterized by high mor-tality rates.23In addition, the results produced are very sensitive to the parameter settings of the statistical program.35Despite these limitations, the data analysed are consistent and representative for a country of continental dimensions over a period of 12 years.
Conclusions
Leprosy, an NTD with limited scientific and political attention, is a neglected cause of death in Brazil. High-risk areas for leprosy-related mortality are located mainly in Brazil’s socio-economically most deprived regions. The disease is treatable, a cost-effective and free treatment is available, complications are preventable, and the impact of primary healthcare interventions is tremendous. Thus, sustainable control measures should include appropriate manage-ment of leprosy-related complications that may be related to death, such as severe leprosy reactions and adverse effects to MDT and other drugs. Systematic monitoring should include leprosy-related chronic complications and deaths. Mortality data, which are easily available, can be used to monitor ongoing disease control activities, not only for leprosy but also other infectious and non-infectious diseases.
Supplementary data
Supplementary data are available at Transactions online (http://trstmh.oxfordjournals.org/).
Authors’ contributions:FRM, AVAR, ANR and JH conceived the study; FRM and JH designed the study protocol; FRM, JH, CHA and ANR analyzed and interpreted the data; FRM and JH drafted the manuscript; AVAR, JH, ANR, RMM and MLWO critically revised the manuscript for intellectual content. All authors read and approved the final manuscript. FRM and JH are guarantors of the manuscript.
Acknowledgements: The authors thank the Coordenac¸a˜o de Aperfeic¸oamento de Pessoal de Nı´vel Superior (CAPES/Brazil) for granting a PhD Scholarship to FRM. JH is a class 1 research fellow at the Conselho Nacional de Desenvolvimento Cientı´fico e Tecnolo´gico (CNPq/Brazil).
Funding:None.
Competing interests:None declared.
Ethical approval:Approval for the study was obtained from the Ethical Review Board of the Federal University of Ceara´, Fortaleza, Brazil (process n8751 109/2014).
References
1 WHO. Global leprosy update, 2013; reducing disease burden. Wkly Epidemiol Rec 2014;89:389–400.
2 WHO. Leprosy. Fact sheet no. 101. Geneva: World Health Organization; 2014.http://www.who.int/mediacentre/factsheets/fs101/en/[accessed 20 October 2014].
3 WHO. Global Health Observatory Data Repository: Mortality and global health estimates. Geneva: World Health Organization; 2014.http:// apps.who.int/gho/data/node.main.CODWORLD?lang=en[accessed 15 November 2014].
4 Ministe´rio da Sau´de. Hansenı´ase: Situac¸a˜o Epidemiolo´gica - Dados. Brası´lia: Ministe´rio da Sau´de; 2014.http://portalsaude.saude.gov.br/ index.php/o-ministerio/principal/leia-mais-o-ministerio/705-secretaria- svs/vigilancia-de-a-a-z/hanseniase/11298-situacao-epidemiologica-dados[accessed 5 December 2014].
5 Rocha MCN, Lima RB, Stevens A et al. Deaths with leprosy as the underlying cause recorded in Brazil: use of data base linkage to enhance information [in Portuguese]. Cien Saude Colet 2015;20: 1017–26.
6 Ministe´rio da Sau´de. Integrated plan of strategic actions to eliminate leprosy, filariasis, schistosomiasis and onchocerciasis as a public health problem, trachoma as a cause of blindness and control of geohelmintiases: action plan 2011–2015 [in Portuguese]. Brası´lia: Ministe´rio da Sau´de; 2012.
7 Lombardi C. Epidemiological aspects of mortality among patients with Hansen’s disease in the State of Sa˜o Paulo, Brazil (1931–1980) [in Portuguese]. Rev Saude Publica 1984;18:71–107.
8 Meima A, van Veen NH, Richardus JH. Future prevalence of WHO grade 2 impairment in relation to incidence trends in leprosy: an exploration. Trop Med Int Health 2008;13:241–6.
9 Guinto RS, Doull JA, De Guia L. Mortality of persons with leprosy prior to sulfone therapy, Cordova and Talisay, Cebu, Philippines. Int J Lepr 1954;22:273–84.
at Universidade Federal do Cear� on February 1, 2016
http://trstmh.oxfordjournals.org/
10 Shen J, Liu M, Zhou M, Li W. Causes of death among active leprosy patients in China. Int J Dermatol 2011;50:57–60.
11 Ramos ARS, Ferreira SMB, Ignotti E. Deaths having leprosy as underlying cause among residents of Mato Grosso State, Brazil, 2000–2007 [in Portuguese]. Epidemiol Serv Sau´de 2013;22:273–84. 12 Rocha MCN, Garcia LP. Epidemiological investigation of reported
deaths having as the primary cause of leprosy occurred in Fortaleza, Ceara´, 2006–2011 [in Portuguese]. Epidemiol Serv Sau´de 2014;23: 277–86.
13 Australian Institute of Health and Welfare. Multiple causes of death in Australia: an analysis of all natural and selected chronic disease causes of death 1997–2007. Canberra: AIHW; 2012.http://www. aihw.gov.au/publication-detail/?id=10737422603 [accessed 15 December 2014].
14 WHO. Statistical Classification of Diseases and Related Health Problems (ICD): 10th revision. Geneva: World Health Organization; 2010.http:// apps.who.int/classifications/apps/icd/icd10online [accessed 12 May 2014].
15 Ministe´rio da Sau´de. Departamento de Informa´tica do Sistema U´nico de Sau´de. Sistema de Informac¸o˜es sobre Mortalidade (SIM). Brası´lia: Ministe´rio da Sau´de; 2014. http://tabnet.datasus.gov.br/cgi/sim/ dados/cid10_indice.htm[accessed 20 January 2014].
16 Martins-Melo FR, Alencar CH, Ramos AN Jr, Heukelbach J. Epidemiology of mortality related to Chagas’ disease in Brazil, 1999–2007. PLoS Negl Trop Dis 2012;6:e1508.
17 Martins-Melo FR, Ramos AN Jr, Alencar CH et al. Mortality of Chagas’ disease in Brazil: spatial patterns and definition of high-risk areas. Trop Med Int Health 2012;17:1066–75.
18 Instituto Brasileiro de Geografia e Estatı´stica–IBGE. Populac¸a˜o Residente–Brasil. 2014.http://tabnet.datasus.gov.br/cgi/deftohtm. exe?ibge/cnv/popuf.def[accessed 20 June 2014].
19 Kim HJ, Fay MP, Feuer EJ, Midthune DN. Permutation tests for joinpoint regression with applications to cancer rates. Stat Med 2000;19: 335–51.
20 Assunc¸a˜o RM, Barreto SM, Guerra HL, Sakurai E. Maps of epidemiological rates: a Bayesian approach [in Portuguese]. Cad Saude Publica 1998;14:713–23.
21 Cliff AD, Ord JK. Spatial Processes: Models and Applications. London: Pion; 1981.
22 Anselin L. Local Indicators of Spatial Association–LISA. Geographical Analysis 1995;27:93–115.
23 Kulldorff M. A spatial scan statistic. Communications in Statistics -Theory and Methods 1997;26:1481–96.
24 Ponte CMM, Gurgel MHC, Ponte GA et al. Metabolic disorders in emerging and neglected infectious diseases [in Portuguese]. Arq Bras Endocrinol Metab 2010;54:785–92.
25 Martins-Melo FR, Pinheiro MC, Ramos AN Jr et al. Trends in schistosomiasis-related mortality in Brazil, 2000–2011. Int J Parasitol 2014;44:1055–62.
26 Nakayama EE, Ura S, Fleury RN, Soares V. Renal lesions in leprosy: a retrospective study of 199 autopsies. Am J Kidney Dis 2001;38:26–30. 27 Noordeen S. Mortality in leprosy. Indian J Med Res 1972;60:439–45. 28 Penna ML, Oliveira ML, Penna GO. The epidemiological behaviour of
leprosy in Brazil. Lepr Rev 2009;80:332–44.
29 Lasto´ria JC, Abreu MA. Leprosy: review of the epidemiological, clinical, and etiopathogenic aspects - part 1. An Bras Dermatol 2014;89: 205–18.
30 Nery JS, Pereira SM, Rasella D et al. Effect of the Brazilian conditional cash transfer and primary health care programs on the new case detection rate of leprosy. PLoS Negl Trop Dis 2014;8:e3357.
31 Penna ML, Oliveira ML, Carmo EH et al. The influence of increased access to basic healthcare on the trends in Hansen’s disease detection rate in Brazil from 1980 to 2006. Rev Soc Bras Med Trop 2008;41:6–10.
32 Freitas LR, Duarte CE, LP Garcia L. Leprosy in Brazil and its association with characteristics of municipalities: ecological study, 2009–2011. Trop Med Int Health 2014;19:1216–25.
33 Cabral-Miranda W, Chiaravalloti Neto F, Barrozo LV. Socio-economic and environmental effects influencing the development of leprosy in Bahia, north-eastern Brazil. Trop Med Int Health 2014;19:1504–14. 34 Martins-Melo FR, Lima MS, Alencar CH et al. Epidemiological patterns
of mortality due to visceral leishmaniasis and HIV/AIDS co-infection in Brazil, 2000–2011. Trans R Soc Trop Med Hyg and Hygiene 2014; 108:338–47.
35 Cheung YTD, Spittal MJ, Williamson MK et al. Application of scan statistics to detect suicide clusters in Australia. PLoS One 2013; 8:e54168.
at Universidade Federal do Cear� on February 1, 2016
http://trstmh.oxfordjournals.org/