Ana Luiza BierrenbachI
Elisabeth Carmen DuarteII
Adriana Bacelar Ferreira GomesI
Maria de Fátima Marinho de SouzaI
I Secretaria de Vigilância em Saúde.
Ministério da Saúde. Brasília, DF, Brasil
II Departamento de Medicina Social.
Faculdade de Medicina. Universidade de Brasília. Brasília, DF, Brasil
Correspondence: Ana L Bierrenbach
Esplanada dos Ministérios, Bloco G Edifício Sede, 1º andar, sala 150 70058-900 Brasília, DF, Brasil E-mail: [email protected] Received: 1/30/2007
Approved: 3/27/2007
Mortality trends due to
tuberculosis in Brazil,
1980-2004
ABSTRACT
OBJECTIVE: To analyze the current profi le and trends of tuberculosis mortality in Brazil between 1980 and 2004.
METHODS: Descriptive study of tuberculosis as underlying or associate cause of death based on secondary data from the Brazilian Mortality Information System.
RESULTS: An irregular reduction in the number of tuberculosis deaths and mortality rates along the study period, from 5.8 in 1980 to 2.3 per 100,000 inhabitants in 2004, was seen. An accelerated reduction in mortality trend was seen until 1985 mostly in the states of Rio de Janeiro and São Paulo. There was a trend towards mortality occurring in older ages. In 2004, 4,981 tuberculosis cases were notifi ed as underlying cause of death in Brazil but it would increase by 50% if tuberculosis as associate cause and tuberculosis sequelae as underlying cause of death were added. In 2004, the highest mortality rates were found in the states of Pernambuco (5.4) and Rio de Janeiro (5.0) and in state capitals such as Recife (7.7) and Belém (5.8).
CONCLUSIONS: Given the well-known association between tuberculosis and Aids, the impact of AIDS epidemic indirectly refl ects on the mortality trends of tuberculosis.
KEY WORDS: Tuberculosis, mortality. Tuberculosis, epidemiology. Mortality registries. Mortality, trends. Brazil.
INTRODUCTION
Tuberculosis (TB) control essentially requires health managers to effectively take routine actions for early detection of new cases, swift intervention in high-risk groups, adequate treatment compliance, and death prevention especially in areas of high TB transmission. It is also unquestionable the importance of effective epidemiological surveillance for decision making guidance. The introduction of modern TB drug therapy based on long-term regular tre-atment and combined use of drugs has signifi cantly reduced TB fatality.5 In
Brazil, therapeutic regimens have now been used for new cases and retreatments since the end of 1970s.6 As multiresistant TB is not common in Brazil,3 TB
deaths are attributed to TB/AIDS comorbidity, delayed diagnosis and, above all, inconsistent drug therapy and treatment default.13 Thus, the focus should be
The objective of the present study was to assess the current TB profi le and mortality trends in Brazil during 1980 to 2004.
METHODS
TB mortality data for 1980–2004 from the Brazilian Ministry of Health Mortality Information System (SIM) were used in this study.
For joint record analysis, based on the International Statistical Classifi cation of Diseases and Health-Re-lated Problems – 9th and 10th revisions (ICD-9 and
ICD-10), codes of underlying TB causes were grouped as follows:
• Pulmonary tuberculosis (ICD-9: 100, 109 to 119; ICD-10: A150 to A153, A160 to A162 and A169); • Extra-pulmonary respiratory tuberculosis (ICD-9:
101 to 108 and 120 to 129; ICD-10: A154 to A159 and A163 to A168);
• Extra-pulmonary tuberculosis (ICD-9: 130 to 189; ICD-10: A170 to A199 and P370) defi ned as: – Central nervous system tuberculosis (ICD-9:
130 to 139; ICD-10: A170 to A179)
– Tuberculosis in other organs (ICD-9: 140 to 179; ICD-10: A180 to A189)
– Miliary tuberculosis (9: 180 to 189; ICD-10: A190 to A199)
– Congenital tuberculosis (ICD-10: P370) In addition, for 2002–2004 records, codes of under-lying causes and associated causes were grouped as follows:
• Tuberculosis (ICD-10: A15-A19) and its subclas-sifi cations described above.
• Tuberculosis sequelae (ICD-10: B90) • AIDS (ICD-10: B20 to B24)
• Infectious diseases (ICD-10: A00-B99, G00, G03-G04, N70-N73, J00-J06, J10-J18, J20-J22, H65-H66)11
• Other causes presented with their ICD codes. There were estimated annual TB mortality rates per 100,000 inhabitants by sex and age group for each Bra-zilian region and state. Two different age classifi cations were used; the fi rst one was divided into four age groups (children [0–19 years], young adults [20–39 years], adults [40–59 years]; and elderly [over 60 years]) and the second one into 11 age groups (0 to 4 years; 5 to
9 years; 10 to 14 years; 15 to 19 years; 20 to 29 years; 30 to 39 years; 40 to 49 years; 50 to 59 years; 60 to 69 years; 70 to 79 years; and 80 years or more).
For the analysis by Brazilian regions and states, ad-justed mortality rates by age distribution were directly estimated for the year 2004 using the Brazilian popu-lation as reference based on 2000 Popupopu-lation Census of
Instituto Brasileiro de Geografi a e Estatística (IBGE – Brazilian Institute of Geography and Statistics). Descriptive statistics were applied for data presentation and triennial TB mortality rates by state were estimated for describing TB time progress.
RESULTS
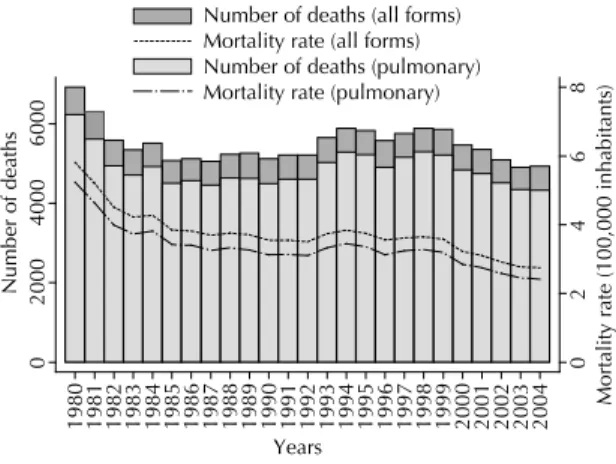
Figure 1 shows annual TB mortality rates (all clinical forms) for the period 1980–2004. There can be noted an overall declining trend, from 6,916 deaths in 1980 (5.8 per 100,000 inhabitants) to 4,928 deaths in 2004 (2.8 per 100,000). During this period, there were slight varia-tions resulting from increments in the number of deaths in the period 1993–1998. Additionally, 6,231 deaths due to pulmonary TB accounted for 87.8% of all TB deaths in 2004 and this proportion remained almost the same over the years studied and by Brazilian regions. TB death rates by age and sex were remarkably different in the period 1980–2004 (Figure 2). Age distribution of TB cases showed relatively less individuals affected in the age group under 19 and a less signifi cant decline in those aged 20–39 years mostly starting from 1993. On the other hand, rates remained the same in those aged 40–59 years and TB deaths increased in those aged 60 years or more. In 2004, of all TB deaths with known age information, 56.1% were in those aged 50 years or more compared to 45.1% in 1980.
Figure 1. Deaths and tuberculosis mortality rate (per 100,000 inhabitants) for all tuberculosis forms and pulmonary TB, Brazil, 1980–2004.
0
2
46
8
Mortality rate (100,000 i
nhabitan
ts)
0
2000
4000
6000
Number of deaths
1980 1981 1982 1983 1984 1985 1986 1987 1988 1989 1990 1991 1992 1993 1994 1995 1996 1997 1998 1999 2000 2001 2002 2003 2004
Years
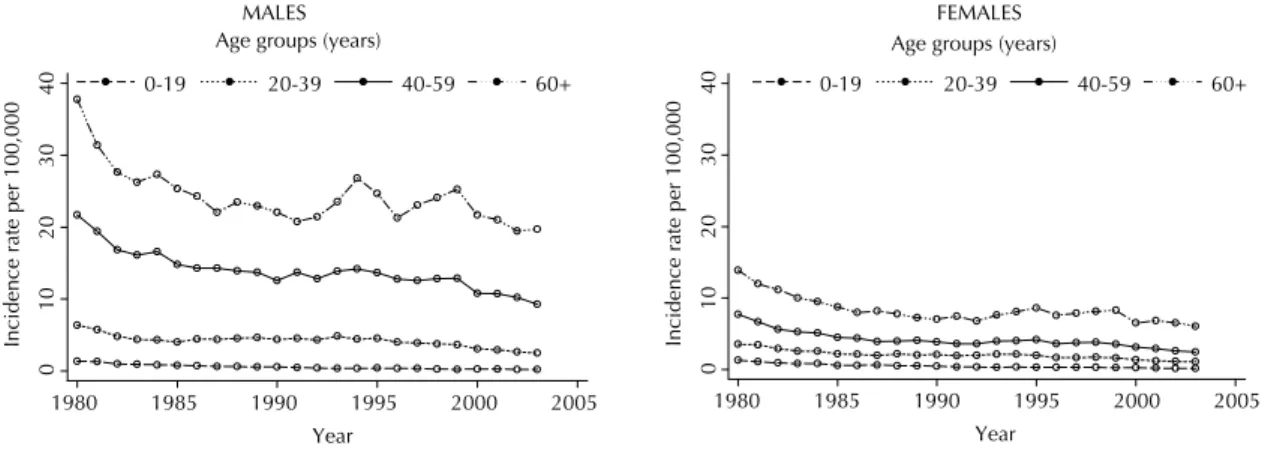
Figure 3 shows time progress of annual TB mortality rates (all forms) by sex and age groups. In children, there can be noted a progressively slow rate reduction in both males and females. Both male and female young adults had declining rates until 1985 and then slightly increasing rates in males and steady rates in females over the following 10 years and then declining rates starting from 1995. For both male and female adults and elderly, there was fi rst rate reduction followed by relative stabilization and then slow decline in rates for a second time. However, in the period 1993–2000, alternation between marked increase and reduction of TB mortality rates was seen in men aged 60 years or more. Figure 3 also shows increased risk of TB death as age increases in both males and females but more remarkable in the former. In 2004, among males, the risk of TB death in young adults was 12.3 times grea-ter compared to that found in children; this same risk in adults was 50.9 times greater, and in elderly was 98.6 times greater. In this same year, among females, compared to children, the risk of TB death in young adults was 5.4 greater, in adults was 12.5 greater, and in elderly was 31.1 greater.
Based on 2004 data, risk of TB death was similar in both men and women aged 0–19 years; 2.3 times greater in young adult men than women; four times greater in adult men than women; and 3.1 times greater in elderly men than women.
Figure 4 illustrates the progression of crude annual TB mortality rates by region. In all regions, rates in 2004 were lower than in 1980. However, a more marked reduction was seen in the beginning of the period studied. In the southeastern region, there was rate reduction until 1985 followed by progressive increase until 1995 and then reduction again. In the remaining Brazilian regions, crude annual mortality rates fi rst slowed down then stabilized from the end of 1980 until the end of 1990s.
With respect to the progression of crude triennial TB mortality rates by state, overall they were more similar within the same region than between regions. Some states, such as Pernambuco and Rio de Janeiro, had remarkable higher rates. A change in declining trends of TB mortality rates was more evident and detected earlier in the states of Rio de Janeiro, São Paulo and Federal District. Increasing crude rates were seen in Rio de Janeiro in 1986 but this same increase was only evidenced in São Paulo and Federal District after 1989. By the end of 1980s, crude TB mortality rates in the state of Ceará declined and came close to those found in the northeastern region, except for Pernambuco. In the state of Tocantins, death notifi cation in SIM started by the end of 1980s.
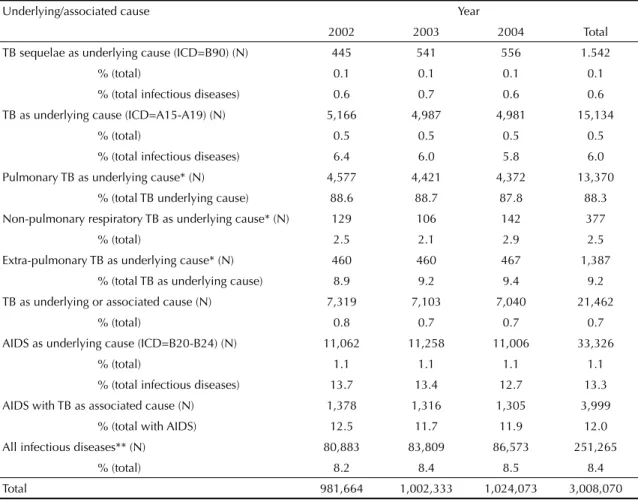
Table 1 shows the number and proportion of deaths recorded in SIM due to the following causes of death: TB and its clinical forms, TB sequelae, AIDS and in-fectious diseases. Between 2002 and 2004, deaths due to TB as underlying cause accounted for 0.5% of all deaths and 6% of all reported deaths due to infectious diseases. After adding deaths due to TB as underlying cause with deaths due to TB as associated cause, this
Figure 2. Proportional tuberculosis mortality by age groups (all forms). Brazil, 1980–2004.
0
20
40
60
80
100
%
1980 1981 1982 1983 1984 1985 1986 1987 1988 1989 1990 1991 1992 1993 1994 1995 1996 1997 1998 1999 2000 2001 2002 2003 2004
0-19 20-39 40-59 60+
Age groups (years)
Figure 3. Annual tuberculosis mortality rates (all forms) by age group and sex. Brazil, 1980–2004.
01
0
2
0
3
0
40
Incidence rate per 100,000
1980 1985 1990 1995 2000 2005
Year
0-19 20-39 40-59 60+
Age groups (years)
1980 1985 1990 1995 2000 2005
Year
01
0
2
0
3
0
4
0
Incidence rate per 100,000
0-19 20-39 40-59 60+
Age groups (years)
this group. Other TB forms accounted for 11.8% of all TB deaths in this same year; and non-specifi ed miliary TB was the most common non-respiratory TB form. Of 4,396 deaths notifi ed due to respiratory TB, 93.9% did not have bacteriological or histological confi rmation. Respiratory TB (either specifi ed or not), with or without information on bacilloscopy or culture results, accoun-ted for 88.3% of all TB deaths in 2004.
Of TB deaths notifi ed in the period 1980–2004, pul-monary TB was the most common form seen in all age groups and increased with age. In contrast, the proportion of central nervous system and miliary TB decreased as age increased.
In 2004, 32.3% of TB deaths were reported in state capitals and Federal District, and 56.5% in metropolitan areas (Table 4). The proportion of deaths in capitals and metropolitan areas was different by regions and states. There was a small proportion of TB deaths in capitals proportion increases to 0.7% of all deaths reported in
Brazil in this period. TB deaths compared to deaths due to infectious diseases decreased from 6.4% in 2002 to 5.8% in 2004. The sum of deaths classifi ed as TB sequelae and deaths due to TB as associated cause but with other diseases as underlying cause revealed the same number as deaths due to TB as underlying cause. Of all deaths due to AIDS as underlying cause, 12% had TB as an associated cause.
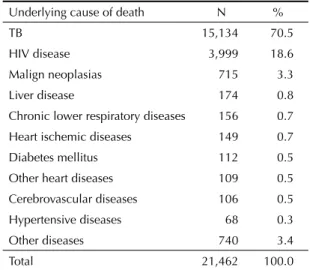
Of all deaths having TB as associated cause, 70.5% also had TB as underlying cause and 18.6%, had AIDS (Table 2).
Table 3 shows the number and proportion of the 10 most prevalent TB clinical forms (ICD-10: A15-A19) as underlying cause of death in 2004. Pulmonary TB (ICD-10: A162) and non-specifi ed respiratory TB (ICD-10: A169), both with no information on either bacilloscopy or culture results, accounted for 81.5% of all deaths in
Table 1. Tuberculosis deaths and proportional mortality by underlying/associated cause. Brazil, 2002–2004.
Underlying/associated cause Year
2002 2003 2004 Total
TB sequelae as underlying cause (ICD=B90) (N) 445 541 556 1.542
% (total) 0.1 0.1 0.1 0.1
% (total infectious diseases) 0.6 0.7 0.6 0.6 TB as underlying cause (ICD=A15-A19) (N) 5,166 4,987 4,981 15,134
% (total) 0.5 0.5 0.5 0.5
% (total infectious diseases) 6.4 6.0 5.8 6.0
Pulmonary TB as underlying cause* (N) 4,577 4,421 4,372 13,370 % (total TB underlying cause) 88.6 88.7 87.8 88.3
Non-pulmonary respiratory TB as underlying cause* (N) 129 106 142 377
% (total) 2.5 2.1 2.9 2.5
Extra-pulmonary TB as underlying cause* (N) 460 460 467 1,387 % (total TB as underlying cause) 8.9 9.2 9.4 9.2
TB as underlying or associated cause (N) 7,319 7,103 7,040 21,462
% (total) 0.8 0.7 0.7 0.7
AIDS as underlying cause (ICD=B20-B24) (N) 11,062 11,258 11,006 33,326
% (total) 1.1 1.1 1.1 1.1
% (total infectious diseases) 13.7 13.4 12.7 13.3
AIDS with TB as associated cause (N) 1,378 1,316 1,305 3,999
% (total with AIDS) 12.5 11.7 11.9 12.0
All infectious diseases** (N) 80,883 83,809 86,573 251,265
% (total) 8.2 8.4 8.5 8.4
Total 981,664 1,002,333 1,024,073 3,008,070
Source: Mortality Information System (SIM).Brazilian Ministry of Health ICD – International Classifi cation of Diseases and Health-Related Problems TB: tuberculosis
* Pulmonary TB: A150-A153, A160-A162 and A169; Extra-pulmonary respiratory TB: A154-A159, A163-A168; Extra-pulmonary TB: A170-A199.
compared to all deaths in the states of Santa Catarina (5.4%), Tocantins (7.1%), and Espírito Santo (11.4%). On the other hand, the capitals of the states of Acre (66.7%) and Roraima (60.0%) had markedly high TB deaths compared to these states.
As for adjusted TB mortality rates in 2004, the northern and northeastern regions had higher rates, followed by southeastern, mid-western and southern regions. The states of Pernambuco and Rio de Janeiro had the highest adjusted rates and Recife and Belém were the capitals showing the highest rates (Table 4).
DISCUSSION
TB mortality studies generally include only TB as underlying cause of death. However, it is useful for the Brazilian National Program for Tuberculosis Control to have input on deaths due to TB as associated cause and deaths due to TB sequelae as underlying cause. Adding up these deaths to those due to TB as underlying cause in 2004 resulted in 50% increase of total TB-related
deaths. Deaths due to TB as underlying or associated cause are indicators of the effectiveness of current care provided to TB patients while deaths due to TB sequelae are indicators of the effectiveness of care provided to patients in the past. The recommended care actions in-clude detection of symptomatic respiratory cases, early diagnosis and timely and effective treatment.
In the period studied, when TB was considered as un-derlying cause of death, there was evidenced reduction of cases and annual mortality rates for all TB forms in all Brazilian regions. As expected, this declining trend was not constant over time. In all regions, mortality rates showed a more remarkable declining trend until 1985-86 followed by stabilization or increase and then decline again.
Figure 4. Crude annual tuberculosis mortality rates per 100,000 inhabitants (all forms). Brazil, 1980–2004.
0
2
46
8
Rate per 100,000 i
nhabitants
1980 1981 1982 1983 1984 1985 1986 1987 1988 1989 1990 1991 1992 1993 1994 1995 1996 1997 1998 1999 2000 2001 2002 2003 2004
Year Brazil South
Northeast Southeast Midwest
North
Regions Table 2. Number and proportion of deaths by underlying cause due to tuberculosis as associated cause. Brazil, 2002–2004.
Underlying cause of death N %
TB 15,134 70.5
HIV disease 3,999 18.6
Malign neoplasias 715 3.3
Liver disease 174 0.8
Chronic lower respiratory diseases 156 0.7
Heart ischemic diseases 149 0.7
Diabetes mellitus 112 0.5
Other heart diseases 109 0.5 Cerebrovascular diseases 106 0.5
Hypertensive diseases 68 0.3
Other diseases 740 3.4
Total 21,462 100.0
Source: Mortality Information System (SIM)/Brazilian Ministry of Health
Table 3. Number and proportion of TB deaths by clinical forms defi ned as underlying cause of death, Brazil, 2004.
Clinical forms/underlying cause of death ICD N %
Pulmonary TB, no information on bacilloscopy or culture results A162 3,689 74.1 Non-specifi ed respiratory TB, no information on bacilloscopy or culture results A169 367 7.4
Miliary TB, non-specifi ed A199 267 5.4
Pulmonary TB, confi rmed but not specifi ed A153 190 3.8
Bacillary pulmonary TB A150 79 1.6
Tuberculosis pleurisy, no information on bacilloscopy or culture results A165 71 1.4
Tuberculosis meningitis A170 58 1.2
Tuberculosis of intestines, peritoneum and mesenteric ganglia A183 29 0.6
Other nervous system TB A178 23 0.5
Bone and joint TB A180 22 0.4
Other TB forms - 186 3.7
Total 4,981 100.0
Although health indicators improved in Brazil in the period 1980–1985,1 increasing TB mortality rates were
found. This discrepancy can likely be explained by the impact of AIDS epidemic.13,16 The main fi ndings of this
study that corroborate, though indirectly, this impact include increasing TB mortality rates that were more marked and at earlier ages in the states of São Paulo and Rio de Janeiro, and increased TB deaths among male
Table 4. Number of deaths, crude and adjusted rates (by age distribution) of TB mortality (all forms) per 100,000 inhabitants by states, regions, state capitals, and metropolitan areas. Brazil, 2004.
State/Region
Total Capital Metropolitan area** Capital Total
Metro-politan
area Total
N Crude rate
Adj. rate* N
Crude rate
Adj. rate* N
Crude rate
Adj.
rate* % %
Acre (AC) 18 2.9 4.2 12 4.3 5.9 - - - 66.7
-Amazonas (AM) 88 2.8 4.2 51 3.3 4.6 - - - 58.0
-Amapá (AP) 6 1.1 2 2 0.6 1.1 - - - 33.3
-Pará (PA) 170 2.5 3.3 81 5.9 6.5 98 5 5.8 47.6 57.6
Rondônia (RO) 32 2.2 3.1 11 3.1 4.5 - - - 34.4
-Roraima (RR) 5 1.4 2.2 3 1.3 2.1 - - - 60.0
-Tocantins (TO) 14 1.1 1.4 1 0.5 0.7 - - - 7.1
-North 331 2.4 3.2 161 3.7 4.9 178 3.6 4.8 48.6 53.8
Alagoas (AL) 70 2.4 2.7 36 4.2 4.7 41 3.8 4.4 51.4 58.6
Bahia (BA) 412 3 3.2 105 4 4.4 143 4 4.4 25.5 34.7
Ceará (CE) 214 2.7 2.9 78 3.4 3.6 106 3.3 3.6 36.4 49.5
Maranhão (MA) 159 2.7 3.2 46 4.9 5.8 55 4.2 5.2 28.9 34.6
Paraíba (PB) 79 2.2 2.2 12 1.9 1.9 - - - 15.2
-Pernambuco (PE) 436 5.2 5.4 143 9.7 9.1 266 7.5 7.7 32.8 61.0 Piauí (PI) 64 2.2 2.3 18 2.4 2.9 23 2.5 2.9 28.1 35.9
Rio Grande do Norte
(RN) 47 1.6 1.6 17 2.3 2.4 24 2 2.2 36.2 51.1
Sergipe (SE) 39 2 2.3 12 2.5 2.6 - - - 30.8
-Northeast 1.511 3 3.2 467 4.3 4.6 682 4.3 4.6 30.9 45.1
Distrito Federal (DF) 22 1 1.3 22 1 1.3 - - - 100.0 -Goiás (GO) 68 1.3 1.4 21 1.8 1.9 38 1.4 1.6 30.9 55.9
Mato Grosso do Sul (MS) 68 3.1 3.3 11 1.5 1.6 - - - 16.2
-Mato Grosso (MT) 76 2.8 3.7 21 4.1 5.3 - - - 27.6
-Midwest 243 1.9 2.2 75 1.6 1.9 92 1.5 1.8 30.9 37.9 Espírito Santo (ES) 70 2.1 2.2 8 2.6 2.4 33 2.1 2.2 11.4 47.1
Minas Gerais (MG) 333 1.8 1.7 53 2.3 2.1 114 1.9 2 15.9 34.2
Rio de Janeiro (RJ) 910 5.8 5 393 6.4 5.1 754 6.8 5.7 43.2 82.9
São Paulo (SP) 1.053 2.7 2.5 370 3.4 3.1 712 3.1 3 35.1 67.6 Southeast 2.369 3 2.8 824 4.2 3.6 1.613 3.9 3.6 34.8 68.1
Paraná (PR) 191 1.9 1.9 27 1.6 1.5 71 1.7 1.7 14.1 37.2
Rio Grande do Sul (RS) 281 2.6 2.3 54 3.8 3.1 142 3.6 3.3 19.2 50.5
Santa Catarina (SC) 56 1 1 3 0.8 0.7 36 1 1 5.4 64.3
South 527 2 1.9 84 2.4 2.1 249 2.1 2 15.9 47.2
Brazil 4.981 2.8 2.8 1.611 3.8 3.6 2.814 3.5 3.5 32.3 56.5
adults starting from 1985. These fi ndings are parallel to the early epidemiology of AIDS in Brazil.* AIDS was only included as cause of death in the ICD in its 10th revision in 1990.4 Thus, it can be assumed that the
declining trend of TB mortality rates in the states de São Paulo and Rio de Janeiro starting from 1990 and the slight, if any, increase seen in other states over the decade refl ect the use of AIDS disease code instead of TB to defi ne underlying cause of death. A trend analysis of causes associated to TB death could further support this hypothesis. At the same time, there should be investigated improved disease control.
In less developed countries, TB remains a major cause of death in AIDS patients.8 Prevention of TB
develo-pment is, at least to some extent, possible in patients with HIV/AIDS through screening and treatment of latent TB as recommended in PNCT guidelines.** Despite that and due to the fact that TB is a treatable disease, TB was the associated cause in 12% of AIDS deaths reported in SIM between 2002 and 2004. As it is a consumptive disease, TB can also negatively affect the progression of other diseases, which explains the
fi nding of TB as associated cause of death in neopla-sias and liver diseases among others.17 In deaths due
to pulmonary neoplasias and chronic lower pulmonary diseases showing TB as associated cause, TB may have caused delayed diagnosis or misdiagnosis and negative-ly affected the outcome.9 Clinical cohort or case studies
could provide input to support this hypothesis. Age transition in TB incidence and mortality for more advanced age groups found in the present study and other studies2,7,10 is likely to result from a
concur-rence of several factors. These may be: (relative and absolute) growing elderly population due to reduced early mortality and increased life expectancy;*** the fact that elderly have lived through times where TB transmission was much higher associated to potential cumulative infection; increased risk of developing TB among elderly due to age-specifi c immunodefi ciency; and greater likelihood of atypical TB presentations in elderly and association with other diseases, which result in delayed diagnosis and prevent early treatment as well as higher fatality.7
Alternatively, reduction in the absolute number of cases, proportional mortality and mortality rates in children can be explained by several factors such as
reduced TB incidence in adult population especially the highly contagious bacillary pulmonary form since affected adults used to be the main source of infection for children. These fi ndings are also supported by pro-gressively increased BCG vaccine coverage in Brazil in the last two decades, reaching almost 100% over the last 10 years.12 BCG protection against invasive
TB forms during childhood has been estimated above 80% in many studies, including in Brazil.15 The present
study showed that mortality due to miliary and central nervous system TB accounted for a great deal of deaths in children mostly those under nine. However, given that children deaths have been low relative to all de-aths since 1980, this reduction did not affect the total number of deaths and mortality rates in all age groups in the period studied.
Studies on mortality based on secondary data have limitations associated to the notifi cation system and database. Over the period studied, signifi cant deve-lopments have been seen in SIM coverage as well as quality of information on causes of death.14
Nonethe-less, underreporting of deaths and missing information on defi ned cause of death are still seen for children under one and elderly, poor and rural populations es-pecially in the northern and northeastern regions.*** These may have introduced information bias in trend analyses of mortality rates and increased rates found in the analysis period may have been overestimated or decreased rates may have been underestimated over the years. However, proportional mortality tends to be less affected by this bias. Moreover, though typically described as poor population disease, TB deaths occur predominantly among adults in capitals and other cities of metropolitan areas. It is thus unlikely that recent changes in coverage and proportion of deaths due to ill-defi ned cause in SIM have affected or will affect total TB deaths. The relative constant proportion of TB deaths compared to total overall deaths and deaths due to infectious diseases from 2002 to 2004 suggest an adequate or at least ongoing coverage of TB deaths during the period studied.
In conclusion, PNCT should incorporate actions aiming to reduce deaths not only due to TB as underlying cause but also TB as associated cause as well as taking into consideration the increasing age trend of patients at risk of TB death.
* Fundação Nacional de Saúde. Situação da prevenção e controle das doenças transmissíveis no Brasil. Brasília; 2002. ** Ministério da Saúde. Tuberculose - Guia de vigilância epidemiológica. Brasília: Fundação Nacional de Saúde; 2002.
1. Antunes JLF, Waldman EA, Moraes M. A tuberculose através do século: ícones canônicos e signos de combate à enfermidade. Cienc Saude Coletiva. 2000;5(2):367-79.
2. Barnes PF, Leedom JM, Chan LS, Wong SF, Shah J, Vachon LA, et al. Predictors of short-term prognosis in patients with pulmonary tuberculosis. J Infect Dis. 1988;158(2):366-71.
3. Braga JU, Barreto AW, Hijjar MA. Nationwide survey of tuberculosis drug-resistance in Brazil. Int J Tuberc Lung Dis 1999;3 (Suppl. 1):S121.
4. Buchalla CM, Laurenti R, Ribeiro AF, Nitrini DR, Guarnieri CE, Carnaúba EL, Neves MACC. Avaliação do uso da Classifi cação Internacional de Doenças para codifi car a síndrome da imunodefi ciência adquirida. Rev Saude Publica.1996;30(5):479-82.
5. Caminero Luna JA. Tratamiento de la Tuberculosis. Neumologia 1992;1:8:15-25.
6. Campos H, Fiuza de Melo FA. Efetividade do esquema 3 no retratamento da tuberculose na rotina das unidades de saúde. Bol Pneumol Sanit 2000;8:7-14.
7. Chaimowicz F. Age transition of tuberculosis incidence and mortality in Brazil. Rev Saude Publica. 2001;35(1):81-7.
8. Corbett EL, Watt CJ, Walker N, Maher D, Williams BG, Raviglione MC, et al. The growing burden of tuberculosis: global trends and interactions with the HIV epidemic. Arch Intern Med. 2003;163(9):1009-21.
9. Franco R, Santana MA, Coelho Filho JC, Pereira-Silva JL. Pseudotumoral form of primary progressive
tuberculosis: a diagnosis to be considered. Braz J Infect Dis. 2003;7(2):166-70.
10. Humphries MJ, Byfi eld SP, Darbyshire JH, Davies PD, Nunn AJ, Citron KM, et al. Deaths occurring in newly notifi ed patients with pulmonary tuberculosis in England and Wales. Br J Dis Chest.1984;78(2):149-58.
11. Lopez AD, Mathers CD, Ezzati M, Jamison DT, Murray CJL. Global and regional burden of disease and risk factors, 2001: systematic analysis of population health data. Lancet. 2006;367(9524):1747-57.
12. Ministério da Saúde. Análise da situação de
tuberculose nos anos noventa e início da década atual. Bol Pneumol Sanit. 2005;13(3):133-87.
13. Oliveira HB, Marin-Leon L, Cardoso JC. Perfi l de mortalidade de pacientes com tuberculose relacionada à comorbidade tuberculose-AIDS. Rev Saude Publica.2004;38(4):503-10
14. Rede Interagencial de Informações para a Saúde. Indicadores básicos de saúde no Brasil: conceitos e aplicações. Brasília: Organização Pan-Americana de Saúde; 2002.
15. Rodrigues LC, Diwan VK, Wheeler JG. Protective effect of BCG against tuberculous meningitis and miliary tuberculosis: a meta-analysis. Int J Epidemiol. 1993;22(6):1154-8.
16. Ruffi no-Netto A. Avaliação do excesso de casos de tuberculose atribuídos a infecção HIV/Aids: ensaio preliminar. Rev Saude Publica.1995;29(4):279-82.
17. Santo AH, Pinheiro CE, Jordani MS. Causas múltiplas de morte relacionadas à tuberculose no Estado de São Paulo, 1998. Rev Saude Publica. 2003;37(6):714-21. REFERENCES