Carmen Justina GamarraI Joaquim Gonçalves ValenteII Gulnar Azevedo e SilvaII
I Programa de Estudante Convênio de Pós-Graduação. Instituto de Medicina Social (IMS). Universidade do Estado do Rio de Janeiro (UERJ). Rio de Janeiro, RJ, Brasil II IMS-UERJ. Rio de Janeiro, RJ, Brasil Correspondence:
Carmen Justina Gamarra Instituto de Medicina Social – UERJ R. São Francisco Xavier, 524 Pavilhão João Lyra Filho, 7º andar Blocos D e E Maracanã
20550-900 Rio de Janeiro, RJ, Brasil E-mail: [email protected] Received: 8/10/2009
Approved: 2/5/2010
Article available from: www.scielo.br/rsp
Correction for reported cervical
cancer mortality data in Brazil,
1996–2005
ABSTRACT
OBJECTIVE: To develop a methodology for correction of reported cervical cancer deaths in Brazil.
METHODS: Data on 9,607,177 cancer deaths were obtained from the Brazilian National Mortality Database for the period between 1996 and 2005. For correction of underreporting of deaths, factors generated by the Global Burden of Disease Study in Brazil-1998 were used. Proportional distribution was used in order to correct the categories of unknown, incomplete or ill-defi ned death diagnosis. The corrections were applied to each Brazilian state and the results were presented for Brazil nationwide, macroregions, and geographical areas (capital, other cities of metropolitan areas and interior cities) as percent variability of cervical mortality rates before and after correction. Corrections were analyzed by multivariate linear regression with interaction terms between macroregion and geographical area.
RESULTS: After correction, cervical cancer mortality rates showed an increment of 103% nationwide, ranging between 35% (Southern region capitals) and 339% (Northeastern region interior cities). The reallocation of cervical cancer deaths not otherwise specifi ed resulted in greater mortality rate increments. The percent correction by year of death revealed steady trends nationwide.
CONCLUSIONS: The study results showed that the proposed methodology was appropriate for the correction of cervical cancer mortality rates in Brazil. It evidenced that cervical cancer mortality is even higher than that reported.
DESCRIPTORS: Uterine Cervical Neoplasms, mortality. Mortality Registries. Underregistration. Information Systems. Brazil.
INTRODUCTION
Cervical cancer is characteristically a preventable disease that can be detected in early, non-invasive forms. Yet cervical cancer is still an ongoing serious chal-lenge for public health authorities, especially in developing countries accounting for 83% of all cases and 86% of all deaths from cervical cancer.10
According to the Brazilian Ministry of Health,a age-adjusted cervical cancer
mortality rates increased from 4.97 to 5.29 per 100,000 women-years for the period 1979 to 2005, a 6.4% increment in 26 years. However, these rates are low compared to other Latin American countries such as Venezuela (15.2), Ecuador (18.6), Bolivia (22.2), Nicaragua (26.1), and Haiti (53.5).3
The Brazilian National Mortality Database (SIM) faces many challenges, mainly related to underreporting of deaths and deaths from ill-defi ned causes.12 They vary
across Brazilian regions but are mostly serious in the North and Northeast regions. It can be thus assumed that reported rates have been underestimated, making it necessary to assess the actual impact of cervical cancer in Brazil.
In addition to SIM-related general issues, there is a particular obstacle specifi c to cervical cancer. A signifi -cant proportion of deaths from cervical cancer is reported as neoplasm of “uterus, not otherwise specifi ed (NOS),” which hinders the assessment of the actual impact of this disease. In an attempt to address this issue and generate more realistic statistics, researchers7,9,19 have included in
their analysis total cases of uterine cancer not otherwise specifi ed, in addition to cervical cancer cases. In fact, Wünsch & Moncau (2002)19 claim that this inclusion has
allowed to reset trends based on socioeconomic profi le of populations and Brazilian macroregions.
The literature describes several approaches that aim to correct issues related to mortality databases and death certifi cates reporting as primary cancer site “uterus, NOS.”1,2,4,14,16,17 The objective of the present study was
to develop a methodology for correction of reported cervical cancer deaths in Brazil by combining two approaches: correction of SIM-related issues and those specifi cally related to death certifi cates reporting as primary cancer site “uterus, NOS.”
METHODS
All 9,607,177 deaths reported by SIM for the period between 1996 and 2005 were included in the correction of reported cervical cancer deaths. Of them, 39,618 deaths were from cervical cancer. Data prior to 1996 were excluded because factors generated by the Global Burden of Disease Study in Brazil for the year 1998 were used for correction of underreporting of deaths.b The
application of these factors would not be suitable for data prior to 1996 because issues related to underreporting and quality of death certifi cates were more signifi cant in the early years after SIM implementation.12
Underreporting of deaths was corrected using factors indirectly generated by the Global Burden of Disease Study in Brazil for the year 1998.b Underreporting of
deaths in those under one6 and those one year old and
older15 was thus separately corrected by gender and
macroregion. These factors were recalculatedc since in
that study the corrections were made by macroregion as a whole, disregarding capital cities, other cities in
metropolitan areas and interior cities. These aspects were taken into consideration in the present study, but only data from interior cities was corrected assuming that reporting of deaths was close to 100% in capital cities and other cities in metropolitan areas nationwide. For the states of Rio de Janeiro, São Paulo, Mato Grosso do Sul and Rio Grande do Sul reported deaths in interior cities were not corrected assuming that reporting of deaths was also close to 100%. Based on the reference study correction factors were recalculated for so-called “natural” causes of death assuming that reporting of deaths from external causes was close to 100%.
Deaths with unknown (missing), incomplete or ill-defi ned data in SIM (variables such as gender; macroregion; primary cause of death “uterus, NOS;” incomplete diagnoses; and ill-defined signs and symptoms) were corrected applying proportional distribution of deaths coded in each chapter of the International Statistical Classifi cation of Diseases and Related Health Problems – 10th revision (ICD-10) among deaths from specifi ed causes, by age groups and excluding external causes.17 For example, all deaths
from cancer of the uterus, NOS were redistributed by age, macroregion, geographic area and year among deaths from cervical and uterine body cancer following its original proportion. To estimate missing data on age, single imputation was applied and missing data were replaced by median age, taking into account macrore-gion, gender and cause of death (three digits).
Since deaths from cancer are most often better reported than other causes of death,12 the representation of
cancers among ill-defi ned causes would be smaller, making a proportional reallocation of all deaths from ill-defi ned causes incorrect. Thus, in an attempt to avoid overestimating deaths from cervical cancer, and because there was no other consensus for reallocation of deaths from ill-defi ned causes, 50% of the estimated weight was attributed to neoplasms by gender, age, geographic area and type of cancer.
Overall, the correction process comprised eight steps:
1. correction of underreporting;
2. imputation of unknown age;
3. reallocation of deaths with unknown gender;
4. reallocation of deaths with unknown macroregion;
5. reallocation of cancer deaths with incomplete diag-nosis coded ICD-10 C578 and C579, corresponding to cancer of female genital organs, among cancers of female genital organs;
b Gadelha AMJ, Leite IC, Valente JG, Schramm JMA, Portela, MC, Campos MR. Relatório fi nal do Projeto estimativa da carga de doença do Brasil–1998. Rio de Janeiro: Fiocruz; 2002.
6. reallocation of cancer deaths with an incomplete diagnosis coded ICD-10 C76 to C80 and C97, corre-sponding to different organs, among all cancers;
7. reallocation of deaths from cancer of the uterus, NOS (ICD C55) among cancers of the uterus and cervix, and
8. reallocation of deaths with ill-defi ned causes (ICD R00 to R99) among all causes of death except external causes.
There were included all deaths identified as from cervical cancer after correction, coded ICD-10 C53.
Non-corrected cervical cancer mortality rates were estimated based on deaths obtained from SIM whereas corrected rates were estimated from deaths identifi ed as from cervical cancer after the fi nal process of correction and based on their estimated populations. Rates were also estimated for each stage of correction.
Cervical cancer mortality rates were fi rst estimated for all ages (Table 1) and for the age group 20–79 years old (Tables 2 to 5), aggregated into fi ve-year age groups. The rates were then adjusted for age using a direct method based on world population.8 After adjusting for
all age groups, expected deaths of those under 20 years and of those 80 years and more were excluded to obtain adjusted rates for the age group 20–79 years old.
Annual mortality rates from cervical cancer and average rates for the entire period (1996–2005), by age group, as well as crude rates and standardized by age were estimated for Brazil nationwide, for each macroregion and geographic division (capital, interior and other metropolitan areas). The current geographical division according to the Brazilian Institute of Geography and Statistics (IBGE)d was used to aggregate geographic
areas into capital cities, other cities in metropolitan areas and interior cities. The category corresponding to “other cities in metropolitan areas” was created from a list of cities in nine reference metropolitan areas used in offi cial IBGE publications, excluding capital cities. The nine metropolitan areas were distributed as follows: one in the North (metropolitan area of Belem); three in the Northeast (metropolitan area of Recife, Fortaleza, and Salvador); three in the Southeast (metropolitan area of Belo Horizonte, Rio de Janeiro and São Paulo); and two in the South (metropolitan area of Curitiba and Porto Alegre). Following this classifi cation, the Central-west region does not have a metropolitan area.
Population-based and mortality data were collected from the Brazilian Ministry of Health Database (DATASUS) website.e
The variability of rates before and after correction of deaths was assessed by percent variation [(corrected rate / non-corrected rate) × 100]. Multiple regression analysis was performed to assess factors associated with variations of mortality rate corrections, where the dependent variable was the ratio between corrected and non-corrected annual cervical mortality rates (corrected rate / non-corrected rate). The independent variables included in the model were: calendar year, macrore-gion, and geographical area (capital, other cities in metropolitan areas and interior). The Southern region and geographical area of capital cities were considered reference categories.
For the assessment of potential interactions between Brazilian macroregions and their related geographic areas seven region-area interaction terms were fi rst included in the multivariate regression model: (1) North region and the interior area; (2) Northeast region and the interior area; (3) Southeast region and the interior area; (4) Central-west region and the interior area; (5) North region and other cities of metropolitan areas; (6) Northeast region and other cities of metropolitan areas; and (7) Southeast region and other cities of metropolitan areas. In the fi nal model, the terms (3) and (5) were not included, and their exclusion did not affect the estimates or the precision of confi dence intervals.
The study was approved by the Research Ethics Committee of the Instituto de Medicina Social (Protocol No. FR186658, on 04/10/2008).
RESULTS
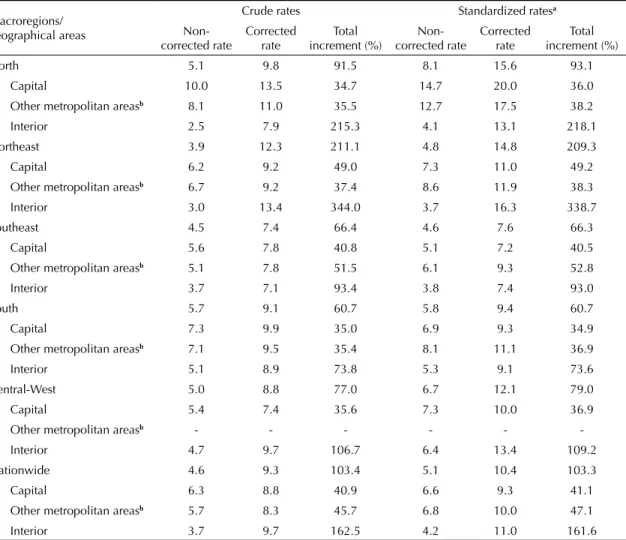
In Brazil, for the period between 1996 and 2005, the average crude and adjusted annual rates of deaths from cervical cancer based on world population were 4.6 and 5.1 deaths per 100,000 women-years, respec-tively. After corrections of deaths, mortality rates from cervical cancer showed an increment of 103.4% in Brazil nationwide, ranging from 35% in capital cities of the South to 339% in interior cities of the Northeast. There were wide variations across regions, within a region, across capital cities, other cities of metropolitan areas, and interior cities (Table 1).
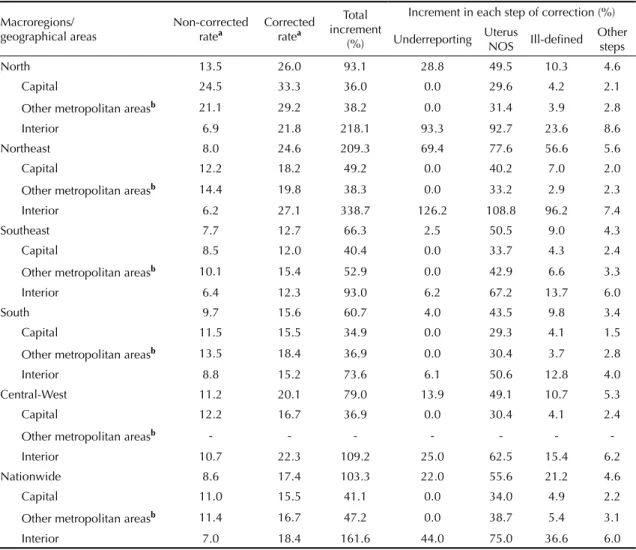
Table 2 shows average annual mortality rates from cervical cancer, total percent variation and percent variation by step of correction. The steps of correction with higher increments in cervical cancer mortality rates were: reallocation of deaths from cancer of the uterus, NOS (55.6%), correction of underreporting (22.0%), and reallocation of deaths with ill-defined causes (21.2%). These three steps of correction accounted for a 98.8% increment in the mortality rate nationwide
d Instituto Brasileiro de Geografi a e Estatística. Comissão Nacional de Classifi cação. Rio de Janeiro;1994 [cited 2009 Dec 30]. Available from: http://www.ibge.gov.br/concla
(17.39 deaths per 100,000 women aged 20–79). Other steps of correction, i.e., reallocation of deaths with unknown macroregion, reallocation of deaths with incomplete diagnosis (missing codes) and reallocation of deaths with unknown gender, accounted for a 4.6% increment in the annual average rate nationwide and for all the study period.
The reallocation of deaths from cancer of the uterus, NOS produced the greatest effect on mortality rates from cervical cancer in all regions and nationwide, even greater than the percent increment seen after the correction of underreporting and reallocation of deaths from ill-defi ned causes. However, the same was not seen in interior cities of the North and Northeast, where the correction of underreporting had a greater effect than reallocation of deaths NOS. These regions also showed the greatest percent increments after the reallocation of deaths with ill-defi ned causes, 57% in the Northeast and 10% in the North.
The corrections of mortality rates form cervical cancer by age group are shown in Table 3. The greatest correc-tion percents were seen in older age groups. The curve of correction of deaths showed an increasing trend with age for Brazil nationwide and all macroregions. The correction of mortality rates ranged from 70% to 80% in the age group 20–49, up to 120% in the age group 70–79.
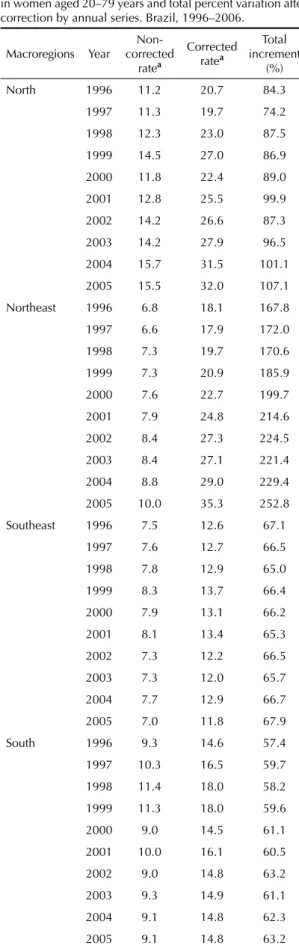
The corrections of mortality rates from cervical cancer by year of death are presented in Table 4. They showed a steady pattern over the time series studied, espe-cially nationwide. This steady pattern is evident after excluding the corrections made for the year 2005, which were higher than those made for previous years, and in all regions. The South and Northeast had the lowest and the highest variation, respectively, compared to the percent increment in annual mortality rates from cervical cancer.
Table 1. Average mortality rates from cervical cancer (per 100,000) in women of all ages and variation after correction by macroregion. Brazil, 1996–2005.
Macroregions/ geographical areas
Crude rates Standardized ratesa
Non-corrected rate Corrected rate increment (%)Total corrected rateNon- Corrected rate increment (%)Total
North 5.1 9.8 91.5 8.1 15.6 93.1
Capital 10.0 13.5 34.7 14.7 20.0 36.0
Other metropolitan areasb 8.1 11.0 35.5 12.7 17.5 38.2
Interior 2.5 7.9 215.3 4.1 13.1 218.1
Northeast 3.9 12.3 211.1 4.8 14.8 209.3
Capital 6.2 9.2 49.0 7.3 11.0 49.2
Other metropolitan areasb 6.7 9.2 37.4 8.6 11.9 38.3
Interior 3.0 13.4 344.0 3.7 16.3 338.7
Southeast 4.5 7.4 66.4 4.6 7.6 66.3
Capital 5.6 7.8 40.8 5.1 7.2 40.5
Other metropolitan areasb 5.1 7.8 51.5 6.1 9.3 52.8
Interior 3.7 7.1 93.4 3.8 7.4 93.0
South 5.7 9.1 60.7 5.8 9.4 60.7
Capital 7.3 9.9 35.0 6.9 9.3 34.9
Other metropolitan areasb 7.1 9.5 35.4 8.1 11.1 36.9
Interior 5.1 8.9 73.8 5.3 9.1 73.6
Central-West 5.0 8.8 77.0 6.7 12.1 79.0
Capital 5.4 7.4 35.6 7.3 10.0 36.9
Other metropolitan areasb - - - - -
-Interior 4.7 9.7 106.7 6.4 13.4 109.2
Nationwide 4.6 9.3 103.4 5.1 10.4 103.3
Capital 6.3 8.8 40.9 6.6 9.3 41.1
Other metropolitan areasb 5.7 8.3 45.7 6.8 10.0 47.1
Interior 3.7 9.7 162.5 4.2 11.0 161.6
a Adjusted based on world population
b Other cities of nine metropolitan areas: Belém, Recife, Fortaleza, Salvador, Belo Horizonte, Rio de Janeiro, São Paulo, Curitiba,
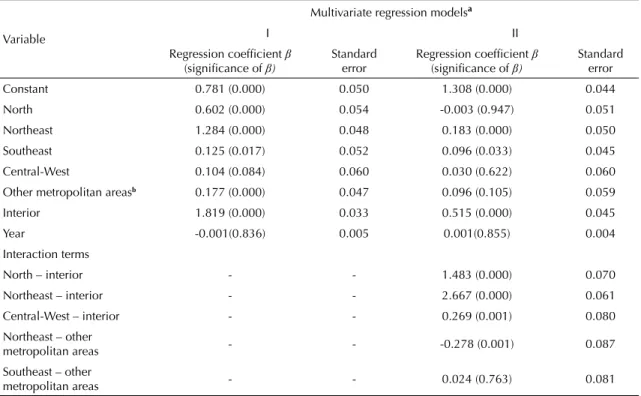
Table 5 presents the results of the multivariate regres-sion analysis. A comparison of the two models (with and without interaction terms) illustrates the effects of the interaction between corrections in the interior and the reference region (South), especially between the North and Northeast. After the inclusion of interac-tion terms in the regression model, most correcinterac-tions for interior cities in these two regions are associated with an increment of the estimated mortality rate from cervical cancer.
DISCUSSION
As expected the corrections of deaths from cervical cancer were more signifi cant in regions with lower socioeconomic status, and within these regions, they
were more pronounced for death rates in interior than capital cities or other cities in metropolitan areas. These results are consistent with the literature since higher death rates from cervical cancer are expected in less developed regions.3,10,18 In addition, more corrections
were expected in these Brazilian regions because they have the lowest reporting rates and the poorest quality of death certifi cates.f The percent variation of rates at
each step of correction also showed a close relationship with prevalent socioeconomic conditions in the regions and their geographical areas (capital, interior and other cities of metropolitan areas).
After correction, the mortality rate from cervical cancer in Brazil had a percent increment above 100%, from 5.1 to 10.4 deaths per 100,000 women-years, adjusted
Table 2. Average mortality rates from cervical cancer (per 100,000) in women aged 20 to 79 years and variation after correction by macroregion. Brazil, 1996–2006.
Macroregions/
geographical areas Non-corrected ratea Corrected ratea
Total increment
(%)
Increment in each step of correction (%)
Underreporting Uterus NOS Ill-defi ned Other steps
North 13.5 26.0 93.1 28.8 49.5 10.3 4.6
Capital 24.5 33.3 36.0 0.0 29.6 4.2 2.1
Other metropolitan areasb 21.1 29.2 38.2 0.0 31.4 3.9 2.8
Interior 6.9 21.8 218.1 93.3 92.7 23.6 8.6
Northeast 8.0 24.6 209.3 69.4 77.6 56.6 5.6
Capital 12.2 18.2 49.2 0.0 40.2 7.0 2.0
Other metropolitan areasb 14.4 19.8 38.3 0.0 33.2 2.9 2.3
Interior 6.2 27.1 338.7 126.2 108.8 96.2 7.4
Southeast 7.7 12.7 66.3 2.5 50.5 9.0 4.3
Capital 8.5 12.0 40.4 0.0 33.7 4.3 2.4
Other metropolitan areasb 10.1 15.4 52.9 0.0 42.9 6.6 3.3
Interior 6.4 12.3 93.0 6.2 67.2 13.7 6.0
South 9.7 15.6 60.7 4.0 43.5 9.8 3.4
Capital 11.5 15.5 34.9 0.0 29.3 4.1 1.5
Other metropolitan areasb 13.5 18.4 36.9 0.0 30.4 3.7 2.8
Interior 8.8 15.2 73.6 6.1 50.6 12.8 4.0
Central-West 11.2 20.1 79.0 13.9 49.1 10.7 5.3
Capital 12.2 16.7 36.9 0.0 30.4 4.1 2.4
Other metropolitan areasb - - - - - -
-Interior 10.7 22.3 109.2 25.0 62.5 15.4 6.2
Nationwide 8.6 17.4 103.3 22.0 55.6 21.2 4.6
Capital 11.0 15.5 41.1 0.0 34.0 4.9 2.2
Other metropolitan areasb 11.4 16.7 47.2 0.0 38.7 5.4 3.1
Interior 7.0 18.4 161.6 44.0 75.0 36.6 6.0
Uterus NOS: not otherwise specifi ed (ICD-10, C55).
a Adjusted based on world population.
b Other cities of nine metropolitan areas: Belém, Recife, Fortaleza, Salvador, Belo Horizonte, Rio de Janeiro, São Paulo, Curitiba,
and Porto Alegre.
based on world population. This result confi rms the estimated risk of death from cervical cancer by the International Agency for Research on Cancer (IARC) in Brazil in 2002, 10.2 deaths per 100,000 women-years.g
Another study in Latin America estimated a mortality rate of 11.6 cervical cancer deaths per 100,000 women-years in Brazil in 2000.3 Other Brazilian studies for
the correction of cervical cancer rates focused only on the reallocation of deaths from cancer of the uterus, NOS in some cities. Antunes & Wünsch (2006) real-located cancer of uterus, NOS and obtained an almost 50% increment of rates in São Paulo, southern Brazil. In another study13 in Recife, northeastern state of
Pernambuco, the authors reviewed death certifi cates against medical records and concluded that half of the cases previously reported in the SIM as cancer of the uterus, NOS were due to cervical cancer, increasing deaths from cervical cancer by 20%.
The results of the present study show the relative weight of deaths from uterine cancer, NOS in increasing corrected rates from cervical cancer: over 50% of total increments in the rates nationwide can be attributable to reallocation of the primary cause of death. It can be thus inferred that the Brazilian health system has low diagnostic capacity and that part of female population does not have access to or does not undergo cervical screening. These women are seen at advanced stages of disease when it is more diffi cult to make an accurate diagnosis. The effectiveness of a population-based screening program depends not only on the perfor-mance of Pap smears, but especially on the capacity of health services to ensure treatment and follow-up of all patients with abnormal results.18 However, our
results show inadequate diagnostic ability in addition to inadequate cervical cancer prevention.
The high proportion of death certifi cates with uterine cancer, NOS as primary cause of death could be explained by the diffi culty in making the diagnosis of cervical cancer at advanced stages of disease.11
However, the quality of data points to a need for training health providers in death certifi cate completion.2,4,14,16,17
It is also possible that health providers do not see the value of appropriate completion of death certifi cates. In a study of deaths from uterine cancer, NOS the authors were able to reclassify most diagnoses by primary site using a simple approach of data recovery and retrieval.13
Therefore it should be further explored the reasons that prevent adequate completion of death certifi cates.
Another example of diagnosis inaccurately completed in death certifi cates is “cardiac arrest,” classifi ed as a well-defi ned diagnosis in several ICD revisions in the chapter of diseases of the circulatory system.h It was
eventually considered an ill-defi ned cause based on studies showing that, in almost all deaths, the primary cause reported by health providers as “cardiac arrest” was not a cardiac condition. Death could be due to
Table 3. Average mortality rates from cervical cancer (per 100,000 women) and variation after correction by age in women aged 20–79 years. Brazil, 1996–2006.
Macroregion groupAge corrected Non-ratea
Corrected ratea
Total increment
(%)
North 20 to 29 1.2 2.2 83.3
30 to 39 6.5 11.4 75.4
40 to 49 15.2 28.0 84.2
50 to 59 22.3 43.0 92.8
60 to 69 27.7 53.5 93.1
70 to 79 32.6 67.4 106.7
Northeast 20 to 29 0.6 1.7 183.3
30 to 39 3.4 9.2 170.6
40 to 49 9.3 26.1 180.6
50 to 59 13.4 40.5 202.2
60 to 69 16.5 53.5 224.2
70 to 79 19.3 64.8 235.8
Southeast 20 to 29 0.5 0.7 40.0
30 to 39 2.8 4.1 46.4
40 to 49 8.0 12.4 55.0
50 to 59 12.8 20.9 63.3
60 to 69 16.5 27.9 69.1
70 to 79 21.3 38.6 81.2
South 20 to 29 1.0 1.4 40.0
30 to 39 4.6 6.9 50.0
40 to 49 11.5 17.2 49.6
50 to 59 16.8 26.1 55.4
60 to 69 19.4 31.8 63.9
70 to 79 21.2 38.3 80.7
Central-West 20 to 29 0.7 1.0 42.9
30 to 39 3.9 6.4 64.1
40 to 49 11.2 18.8 67.9
50 to 59 18.5 32.9 77.8
60 to 69 25.2 44.5 76.6
70 to 79 34.5 66.7 93.3
Nationwide 20 to 29 0.7 1.2 71.4
30 to 39 3.5 6.5 85.7
40 to 49 9.5 17.8 87.4
50 to 59 14.4 28.7 99.3
60 to 69 18.0 37.3 107.2
70 to 79 21.8 48.2 121.1
a Adjusted based on world population.
g International Agency for Research on Cancer. Cancer Mondial. The Globocan 2002 database. Lyon; 2002[cited 2009 Dec 31]. Available from: http://www-dep.iarc.fr/globocan/database.htm
well-defi ned causes, but providers would report only “cardiac arrest” since it is a primary cause easily to be reported, or even because is a well-established cause of death.hIt would be valuable to investigate using a
combined approach of death information retrieval and providers’ survey the reasons that make them report the primary cause of death as cancer of the uterus, NOS where it is possible to classify these diagnoses.
With respect to corrections of mortality rates from cervical cancer by age group, there were increasing corrections with age, which is consistent with the Brazilian1,13 and international literature.2 In contrast,
corrections by year of death showed a steady pattern over the time series analyzed, while a declining pattern would be expected due to improvements in reporting of deaths and quality of completion of death certifi cates in the SIM.f This fi nding should be interpreted with
caution given the intrinsic limitations of correction of underreporting based on expansion factors generated by the Global Burden of Disease Study in Brazil for the year 1998. Improvements in the reporting of deaths may have been masked in this study. However, there are still defi ciencies in the SIM that need to be addressed so that information from all Brazilian regions can be available with similar rates of reporting and data quality.
Table 4 continuation
Macroregions Year
Non-corrected
ratea
Corrected ratea
Total increment
(%)
Central-West 1996 10.5 18.5 77.1
1997 11.9 21.0 77.1
1998 11.4 20.2 77.5
1999 14.3 26.2 83.3
2000 10.3 18.5 80.5
2001 10.3 18.4 78.1
2002 9.8 17.7 81.4
2003 11.8 20.6 75.2
2004 11.6 20.5 77.1
2005 10.9 19.7 80.4
Nationwide 1996 7.9 15.0 90.0
1997 8.2 15.5 89.2
1998 8.7 16.4 89.5
1999 9.1 17.7 93.6
2000 8.3 16.6 99.6
2001 8.7 17.7 103.0
2002 8.4 17.6 110.0
2003 8.5 17.7 108.5
2004 8.8 18.7 112.0
2005 8.8 19.9 126.2
a Adjusted based on world population.
Table 4. Mortality rates from cervical cancer (per 100,000) in women aged 20–79 years and total percent variation after correction by annual series. Brazil, 1996–2006.
Macroregions Year corrected Non-ratea
Corrected ratea
Total increment
(%)
North 1996 11.2 20.7 84.3
1997 11.3 19.7 74.2
1998 12.3 23.0 87.5
1999 14.5 27.0 86.9
2000 11.8 22.4 89.0
2001 12.8 25.5 99.9
2002 14.2 26.6 87.3
2003 14.2 27.9 96.5
2004 15.7 31.5 101.1
2005 15.5 32.0 107.1
Northeast 1996 6.8 18.1 167.8
1997 6.6 17.9 172.0
1998 7.3 19.7 170.6
1999 7.3 20.9 185.9
2000 7.6 22.7 199.7
2001 7.9 24.8 214.6
2002 8.4 27.3 224.5
2003 8.4 27.1 221.4
2004 8.8 29.0 229.4
2005 10.0 35.3 252.8
Southeast 1996 7.5 12.6 67.1
1997 7.6 12.7 66.5
1998 7.8 12.9 65.0
1999 8.3 13.7 66.4
2000 7.9 13.1 66.2
2001 8.1 13.4 65.3
2002 7.3 12.2 66.5
2003 7.3 12.0 65.7
2004 7.7 12.9 66.7
2005 7.0 11.8 67.9
South 1996 9.3 14.6 57.4
1997 10.3 16.5 59.7
1998 11.4 18.0 58.2
1999 11.3 18.0 59.6
2000 9.0 14.5 61.1
2001 10.0 16.1 60.5
2002 9.0 14.8 63.2
2003 9.3 14.9 61.1
2004 9.1 14.8 62.3
2005 9.1 14.8 63.2
Regarding the correction of underreporting, although there were corrected only deaths occurring in interior cities of each macroregion, assuming that reporting of deaths was close to 100% in capital cities and other cities in metropolitan areas, we are aware that major cities were included as “interior” ones. For instance, the cities of Uberaba, Uberlandia and Juiz de Fora in the southeastern state of Minas Gerais show adequate reportingi and could have been excluded from the
corrections of underreporting. However, the interior of each macroregion was corrected in a single block. Thus, the use of a more accurate method of correc-tion of underreporting5 could improve the results of
this study, providing a more realistic overview of the profi le of mortality from cervical cancer in Brazil by macroregions and their geographic areas.
Another limitation of the present study is regarding the approach for correction of deaths from ill-defi ned causes, which followed the proportional reallocation of deaths from well-defi ned causes by age groups.17
This approach can be inadequate, especially when it is intended to reallocate cancer deaths since they are usually adequately reported.12 But, since there is no
consensus in the literature on this subject, we believe that by using 50% of the weight of neoplasms for realloca-tion of deaths from ill-defi ned causes we have prevented overestimation of cervical cancer mortality.
Despite its limitations, consistent corrections in terms of geographical areas and their agreement with data from literature3,10,18 confi rm that the method of correction
used in this study provided a more realistic estimate of mortality rates from cervical cancer in Brazil.
Corrections of specifi c death estimates are signifi -cant especially for cervical cancer which is the most common cancer among low-income women. The direct use of data without taking into consideration quality and other characteristics of mortality information systems can lead to underestimations of actual mortality rates. Corrected estimates should be used to identify Brazilian regions requiring priority actions for prevention and control of cervical cancer.
In conclusion, given the magnitude of corrected mortality rates from cervical cancer in Brazil (10.4 deaths per 100,000 women-years in the period 1996–2005 among women of all ages), it is evident that cervical cancer
i Instituto Brasileiro de Geografi a e Estatística. Geociência: Perfi l dos Municípios Brasileiros. Rio de Janeiro; 2009 [cited 2009 Dec 30]. Available from: http://www.ibge.gov.br/
Table 5. Results of multivariate linear regression models of corrected mortality rates from cervical cancer in women aged 20–79 years by geographical areas. Brazil, 1996–2005.
Variable
Multivariate regression modelsa
I II
Regression coeffi cient β
(signifi cance of β)
Standard
error Regression coeffi cient (signifi cance of β) β
Standard error
Constant 0.781 (0.000) 0.050 1.308 (0.000) 0.044
North 0.602 (0.000) 0.054 -0.003 (0.947) 0.051
Northeast 1.284 (0.000) 0.048 0.183 (0.000) 0.050
Southeast 0.125 (0.017) 0.052 0.096 (0.033) 0.045
Central-West 0.104 (0.084) 0.060 0.030 (0.622) 0.060
Other metropolitan areasb 0.177 (0.000) 0.047 0.096 (0.105) 0.059
Interior 1.819 (0.000) 0.033 0.515 (0.000) 0.045
Year -0.001(0.836) 0.005 0.001(0.855) 0.004
Interaction terms
North – interior - - 1.483 (0.000) 0.070
Northeast – interior - - 2.667 (0.000) 0.061
Central-West – interior - - 0.269 (0.001) 0.080
Northeast – other
metropolitan areas - - -0.278 (0.001) 0.087
Southeast – other
metropolitan areas - - 0.024 (0.763) 0.081
a Adjusted by age and other variables of the table, Model I (R2 = 0.566) and II (R2 = 0.747) with and without interaction terms,
respectively.
b Other cities of nine metropolitan areas: Belém, Recife, Fortaleza, Salvador, Belo Horizonte, Rio de Janeiro, São Paulo, Curitiba,
mortality is actually higher than that offi cially reported. The correction of mortality rates is an essential strategy for planning actions for disease control. Other studies
including validation and reliability testing of methods of correction of data on the primary cause of death are needed for consistently improving the SIM.
1. Antunes JL, Wünsch-Filho V. The effect of performing corrections on reported uterine cancer mortality data in the city of São Paulo. Braz J Med Biol Res. 2006;39(8):1091-9. DOI:10.1590/S0100-879X2006000800012
2. Arbyn M, Geys H. Trend of cervical cancer mortality in Belgium (1954-1994): tentative solution for the certifi cation problem of unspecifi ed uterine cancer. Int
J Cancer. 2002;102(6):649-54. DOI:10.1002/ijc.10761
3. Arrossi S, Sankaranarayanan R, Parkin DM. Incidence and mortality of cervical cancer in Latin America.
Salud Publica Mex. 2003;45(Suppl 3):306-14.
DOI:10.1590/S0036-36342003000900004 4. Bailar JC 3rd, Eisenberg H. Uterine tumors of
unspecifi ed origin. Cancer. 1965;18:589-91. 5. Cavalini LT, Ponce de Leon AC. Correção de
sub-registros de óbitos e proporção de internações por causas mal defi nidas. Rev Saude Publica. 2007;41(1):85-93. DOI:10.1590/S0034-89102007000100012
6. Coale AJ, Trussell J. Annex I: estimating the time to which Brass estimates apply. Popul Bull UN. 1977;10:87-9.
7. Derossi SA, Paim JS, Aquino E, Silva LMV. Evolução da mortalidade e anos potenciais de vida perdidos por câncer cérvico-uterino em Salvador (BA), 1979-1997.
Rev Bras Cancerol. 2001;47(2):163-70.
8. Doll R, Payne P, Waterhouse J, editors. Cancer incidence in fi ve continents: a technical report. Berlin: Springer-Verlag; 1966.
9. Hallal ALC, Gotlieb SLD, Latorre MRDO. Evolução da mortalidade por neoplasias malignas no Rio Grande do Sul, 1979-1995. Rev Bras Epidemiol. 2001;4(3):168-77. DOI:10.1590/S1415-790X2001000300004 10. Stat bite: worldwide cervical and uterine cancer
incidence and mortality, 2002. J Natl Cancer Inst. 2006;98:1031.
11. Loos AH, Bray F, McCarron P, Weiderpass E, Hakama M, Parkin DM. Sheep and goats: separating cervix and corpus uteri from imprecisely coded uterine cancer deaths, for studies of geographical and temporal variations in mortality. Eur J Cancer. 2004;40(18):2794-803. DOI:10.1016/j.ejca.2004.09.007
12. Mello Jorge MH, Gotlieb SLD, Laurenti R. O sistema de informações sobre mortalidade: problemas e propostas para o seu enfrentamento I-mortes por causas naturais.
Rev Bras Epidemiol. 2002;5(2):197-211. DOI:10.1590/
S1415-790X2002000200007
13. Mendonça VJ, Guimarães MJB, Lorenzato FRB, Mendonça JG, Menezes TC. Mortalidade por câncer do colo do útero: características sociodemográfcas das mulheres residentes na cidade do Recife, Pernambuco.
Rev Bras Ginecol Obstet. 2008;30(5):248-55.
DOI:10.1590/S0100-72032008000500007 14. Percy CL, Horm JW, Young Jr JL, Asire AJ. Uterine
cancers of unspecifi ed origin-a reassessment. Public
Health Rep. 1983;98(2):176-80.
15. Preston S, Coale AJ, Trussell J, Wenstein M. Estimating the completeness of reporting of adult deaths in populations that are aproximately stable. Popul Index. 1980;46(2):179-202. DOI:10.2307/2736122 16. Schoenberg BS, Bailar 3rd JC. Uterine malignancies
of unspecifi ed origin. Arch Environ Health. 1971;23(1):77-81.
17. Silvi J. On the Estimation of Mortality Rates For Countries of the Americas. Epidemiol Bull. 2003;24(4):1-5.
18. Thuler LCS. Mortalidade por câncer do colo do útero no Brasil. Rev Bras Ginecol Obstet. 2008;30(5):216-8. DOI:10.1590/S0100-72032008000500002
19. Wünsch-Filho V, Moncau JE. Cancer mortality in Brazil 1980-1995: regional patterns and time trends. Rev
Assoc Med Bras. 2002;48(3):250-7. DOI:10.1590/
S0104-42302002000300040
REFERENCES
Article based on Gamarra CJ’s doctoral thesis submitted to the Instituto de Medicina Social, Universidade do Estado do Rio de Janeiro, in 2009.
Gamarra CJ was supported by the Brazilian Federal Agency for Support and Evaluation of Graduate Education (CAPES) doctoral grant.