November 2012
Cape Verde’s foreign policy: an economic perspective
Jorge Braga de Macedo1
Abstract: The virtuous cycle between development success and foreign policy in Cape Verde reflects a positive interaction between globalization and governance. Development success under globalization entails positive market perceptions regarding the orientation and predictability of policies as well as the accompanying institutional arrangements, thereby making foreign policy salient beyond the comparator group, or “aspirational”. Even if there is no universally applicable development model, an aspirational foreign policy can be built on positive rankings with respect to comparator groups. In Macedo and Pereira (2010), macro-level policy and institutional combinations underpinning trade diversification and income convergence in West and Southern Africa are used to establish development success for Cape Verde and Mozambique respectively. Here, the narrative of long-term development helps identify the following drivers: moving towards a market economy; opening up to regional and global trade; increasing economic and political freedom; pursuing macroeconomic stability and financial reputation; ensuring policy continuity (especially in trade and industrial sectors) and focusing on human development (especially poverty reduction and education). Looking at GDP per capita and indicators of financial reputation and good governance of sub-regional peers is not sufficient to conclude that Cape Verde’s convergence will be sustained. Nevertheless, the positive interaction between trade and financial globalization, on the one hand, and democracy and good governance, on the other, have positive implications for the effectiveness of foreign policy across the region as well as in the Portuguese-speaking community.
1
1. Introduction
The global financial crisis turned the risk of excluding Africa economies from globalization into the certainty that poverty would worsen in most of them. Prior to this crisis, however, Africa accompanied the trend of sustained growth evidenced by emerging economies. Primarily due to the implementation of adequate structural and macroeconomic policies, growth was the strongest in decades (AEO, various issues). In Sub-Saharan Africa, GDP growth increased from an average of 3.5 % in 2000 to 5.7 % by 2005 and Burkina Faso, Ethiopia, Mali, Mozambique, Tanzania, and Uganda, none of which is a major primary commodity producer, were able to post annual growth rates of over 5 % in recent years.
Indeed, the expansion, diversification and deepening of trade and financial links between countries over several decades presented an unparalleled opportunity to raise living standards and achieve the Millennium Development Goals (MDG). Notwithstanding Africa’s improved economic situation, absolute poverty was still widespread when unprecedented energy and food price volatility brought worldwide expansion to a halt. Amidst dire global economic prospects, growth enhancing policies need to be assessed against progress on MDG, including the global partnership for development and international cooperation prospects. The economic perspective taken in this paper requires a rather lengthy but essential background before to show how Cape Verde fits into the wider picture drawn.
and rational incentive frameworks and robust financial systems coupled with effective supervisory and regulatory mechanisms.
Severe regulatory failures in developed countries, uncovered by the global crisis, confirmed that there is no universally applicable development model. Adequate governance responses to globalization thus become all the more important as globalization reduces national policy space and increases institutional and economic interdependence at various levels. At the same time, a more integrated global economic context necessarily demands greater policy and institutional coherence as well the knowledge required to implement the associated reforms and monitor them through effective peer review mechanisms.
To be sure, the highly integrated economies of the Eurozone have been incapable of managing payments imbalances between debtors and creditors, the rise in public debt and financial stability for more than two years. With the entry into force of the Lisbon treaty, the diverse perspectives of the 27 EU member states found at last an institutional framework but neither coherence nor knowledge have been sufficient to respond to the challenge posed by the global crisis.
a single currency and the widening membership through successive enlargements continue to reflect an enduring process of international governance innovation.
for the African Union, or the local offices of global organizations such as the United Nations, the International Monetary Fund and the World Bank, better interaction between globalization and governance would probably follow. With peer pressure, better information on the ECOWAS partners and beyond would probably be available, facilitating business development and a more active role for civil society.
The idea of producing usable information from within a cooperative framework is what we mean by “mutual knowledge”, a term used in a declaration on MDG approved at the 2006 summit of the Community of Portuguese-speaking Countries (CPLP) held in Bissau. Aside from five African countries (Angola, Cape Verde, Guinea-Bissau, Mozambique, São Tomé e Príncipe collectively known as PALOP), Brazil and Portugal are founding members, Timor Leste joined in 2001 while Equatorial Guinea, Mauritius and Senegal are associate members. Mutual knowledge is generally more limited and the data harder to compare outside of the OECD so that cooperation at the regional, sub-regional and international levels may neither produce knowledge of effective policies or institutions nor create conditions for their implementation. In fact, context-adjusted but also widely usable knowledge only results from identifying an appropriate constituency for each set of related problems and challenges. Reaching the MDG in 2015, for example, presupposed sustained pro-poor economic growth in addition to better governance and more aid, but there were no immediately available recipes on how to bring about a positive interaction between globalization and governance.
markets, these countries faced recurrent financial crises which interrupted the long term convergence process. Alternatives to both the “one size fit all” and “each case is unique” development ideologies are needed in a context which cannot draw upon existing experiences of institutional cooperation that foster mutual trust and generate mutual knowledge. Under these circumstances, the quest for African development successes remains a policy as well as a research priority, especially acute in Sub-Saharan Africa. In a nutshell, what is at stake for many African countries is how to ensure that current policy and institutional arrangements in the spheres of trade, finance, debt, investment and technology mutually reinforce each other in support of equitable, rapid and sustainable growth and development.
Against this background, the extent to which Cape Verde may represent a development success is assessed in terms of benchmarks in ECOWAS and beyond. Specifically, we seek to identify lessons for successful governance – especially in the form of aspirational foreign policy – are drawn from Cape Verde's development experience, including the complementarity of economic policies and institutional arrangements bearing on trade, finance and competitiveness.
of long-term development with respect to foreign trade, economic growth, macroeconomic policy and financial reputation on which Cape Verde’s foreign policy is based. Once again, policy and institutional reforms provide context for good governance indicators and progress towards the MDG in a separate sub-section. The concluding section 6 raises the issue of how cooperative governance and peer-review mechanisms can be reflected in an aspirational foreign policy.
2. Interpreting how Globalization and Governance interact with Convergence
existence of a free press, open public discussion and freedom of speech and assembly. Since political rights and civil liberties are highly correlated, we replace them with the average of both. This composite indicator performed better in estimation and, in addition, it also has the advantage of being interpretable as an index of political freedom, given that it captures its two mains constituent components. We also note that these measures must be used and interpreted with caution due to well known issues, most of which derive from the process of index construction itself, as pointed out by Oman and Arndt (2006).
of economic freedom is more difficult to define as it may relate only to private ownership, prices being determined by market forces, de jure and de facto entry and exit, efficient rule of law and official economic regulation guaranteeing competition or also include the financial freedom brought about by currency convertibility, stability of money value, central bank independence and deep financial markets. Furthermore, the widely used indexes include low taxes, a small share of government spending in GDP and flexible labor markets, and this appears to some as too extensive a definition of economic freedom.
allowing for the quality of democracy lowers the overall effect of globalization on democracy. One reason for this is the hypothesis that globalization’s effects on democracy are mediated by slow-moving cultural values. This would imply that such variables might be accounted for by selecting groups of like-minded countries, like the OECD, for which the effect of globalization on freedoms would be stronger but this would neglect the convergence dimension, more visible on a global scale. Eichengreen and Leblang’s (2006) also use a measure, “Age of Democracy”, which counts for each country i at time t the number of uninterrupted year up to time t that country i has been democratic, i.e. its measures the length of time a country has been a democracy which is used in section 4 below. In addition, we employ data from the POLITY project, which codes countries’ level of democracy as a function of institutional rules. POLITY is also the source of information on constitutional age. POLITY defines constitutional change as occurring either when there is a political transition or when the absolute value of the score changes by at least three points. This allows for constitutional changes in both democracies and dictatorships.
services and assets. Similarly, a country with good governance, namely a democratic state with high-quality institutions, effective corruption-free accountable bureaucracies, and a flourishing civil society may likely increase the quality, if not the quantity, of its most important endowment: its own people. Once more, cause and effect can be swapped: well-endowed countries may evolve towards democratic forms of government more easily, or, at least, they may afford investing more resources to build well-functioning institutions.
case of political diversity and whether peace or conflict ensues. This is taken up in the next section, with specific reference to the historical roots of CPLP in the first wave of globalization, associated with the Iberian maritime explorations of the 15th century.
The available empirical evidence regarding the relationship between economic growth and political regime is weak or inconclusive, as discussed in Kohli (1986), Remmer (1990) and Przeworski and Limongi (1993). In the case of Africa, it is not possible to establish a clear link between political regime and economic growth according to Young (1998), amongst others. However, the poor economic performance of many of its authoritarian regimes during the 1980s suggests that these failed to promote economic growth. Indeed, Maravall (1995) notes that “a strong case can be made that economic reforms are more likely to succeed in a democratic political context. Political pluralism generates more and better information to use in economic decision making; moreover, democratic institutions may reduce the transaction costs of economic reforms, as well as restrict predation of public resources.” Looking at the Economic Freedom Index in Sub-Saharan Africa, we see that it is not only the poorest but also
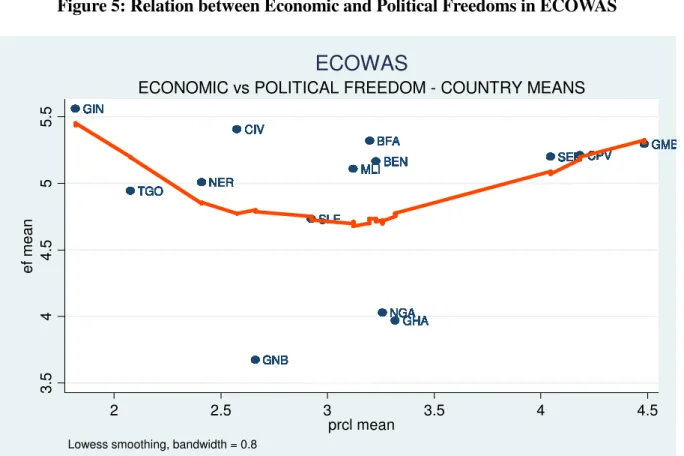
the most economically repressed world region: no country belong in the group of economically free countries, 7 are listed in the “mostly free group”, 28 in the “mostly not-free” and 7 in the “repressed” group. More worrisomely, in the region, a decline in economic freedom is evident. Factors like corruption, excessive market regulation or the size of black market are among the reasons for such a poor result. Results on G&G in the form of the diversification-convergence interaction suggest that economic convergence increases with political and economic freedom. Indeed, the focus on the management of diversity as a determinant of positive interaction between globalization and governance is especially necessary in connection with Africa, because the knowledge thereabout is certainly less “mutual” than with respect to other regions, even outside of the OECD.
3.1. World Regions
Three “regions” (North America, EU, ASEAN + China, Korea, Japan) account for ¼ each of world GDP. Africa is in the “rest of the world” which includes over ½ of world population, with other significant actors (Brazil, Russia, India) and salient regions (Middle East). Taking a global view should foster governance innovation, as dominant players have different strengths (Nye, 2002). Yet free rider problems prevent cooperation among abstract regions, especially those where there are no peer review mechanisms let alone a culture of cross-cutting intergovernmental cooperation, as seemed to be the case in the rest of the world significant actors and even in China, certainly before the creation of the Group of 20 (Macedo, 2011). In addition, around 70 “fragile states”, most of which located in Africa, are very specific in their fragility (Bourguignon et al 2008).
Looking at the rest of the world, the share of world GDP accounted for by Africa plus South America combined doubled from 1820 to 1950. The share remained constant since at around 10% with North America and EU roughly equal to Asia (including Japan, Russia and Turkey), shares that are comparable to those prevailing in 1820. In 1950, however, North America and EU accounted for 60% and Asia for 30%. In terms of population Africa and South America combined have more than doubled their combined world share from 10% in 1820 to 15% in 1950 to 22% in 2003 while Asia has dropped from ¾ to ½ and then rose again to 2/3. In terms of GDP per capita, the relative shares are ½ for Africa and South America combined and over 2/3 for Asia.
its tenth anniversary produced the Dakar declaration on the development of statistics One year before, the Lisbon declaration on science for global development included the promotion of science and technology indicators for CPLP (Giovaninni et al., 2008; Macedo, 2008). Indeed, the data drawn from the impressive database of the late Angus Maddison underscores this lack of knowledge. In year 1 there are only estimates of GDP for the five North African countries (Algeria, Egypt, Libya, Morocco and Tunisia), estimates of GDP for Ghana and South Africa begin in 1820 and for the remaining Sub-Saharan Africa countries in 1950. The share of Africa in world GDP falls from over 4% to under 3% in 1000, 1% in 1500 and around .8% until 1820, when it begins to rise to about 1.2% in 1913. In 1950, when estimates for 34 new countries become available, the Africa share reaches under 4% again while Sub-Saharan Africa remains just under 3%. Since then both shares have declined about 1pp of world GDP. As for the share of SSA in Africa, it rose from around 20% until 34% in 1913 and more than doubled to ¾ in 1950. Thereafter the Sub-Saharan share of Africa GDP declined by more than 10 percentage points but the share of ECOWAS in Sub-Saharan Africa remained at 40%. The increase in population has been such that the relative stability in the share of world GDP implies a decline in GDP per capita of about 20 percentage points, from 42% of world GDP per capita in 1950 to 24% in 2003. The corresponding figure for Sub-Saharan Africa is 18%, forecast by IMF to rise to 21% in 2013.
Portuguese empire. Macedo and Pereira (2007) were inspired to study the diversity of Portugal’s and Portuguese speaking countries’ responses to globalization by drawing on the concept of “differenciality” due to Borges de Macedo and discussed in Macedo et al. (2009a). Regions may be historical rather than geographical and interaction during the first wave of globalization and even the second did not involve nearly as many players as the current one. The complementarity between globalization and regional integration and the development paradigm based on mutual accountability first contained in the 2002 Monterrey declaration on MDG both suggest that in Africa interaction between globalization and governance has been
weak. Nevertheless, Macedo et al. (2012) present evidence to the effect that complementary reforms accelerate growth in developing countries.
3.2. The common historical legacy
The combination of Africa and South America is more obvious when the Atlantic side is considered. In effect, during the first wave of globalization Mozambique was ruled from Goa, India and the influence remained after the forced union with the Spanish Crown (1580-1640) even though India suffered the competition from Brazil during the 1700s. Contrary to what is sometimes believed, there was a fair amount of decentralization in the Portuguese empire and financial reputation was preserved: Reinhart and Rogoff (2009, Tables 6.1-2-4-6, pp. 86-99) record one bankruptcy in Portugal from 1300 until 1812, against 7 bankruptcies in Spain and 9 in France. With the departure of the Crown Regent to Brazil in the wake of the first Napoleonic invasion in 1807 essentially moved the capital to the New World (Maxwell, 2004). The Crown remained in Rio de Janeiro after the congress of Vienna and the liberal revolution of the 1820s. Brazil remained an empire until 1890 and was therefore the sole monarchy in the Americas during most of the 19th century2. On the other side, the dispute between the two sons
2 AMG reminded me of other exceptions such as Mexico, with Emperor Maximilian, and Canada, which to this
of the Regent, Pedro and Miguel, led to unrest and civil war in Portugal from the declaration of Brazil’s independence until the defeat of the absolutist brother in 1834. In spite of a successful stabilization in the 1850s when it joined the gold standard, Portugal suffered from the 1890 crisis and the currency became inconvertible. In fact, full convertibility was not restored until 1992!
The transition of Brazil from Empire to Republic coincided with the financial crisis and the first default quickly followed the one of Portugal. During the period until 1890 six defaults were recorded in Portugal against seven in Spain and zero in France and Brazil (Reinhart and Rogoff, 2009, Table 10.2, p. 149 also report the share of years in default since independence or 1800, which is similar in Brazil and Spain while France stands out for the share in a banking crisis).
Similarly, successive Portuguese revolutions in 1910, 1918, 1926 and 1974 influenced the independence of the former African colonies, together with their own very diverse initial experiences with political and economic freedom. For example, the presumption that political freedom is incompatible with financial instead of complementary damages financial reputation considerably because when political rights decrease the capacity to tax, countries become serial defaulters, but they are capable of graduating, given sufficient time, according to Reinhart and Rogoff (2009). Thus, the experience of Portugal with IMF adjustment programs in the 1970s and the 1980s and the regime change towards nominal stability in the 1990s may also be relevant to understand how foreign policy can help acquire or recover financial reputation (Bliss and Macedo, 1990 and Macedo, 2009).
This paper follows previous attempts to contribute towards greater mutual knowledge within the CPLP with respect to the MDG (IICT, 2007; Macedo, 2008). Indeed, the Declaration on
MDG in CPLP (approved at the 2006 Bissau summit mentioned in the introduction) sees cooperative governance as capable of producing “mutual knowledge” among the eight member states based on the fact that the standards of appropriateness regarding policy and institutional reform may be less responsive to geography than to historical affinities. In spite of their geographical discontinuity, five Portuguese-speaking African countries formed the PALOP group in 1979, and held ten summits until 1992, when they signed the first Regional Indicative Program with the EU. With Timor-Leste joining in 2001, there are now six ACP Portuguese-speaking countries cooperating under the 10th European Development Fund. They signed a Memorandum of Understanding with the European Commission on the eve of the second Europe-Africa summit in late 2007, which extended to CPLP. Future activities, integrated into a multi-country approach, focus on democratic governance as a key determinant for poverty reduction.
3.2. A common historical legacy
Within CPLP, on the other hand, the weight of Brazil is such that the number equivalent is 1.4 members, the other seven being same as the other two in NAFTA!
Common features in the five PALOP may reflect institutions preceding independence, in spite of very diverse experiences with political and economic freedom since then. As mentioned, financial reputation suffers when political rights decrease the capacity to tax and there is no constituency to control spending. Like Portugal since 1979, some PALOP have been able to improve their credit rating through appropriate policies. The comparative evolution of GDP per capita in 1990 international dollars from 1950 until 2006 for PALOP and Sub-Saharan Africa averages shows a more volatile growth pattern for the former group with more pronounced growth in the 1950s and the last decade. This reflects civil wars following independence especially in Angola and Mozambique, the two larger economies.
3. 3. Top rankings for Cape Verde
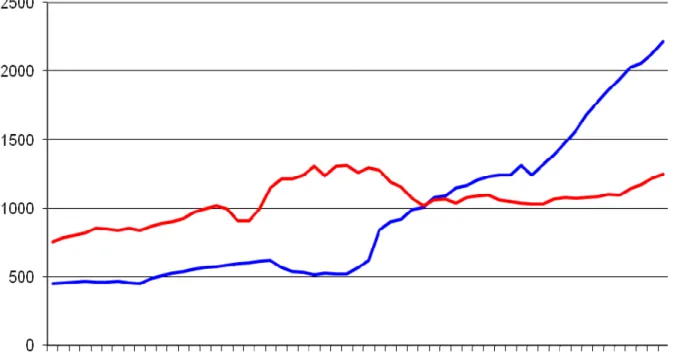
In spite of the common colonial history, the pattern of each one of the five PALOP is very specific: Figure 1 compares GDP per capita in Cape Verde to the ECOWAS average over six decades. The source is the Maddison database which contains two outliers for GDP of Cape Verde in million Geary-Khemis international dollars. The series is 1990: 430; 1991: 283; 1992: 231; 1993: 434 and the correction was interpolating the two outliers, so that GDP per capita growth is smoothed during those years. Unless otherwise noted, Tables and Figures are reproduced from Macedo and Pereira (2010).
Cape Verde and Mauritius are somehow “less African”. Be that as it may: comparing GDP growth rates since 1950 shows a growth differential of almost 2% for Cape Verde relative to ECOWAS, in spite of a negative differential of 4 pp in the 1970s.
After achieving independence in 1975, Cape Verde was governed under a one-party system that pursued an inward-looking, activist development program based on central planning and an economically dominant public sector, particularly in banking, transportation, insurance and energy. Motivated by the need to overcome the colonial legacy while minimizing the risk of possible political resistance, the new government adopted a protectionist trade regime and controlled the economy directly. As consequence, there was limited scope for competitive export promotion and foreign direct investment was also discouraged: the resulting loss of competitiveness and the reduction of foreign direct investment became major constraints for sustainable long-run growth (Lourenço and Foy, 2003). As of 1988, a wide-ranging program of reforms aimed at trade liberalization and privatization reduced the government’s role to essentially that of building badly needed infrastructure but the country was governed under a one-party system until 1990. Popular dissatisfaction, which made itself felt via members of the elites rather than as wider social movements, led to free legislative and presidential elections and a constitutional amendment establishing a multi-party system in 19913. Economic reforms gathered further pace after the country held free elections. The Movement for Democracy (MpD) took power away from the African Party for the Independence of Cape Verde (PAICV) that had led Cape Verde since independence and amended the 1980 constitution to allow for a multiparty democracy. The MpD government continued the economic reforms started by its predecessor, especially those pertaining to financial and foreign exchange markets. Since the
3 AMG reminded me of a comment he made during the debate on the Cape Verde Constitution of 1992: “One
adoption of this regime, legislative elections have produced results considered to be non-fraudulent and changes in government have been orderly.
Indeed, the fact that democratic governance has taken root is widely recognized by various governance indicators. The 2008 Ibrahim Index of African Governance ranks Cape Verde second overall in a sample comprising 48 Sub-Saharan countries. Cape Verde has good results in terms of safety and security, sustainable economic opportunity, participation and human rights and human development, with safety and security obtaining the highest score and sustainable economic opportunity the lowest. Data from the Freedom House Index also confirms the good results of Cape Verde in terms of political stability: Cape Verde is defined as free, obtaining the highest scores (1) for political rights and civil liberties. The presence of “creolisation / métissage” from the first settlers helped promote the view of peace and development. This “peace culture” has been reinforced by the absence of civil strife and by the impressive performance in terms of MDG, reflecting political stability, security, good governance and functioning democratic institutions. This insular nation has become an example of best practice: its neutrality in the region lead to its role of mediator – good reputation (“donors’ darling”), leadership in UN reform and using culture as a means of promoting tourism and development.
remained major constraints on sustainable long-run growth (Lourenço and Foy, 2003).
4. Analyzing the Convergence-Diversification Relationship
The two-way relationship between trade diversification and income convergence was motivated by the interpretative framework and by the empirical finding that economic development, measured by per capita income, entails more diversification. The general observation is that economies become more diversified as incomes increase before reaching a turning point beyond which they become less diversified - a stage not yet observed in Sub-Saharan Africa (Cabral and Veiga, 2010 use data disaggregated at five different levels, noting that the results remain broadly similar independently of the level of aggregation used). In other words, development occurs when a country learns how to do new things and focus on those that it already does well, such as producing new goods, choosing promising export markets, upgrading product quality and moving into services exports. We note, in passing, that another strand of literature argues that diversification should focus on exporting more sophisticated products as these entail higher productivity levels conducive to higher growth levels (e.g. Hausmann et al, 2007). In this case, a country becomes what it exports, i.e. countries converge to the level of income implied by their exports. The common point in both approaches, however, is that product development is undoubtedly an important engine of growth for developing countries.
governance variables presented significant positive signs. The results were particularly robust for the variables reflecting government accountability, respect for the rule of law, political stability, effectiveness, and control of corruption (listed in Table 1). In export sophistication regressions, 15 out of 26 variables are not statistically significant but “transparency”, “accountability” and “control of corruption in the public sector”, “debt policy and fiscal policy rating”, “economic management cluster average” and “policies for social inclusion” have a positive association. It is seen that improving the education standards of the labor force (measured by the share of GDP spent in education or the World Bank index about “building human resources”) is associated with export diversification. Moreover, lower levels of education are associated positively with diversification while higher levels are associated with export sophistication. While equations in which diversification and sophistication were used to explain GDP growth suggested a positive but not robust relationship, higher diversification and sophistication were associated to lower variation in the rate of growth of both GDP and per capita income. The estimated coefficients suggest that a 10% per cent increase in diversification leads to a 4,6% decrease in the variation of GDP growth and to a 4,4% reduction of income per capita variability. Similar results were obtained for sophistication, with country fixed effects model suggesting that increasing sophistication may have a stronger marginal effect in decreasing economic instability than diversification in Sub-Saharan Africa. In addition, higher diversification and sophistication are associated with lower infant mortality and the higher life expectancy. The estimated coefficients are robust and the impact independent of that of diversification and sophistication on income per capita, which is all the more relevant as higher average income does not necessarily translate in better life for the majority of the population.
establishes context-based objective metrics to assess the relative performance of Cape Verde with evidence bearing on foreign policy.
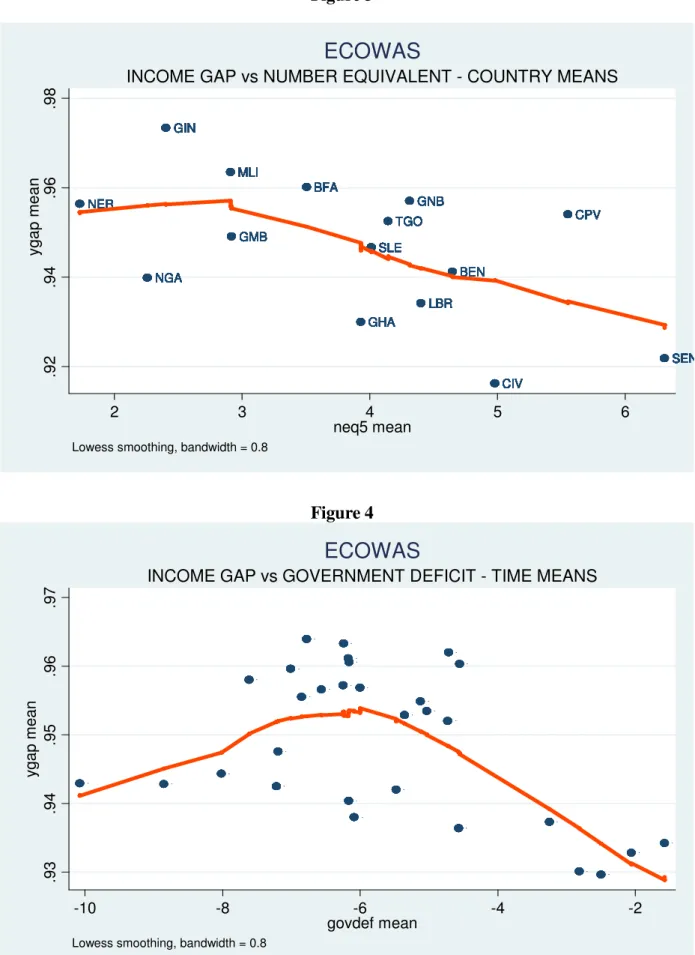
Figure 2 shows the comparative pattern of the number-equivalent Herfindahl index and distance to the frontier. With respect to diversification, Cape Verde is close to 6000 while ECOWAS is around 5000, even though in the early nineties it decreases to 3000 and 2000 respectively. The average annual change in the number equivalent for 5 year periods in Cape Verde and ECOWAS shows that, from 1976 to 2005, a new good was being exported by Cape Verde approximately every five and a half years (1/0.18=5.55).
relatively and highly significant (-0.646 at 1% level). Under the LOW-regime, the relation is only 1-way as more convergence always increases diversification but not the other way round. For the region as whole, diversification increases with more convergence but more diversification actually leads to less convergence. This result is unexpected but plausible given the ambiguous relationship between these two variables, as depicted in Figure 4, and non-linearities that characterize many of the partial relations between variables. The impact of convergence on diversification is also weaker when compared to the HIGH-regime as the estimated coefficient is about half as large (-0.398 vs. -0.751). Together, these results appear to indicate that a critical level of diversification is needed before one observes a two-way relationship, ceteris paribus.
In order to better interpret our empirical findings, as well as to highlight possible differences and commonalities in performance, we also look at how key model variables differ across HIGH and LOW regimes for each country. Note that we use each country’s of GDP per capita growth rate in lieu of its rate of convergence to the income frontier as the latter measure would also reflect changes in the United States’ GDP per capita. Interestingly, almost all of the highly diversified countries in ECOWAS register negative GDP per capita growth rates with the exception of Cape Verde. Indeed, it is striking that Cape Verde exhibits not only the highest GDP per capita growth rate in ECOWAS but also one that is fairly consistent across both regimes. This finding accords with those in section 3 and is also reflected in the Cape Verde dummy variable reported in Macedo and Pereira (2010) contributes towards more convergence under the full sample, with an effect almost on par to that of the benchmark dummy. Note also that while Cape Verde is not as diversified as Senegal, it has increased its number equivalent appreciably between regimes as a result of its positive diversification trend over time.
as does a higher budget deficit. This result could mean that increased diversification is associated with less macroeconomic stability. For the HIGH-regime, no relation between inflation and diversification is found while increased budget deficits lead to less diversification and have no effect on convergence. A greater degree of openness leads to less diversification and more convergence under this regime and has no impact whatsoever on the others: inflation is generally lower under the HIGH-regime for countries experiencing both regimes (with the exception of Ivory Coast) while government deficits are higher but only moderately so in most cases and always less than 10% of GDP. For Cape Verde, the result of government deficit consolidation as diversification increased is very clear as is the dramatic lowering of its inflation rate. Diversification coupled with convergence also appears to go hand in hand with an average degree of openness in the range of 60-80% of GDP based on Ivory Coast, Cape Verde and Senegal’s performance on this score.
As for the institutional variables, convergence increases as political and economic freedom increases in ECOWAS. Also, there is more convergence as the age of democracy increases, and this holds true for the LOW-regime. However, an increase in the number of democracies in the system unexpectedly reduces convergence. Under the HIGH-regime, diversification increases with more political and more economic freedom. In the other two cases, diversification is associated with more economic freedom only. Indeed, the effect of economic freedom is pervasive across all samples and its effect is largest precisely under the HIGH-regime. In the full sample, being an older democracy also leads to less diversification as do a larger number of prior transitions to dictatorship in the LOW-regime. There is also more convergence under an English legal tradition.
environment conducive to convergence (full sample). In addition, economic freedom may be a necessary, but not sufficient, condition to underpin successful diversification.
5. Comparative Description
The insights from the estimation of diversification convergence regimes to successful development experiences can be embedded into a comparative description of the broad dimensions of economic growth and foreign trade, of macroeconomic policy and financial reputation and on progress on the MDG and other governance indicators. This is done in three different sub-sections.
5. 1. Economic Growth and Foreign Trade
Union, particularly Portugal and Spain. Most of the export growth, however, has been in tourism notwithstanding the cyclical efforts to diversify the fishing and industrial sectors since the 1990s.
When the government shifted away from a policy of state-control to a free-market one in 1988, tourism also began to development substantially. In line with this policy change, Werlin (1996) observes that this sector’s development entailed the synchronization of public and private investment in infrastructure. Legislation was also passed to encourage tourism, which included streamlining approval of qualified projects, allowing for a gaming industry and setting up a regulatory and enforcement framework. Furthermore, a standard service fee was levied on the users, as opposed to service providers, which helped finance tourism. Direct public investment in infra-structure construction, such as hotels and transportations, was also pursued. Tourism’s contribution to GDP increased from approximately 2% in 1995 to 5% in 2000 and 10% in 2005 (Mitchell, 2008). As noted in IMF (2008a), the balance of payments changed from being very dependent on international aid and emigrants’ remittances to being based on tourism and tourism-related foreign direct investment. In 2001, services exports and foreign direct investment surpassed for the first time transfers as a percentage of GDP. Indeed, Cape Verde became the fastest growing market within the group of tourism based economies whose travel exports have exceeded 10% of GDP for at least one year during 1998-2007, reporting an average annual growth rate of tourism services around 30% during 2000-2006. During the same period Croatia registered an average annual growth rate of 20%, the second highest. Tourism is highly pro-cyclical, however, so an excessive reliance on it increases output volatility unless exports of goods and services are sufficiently diversified. Unfortunately, tourism is absent from the OECD database used in the empirical work.
World Trade Organization in 2008 required a transparent and predictable trade and foreign investment environment, which accelerated Cape Verde’s global integration. It also promoted Trade integration had already been promoted through increased access to preferential markets, such as the US and EU through the African Growth and Opportunity Act and the Cotonou agreement. Although graduated to middle income the status, it continued to benefit from preferential market access for least developed countries. Recent governments have continued the reform process, including those of relevance to financial and exchange markets. Growth has been sustained by the service sector, namely transports, hotel and restaurants and communications, and also due to increased spending on education and improved governance. Indeed, the importance of the service sector, largely in tourism, was evident as early as 1980. Its continued success depends on further improving required infrastructure, namely good communications and a liberalized air transport market. The reform process notwithstanding, the labor market is relatively rigid and administered prices still exist e.g., in the energy sector. Thus structural problems persist and they make adjustment to external shocks more difficult.
5.2. Macroeconomic Policy and Financial Reputation
Adequate implementation and control is also required to ensure that increased foreign direct investment translates into higher growth and employment.
Industrial policy in the 1980s was characterized by less state intervention and more privatization, which led to the creation of a vibrant private sector that contributed positively to growth.
In terms of currency regime, Cape Verde Escudo has been pegged, first to a basket of currencies during 1977-98 and to the Euro thereafter. Exchange rate changes have thus not played a major role in engineering gains in competitiveness. Moreover, the low volatility reflects the control of inflation over the 1990’s.
speeded up the privatization process, improved tax collection and increased the recovery of debt obligations from public enterprises. Current primary expenditure was curtailed to offset higher interest revenue and the government abstained from pre-financing donor-supported investment projects. The composition of the expenditures was also modified while maintaining their level. With these measures, the budgetary position changed from a deficit 15.1% of GDP in 1997 to a surplus of 0.5% in 2000.
The 2001 elections brought about some fiscal slippage but the newly elected PAICV government then sought to reduce the deficit, as well as domestic and external public debt, without overly increasing the tax burden. More recent reforms have streamlined and rationalized taxes on imports, accompanied by a general reduction of customs duties and excises. At the same time, public spending was redirected towards education, health, and other priority areas, in accordance with the government’s poverty reduction strategy. Transfers and subsidies were also reduced substantially, notably subsidies to large public enterprises. As a consequence, current revenues increased from approximately 21% of GDP in 2001 to 23% of GDP in 2004, while current public expenditures were kept constant at around 21%-22% of GDP during the same period. The adoption of an IMF mid-term program in 2006, supported by a new non-financial instrument – Policy Support Instrument– confirmed Cape Verde’s commitment to maintain the pace of reforms and close dialogue on macro-economic policy. The program, completed in 2010, assisted Cape Verde in reducing fiscal risks and minimize the impact of external shocks on its economy by promoting the necessary structural reforms under IMF advice and supervision. While AEO (2010) maintains a positive assessment on financing, the threats to the EU financial system are bound to have a negative effect going forward.
cognizance of this fact when designing and implementing its medium-term development strategy.
5.3. Millennium Development Goals and Governance Indicators
decreased over time, but ECOWAS decreased more markedly when looking at the year-by-year numbers.
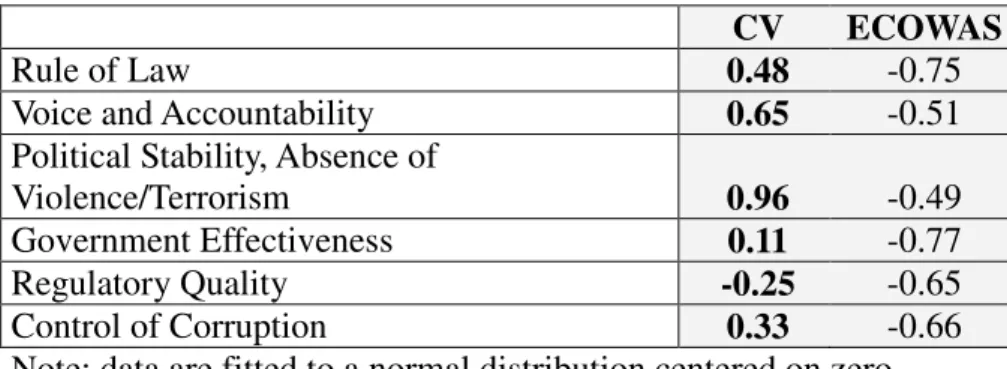
IICT (2007) includes the following six governance indicators from the World Bank Institute: freedom and accountability (FREE), stability and absence of violence (STAB), government efficiency (EF GV), quality of regulation (Q REG), quality of justice (JUST) and control of corruption (CORR) which were reported in Table 1. Good governance has been one of the main features of Cape Verde’s development. Rule of law and accountability stem from the fact that democracy is well established and that free elections take place regularly with the results not being disputed. The only aspect that fares worse is regulatory quality but this indicator still fares better than most ECOWAS member states. Education is a major concern for Cape Verde governments: between 1970 and 1990, the number of children leaving school with secondary education increased dramatically. In 1990, half of the children in rural areas attended secondary school and 60% of girls received secondary education in urban areas (see Goujon and Wils, 1996). The literacy rate in the people between 15 and 24 years old is the highest in all ECOWAS.
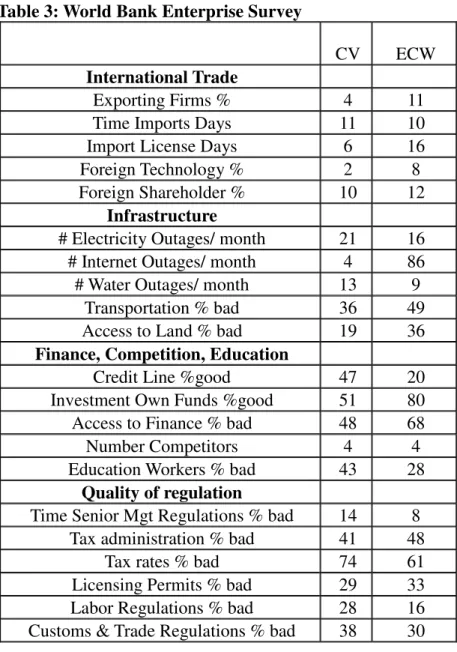
Selected indicators in the 2006 and 2007 World Bank Enterprise Surveys are in Tables 3.The indicators for ECOWAS are simple averages of the countries, some of which are missing. Cape Verde has more developed financial markets, greater macroeconomic stability, less corruption and a state where rule of law is more grounded but less export-oriented firms, less technology licensed to foreigners, higher taxes and a heavier regulatory framework than ECOWAS.
6. Conclusions
Moreover, adequate development responses to globalization become all the more important as globalization increasingly affects political and economic governance, mainly by reducing national policy space and increasing institutional and economic interdependence at various levels. Under these conditions, interactions between globalization and governance can be either positive or negative, depending on the orientation and predictability of economic policies and the accompanying institutional arrangements but also on linkages between cultural, institutional and economic factors.
We first identify the determinants of diversification and convergence at the regional level. Then, we re-estimate the model for sub-samples that capture two different diversification-convergence scenarios in each sub-region. The first sub-sample, denoted as the HIGH-regime, comprises countries that simultaneously exhibit high diversification and high convergence {ygap < 0.945 & neq5 > 4.5} while the second, the LOW-regime, comprises those that exhibit the opposite combination{ygap >= 0.945 & neq5 <= 4.5}. This strategy allows us to highlight differences and commonalities in performance across regimes and regions including regional benchmarks, viz. Senegal.
ECOWAS HIGH-regime countries are becoming more diversified. As for the commonalities or lessons present in the HIGH-regimes, we find that: 1) the expected two-way relationship always exists; 2) convergence always entails macroeconomic stability (inflation < 9%, budget deficits < 7% of GDP); 3) political and economic freedoms are always greater, on average, when compared to the other cases; 4) freedoms always affect diversification policy as do government deficits, albeit in different directions across both sub-regions. However, increasing deficits always counteract prevailing diversification stance. Another sign of regime credibility is that economic freedom always affects diversification in ECOWAS. Efforts at monitoring the MDGs complement the context for financial reputation.
This case study underscores the potential for cooperative governance and peer-review mechanisms outside of its usual domain among OECD and EU member countries. The “culture of peace” helped sustain the move towards a market economy, through greater trade integration especially with the EU and the US, culminating in the membership in the WTO. Multi-party democracy and greater political freedom and civil liberties allowed policy continuity across the political divide and improved human development. This is not to say that human development is sustainable in the face of the current global crisis. In effect, macroeconomic stability was threatened from outside but also through an insufficient attention to public and external deficits. If not appropriately monitored, it could threaten the aspirational foreign policy that Cape Verde’s governments have been willing and able to pursue.
References
AEO (African Economic Outlook), Paris: African Development Bank and OECD Development Centre, various issues.
Andrade, Mário D., Ed. (1978), Obras escolhidas de Amílcar Cabral, A Arma da Teoria, Unidade e Luta I, Lisboa: Seara Nova.
Angel-Urdinola, Diego and Quentin Wodon (2007), “Assessing Absolute and Relative Poverty Trends with Limited Data in Cape Verde.” Growth and Poverty Reduction: Case Studies from West Africa edited by Quentin Wodon, World Bank Working Paper No. 79, pp. 95-197.
Banco de Portugal (2012), Evolução das Economias dos PALOP e de Timor-Leste 2011/2012, Lisboa: 2012,
Bliss, Christopher and Jorge Braga de Macedo (1990), editors, Unity with diversity in the European economy: the Community's southern frontier. Cambridge University Press, Cambridge.
Bonaglia, Federico, Jorge Braga de Macedo and Maurizio Bussolo (2009), How globalisation improves governance, in Linda Yueh (editor), The Law and Economics of Globalisation, Edward Elgar, pp. 193-224.
Borges de Macedo, Jorge (1996), “Mares Abertos e Mares Fechados. Da Dialéctica do Confronto aos Problemas da Cooperação”, Actas dos 2.º Cursos Internacionais de Verão de Cascais, Vol. 1, pp. 185-194, Cascais: Câmara Municipal de Cascais.
Bourguignon, Francois et al (2008), MDG at mid point, Brussels, September.
Branson, William, Jorge de Macedo and David Richardson (1987), Ford Foundation Proposal: Measurement and Estimation of Changes in International Competitiveness, NBER, May.
Cabral, Amilcar (1999), Nacionalismo e Cultura, Santiago de Compostela: Edicións Laiovento.
Cabral, Ana Maria (1995), Programa da Comemoração do XX Aniversário da Independência de Cabo Verde, Washington DC: Festival of American Folklore, Smithsonian Institution. Cabral, S. I. A., (Ed.) (1987), Pour Cabral, Paris: Présence Africaine.
Cabral, Manuel Herédia Caldeira and Paula Veiga (2010), “Determinants of Export Diversification and Sophistication in Sub-Saharan Africa”, Nova SBE Working Paper nº 550, July.
Cardoso, Renato (1986), Cabo Verde : opção para uma política de paz, Praia : Instituto Cabo-Verdiano do Livro.
Causa, Orsetta and Daniel Cohen (2006), The ladder of competitiveness and how to climb it, Paris: OECD Development Centre.
Eichengreen, Barry and David Leblang (2006), “Democracy and Globalization”, NBER Working Paper No. 12450, August.
Espírito Santo Research (2007), “Cape Verde Republic – Reality and Future”, February. Flandreau, Marc and Frédéric Zummer (2004), The Making of Global Finance 1880-1913, Paris: OECD Development Centre Studies.
Frankel, Jeffrey (2010), Mauritius: African Success Story, paper presented at the NBER research conference 2, Accra, Ghana, July
Galtung, J. (1996), Peace by Peaceful means, peace and conflict, development and civilization, New Delhi: Sage.
Garoupa, Nuno and Jose Tavares (2009), “Institutions and Portuguese economic History: Implications and (Brief) Applications”, in Macedo et al (2009a).
Giovannini, Enrico, Joaquim Oliveira Martins and Michaela Gamba (2008), Statistics, Knowledge and Governance, presented at Committing Science to Global Development Workshop, IICT, 26 September (http://www.iict.pt/workshop/Papers/2008092903.pdf)
Gisselquist, Rachel and Robert Rotberg (2008), Index of African Governance, Harvard.
Goujon, Anne and Annababette Wils (1996), “The Importance of Education in Future Population. Global Trends and Case Studies on Cape Verde, Sudan, and Tunisia”, IIASA Working Paper nº 138, November.
Hausmann, R. and D. Rodrik. (2003), “Economic development as self-discovery.” Journal of Development Economics. 72, pp. 603-633.
Hausmann, R., Hwang J. and D. Rodrik (2007), "What you export matters," Journal of Economic Growth, Springer, vol. 12(1), pp. 1-25, March.
IICT (2007), “Relatório sobre CPLP e Objectivos de Desenvolvimento do Milénio”, a report for the Executive Secretary of CPLP by Jorge Braga de Macedo, Luís Brites Pereira, Joaquim Pina and João Jalles, Lisbon: Tropical Research Institute (IICT), October.
Kanbur, Ravi (2004), "The African Peer Review Mechanism (APRM): An Assessment of Concept and Design", Politikon, November.
Kohli (1986),“Democracy and development”. In J. P. Lewis & V. Kallab (Eds.), Development strategies reconsidered. New Brunswick: Transaction Books.
Lopes, Jose Mario and Fabio Santos (2010), “Comparing Exchange Market Pressure in West and Southern African countries”, Nova SBE Working Paper nº 549, July.
Lourenço, Jaime and Foy, Colm (2003), “Cap Vert: Gouvernance et Développement.”, Centre de Développement de l’OCDE, Document de travail No. 225, Novembre.
Macedo, Jorge Braga de (1986), Collective Pegging to a Single Currency: The West African Monetary Union, in The Real Exchange Rate and Adjustment in Developing Countries, edited by Sebastian Edwards e Liaquat Ahamed, Chicago: The University of Chicago Press, pp. 333-362.
Macedo, Jorge Braga de (2001), “Globalization and Institutional Change: A Development Perspective”, in Globalization Ethical and Institutional Concerns, edited by Louis Sabourin and Edmond Malinvaud, The Pontifical Academy of Social Sciences, Acta 7, Vatican City, pp. 223-267.
Macedo, Jorge Braga de (2008), Regional integration and mutual knowledge: The case of the CPLP, presented at Committing Science to Global Development Workshop, IICT, 26 September (http://www.iict.pt/workshop/Papers/2008091401.pdf)
Macedo, Jorge Braga de (2009), “Economic Advice and Regime Change in Portugal”, in Francesco Franco (editor), Challenges Ahead for the Portuguese Economy, Lisbon: ICS, pp. 201-229.
Macedo, Jorge Braga de (2011), “Global crisis and national policy responses: together alone?” in Michel Renaud and Gonçalo Marcelo, Ética, Crise e Sociedade, V.N. Famalicão, Húmus, pp.91-159
Macedo, Jorge Braga de and Luís Brites Pereira (2007), “Diferencialidade Portuguesa na Globalização”, Negócios Estrangeiros, 11(2), July, pp. 223-236.
Macedo, Jorge Braga de, Joaquim Oliveira Martins and Luís Brites Pereira (2007), How Freedoms interact with globalization, presented at conference on globalization and democracy, Princeton University, September 27-28, revision in progress.
Macedo, Jorge Braga de, Luciano Amaral, Álvaro Ferreira da Silva and António Castro Henriques (2009a), editors Nove Ensaios na tradição de Jorge Borges de Macedo, Lisboa: Tribuna da História em colaboração do CG&G e IICT.
Macedo, Jorge Braga de, Luís Brites Pereira and Afonso Mendonça Reis (2009b), Comparing Exchange Market Pressure across Five African Countries, Open Economies Review: Volume 20, Issue 5, p. 645.
Macedo, Jorge Braga de and Luís Brites Pereira (2010), Cape Verde and Mozambique as Development Successes in Sub Saharan African, NBER Working Paper nº 16552, November Macedo, Jorge Braga de, Joaquim Oliveira Martins and Bruno Rocha (2012), Are complementary reforms a "luxury" in developing countries?, mimeo in revision, July.
Maddison, Angus (2007), Contours of the World Economy 0-2030 AD, Oxford University Press.
Maravall (1995), “The myth of the authoritarian advantage”, in L. Diamond & M. F. Plattner (Eds.), Economic reform and democracy, Baltimore: The Johns Hopkins University Press. Maxwell, Kenneth (2004), Conflicts and Conspiracies Brazil and Portugal 1750-1808, New York: Routledge (originally published in 1973).
Mitchell (2008), Tourism Development in Cape Verde: The policy challenge of coping with success, Overseas Development Institute.
Nye, Joseph (2002), "A Whole New Ball Game" Financial Times Dec 28.
Oman, Charles and Christiane Arndt (2006), Uses and Abuses of Governance Indicators, Paris: OECD Development Centre
Persson, Torsten and Guido Tabellini (2006), “Democratic capital the nexus of political and economic change”, NBER Working Paper No. 12175.
Pires, Pedro (2010), Discurso proferido por Sua Excelencia o Senhor Presidente da Republica de Cabo Verde na Cerimonia de Atribuicao do Grau de Doutor Honoris Causa pela Universidade Tecnica de Lisboa, June.
PNUD (2004), “La Situation du Développement Humain au Cap Vert”, Rapport national sur le développement humain, United Nations.
Przeworski, Adam, M. Alvarez, J.A. Cheibub and F. Limongi (2000), Democracy and Development: Political Institutions and Well-Being in the World, 1950-1990, Cambridge: Cambridge University Press.
Przeworski Adam and Fernando Limongi (1993), “Political regimes and economic growth.”, The Journal of Economic Perspectives, 7, pp. 51–69.
Reinhart, Carmen and Kenneth Rogoff (2009), This time is different: eight centuries of financial folly, Princeton University Press, Princeton.
Remmer (1990), Democracy and economic crisis: The Latin American Experience. World Politics, 42, pp. 315–335.
Ribeiro, Ana Paula, João Loureiro and Manuel M. F. Martins (2008), Assessment of the Exchange Rate Cooperation Agreement Cape Verde-Portugal, Ministry of Finance, October Rodrik, D. (2005), “Policies for Economic Diversification.” CEPAL Review 87, pp. 7–23. Santos, Vanda (2010), Post-colonial Cape Verdean culture as a contributor to a culture of peace, Ph.D dissertation presented to Universitat Jaume I, “La cultura postcolonial en Cabo Verde como aporte a una cultura de paz”.
Werlin (1996), Cape Verde: Emerging Tourist Destination, George Washington University, 1996.
Table 1: World Bank Governance Indicators (1996-2007)
CV ECOWAS
Rule of Law 0.48 -0.75
Voice and Accountability 0.65 -0.51
Political Stability, Absence of
Violence/Terrorism 0.96 -0.49
Government Effectiveness 0.11 -0.77
Regulatory Quality -0.25 -0.65
Control of Corruption 0.33 -0.66
Note: data are fitted to a normal distribution centered on zero
Table 2 Nominal and Real Effective Exchange Rates based on Consumer Prices
Nominal Real
2000 100 100
2001 102 100
2002 103 100
2003 106 100
2004 106 96
2005 104 92
2006 104 94
2007 103 96
2008 103 100
2009 104 101
2010 102 100
2011 102 101
Table 3: World Bank Enterprise Survey
CV ECW
International Trade
Exporting Firms % 4 11
Time Imports Days 11 10
Import License Days 6 16
Foreign Technology % 2 8
Foreign Shareholder % 10 12
Infrastructure
# Electricity Outages/ month 21 16 # Internet Outages/ month 4 86
# Water Outages/ month 13 9
Transportation % bad 36 49
Access to Land % bad 19 36
Finance, Competition, Education
Credit Line %good 47 20
Investment Own Funds %good 51 80
Access to Finance % bad 48 68
Number Competitors 4 4
Education Workers % bad 43 28
Quality of regulation
Time Senior Mgt Regulations % bad 14 8 Tax administration % bad 41 48
Tax rates % bad 74 61
Licensing Permits % bad 29 33
Labor Regulations % bad 28 16
Figure 1 Cape Verde and ECOWAS GDP per capita in international $
Figure 2
2
4
6
8
1
0
1
2
n
e
q
5
.9
4
.9
5
.9
6
.9
7
y
g
a
p
1960 1970 1980 1990 2000
year
ygap neq5
INCOME GAP TO FRONTIER & NUMBER EQUIVALENT
Figure 3 NER NER NER NER NER NER NER NER NER NER NER NER NER NER NER NER NER NER NER NER NER NER NER NER NER NER NER NER NER NER NER NER NER NER NER NER NER NER NER NER NER NER NER NER NER NGA NGA NGA NGA NGA NGA NGA NGA NGA NGA NGA NGA NGA NGA NGA NGA NGA NGA NGA NGA NGA NGA NGA NGA NGA NGA NGA NGA NGA NGA NGA NGA NGA NGA NGA NGA NGA NGA NGA NGA NGA NGA NGA NGA NGA GIN GIN GIN GIN GIN GIN GIN GIN GIN GIN GIN GIN GIN GIN GIN GIN GIN GIN GIN GIN GIN GIN GIN GIN GIN GIN GIN GIN GIN GIN GIN GIN GIN GIN GIN GIN GIN GIN GIN GIN GIN GIN GIN GIN GIN MLI MLI MLI MLI MLI MLI MLI MLI MLI MLI MLI MLI MLI MLI MLI MLI MLI MLI MLI MLI MLI MLI MLI MLI MLI MLI MLI MLI MLI MLI MLI MLI MLI MLI MLI MLI MLI MLI MLI MLI MLI MLI MLI MLI MLI GMB GMB GMB GMB GMB GMB GMB GMB GMB GMB GMB GMB GMB GMB GMB GMB GMB GMB GMB GMB GMB GMB GMB GMB GMB GMB GMB GMB GMB GMB GMB GMB GMB GMB GMB GMB GMB GMB GMB GMB GMB GMB GMB GMB GMB BFA BFA BFA BFA BFA BFA BFA BFA BFA BFA BFA BFA BFA BFA BFA BFA BFA BFA BFA BFA BFA BFA BFA BFA BFA BFA BFA BFA BFA BFA BFA BFA BFA BFA BFA BFA BFA BFA BFA BFA BFA BFA BFA BFA BFA GHA GHA GHA GHA GHA GHA GHA GHA GHA GHA GHA GHA GHA GHA GHA GHA GHA GHA GHA GHA GHA GHA GHA GHA GHA GHA GHA GHA GHA GHA GHA GHA GHA GHA GHA GHA GHA GHA GHA GHA GHA GHA GHA GHA GHA SLE SLE SLE SLE SLE SLE SLE SLE SLE SLE SLE SLE SLE SLE SLE SLE SLE SLE SLE SLE SLE SLE SLE SLE SLE SLE SLE SLE SLE SLE SLE SLE SLE SLE SLE SLE SLE SLE SLE SLE SLE SLE SLE SLE SLE TGO TGO TGO TGO TGO TGO TGO TGO TGO TGO TGO TGO TGO TGO TGO TGO TGO TGO TGO TGO TGO TGO TGO TGO TGO TGO TGO TGO TGO TGO TGO TGO TGO TGO TGO TGO TGO TGO TGO TGO TGO TGO TGO TGO TGO GNB GNB GNB GNB GNB GNB GNB GNB GNB GNB GNB GNB GNB GNB GNB GNB GNB GNB GNB GNB GNB GNB GNB GNB GNB GNB GNB GNB GNB GNB GNB GNB GNB GNB GNB GNB GNB GNB GNB GNB GNB GNB GNB GNB GNB LBR LBR LBR LBR LBR LBR LBR LBR LBR LBR LBR LBR LBR LBR LBR LBR LBR LBR LBR LBR LBR LBR LBR LBR LBR LBR LBR LBR LBR LBR LBR LBR LBR LBR LBR LBR LBR LBR LBR LBR LBR LBR LBR LBR LBR BEN BEN BEN BEN BEN BEN BEN BEN BEN BEN BEN BEN BEN BEN BEN BEN BEN BEN BEN BEN BEN BEN BEN BEN BEN BEN BEN BEN BEN BEN BEN BEN BEN BEN BEN BEN BEN BEN BEN BEN BEN BEN BEN BEN BEN CIV CIV CIV CIV CIV CIV CIV CIV CIV CIV CIV CIV CIV CIV CIV CIV CIV CIV CIV CIV CIV CIV CIV CIV CIV CIV CIV CIV CIV CIV CIV CIV CIV CIV CIV CIV CIV CIV CIV CIV CIV CIV CIV CIV CIV CPV CPV CPV CPV CPV CPV CPV CPV CPV CPV CPV CPV CPV CPV CPV CPV CPV CPV CPV CPV CPV CPV CPV CPV CPV CPV CPV CPV CPV CPV CPV CPV CPV CPV CPV CPV CPV CPV CPV CPV CPV CPV CPV CPV CPV SEN SEN SEN SEN SEN SEN SEN SEN SEN SEN SEN SEN SEN SEN SEN SEN SEN SEN SEN SEN SEN SEN SEN SEN SEN SEN SEN SEN SEN SEN SEN SEN SEN SEN SEN SEN SEN SEN SEN SEN SEN SEN SEN SEN SEN .9 2 .9 4 .9 6 .9 8 y g a p m e a n
2 3 4 5 6
neq5 mean
Lowess smoothing, bandwidth = 0.8
INCOME GAP vs NUMBER EQUIVALENT - COUNTRY MEANS
ECOWAS
Figure 4
CPVBENG M BG HAG NBG I NCI VLBRM LINERNG ASENSLETG OBFA
CPVBENG M BG HAG NBG I NCI VLBRM LINERNG ASENSLETG OBFA
CPVBENG M BG HAG NBG I NCI VLBRM LINERNG ASENSLETG OBFA CPVBENG M BG HAG NBG I NCI VLBRM LINERNG ASENSLETG OBFA
CPVBENG M BG HAG NBG I NCI VLBRM LINERNG ASENSLETG OBFA CPVBENG M BG HAG NBG I NCI VLBRM LINERNG ASENSLETG OBFA
CPVBENG M BG HAG NBG I NCI VLBRM LINERNG ASENSLETG OBFA
CPVBENG M BG HAG NBG I NCI VLBRM LINERNG ASENSLETG OBFA CPVBENG M BG HAG NBG I NCI VLBRM LINERNG ASENSLETG OBFA
CPVBENG M BG HAG NBG I NCI VLBRM LINERNG ASENSLETG OBFA CPVBENG M BG HAG NBG I NCI VLBRM LINERNG ASENSLETG OBFA CPVBENG M BG HAG NBG I NCI VLBRM LINERNG ASENSLETG OBFA CPVBENG M BG HAG NBG I NCI VLBRM LINERNG ASENSLETG OBFA
CPVBENG M BG HAG NBG I NCI VLBRM LINERNG ASENSLETG OBFA CPVBENG M BG HAG NBG I NCI VLBRM LINERNG ASENSLETG OBFA
CPVBENG M BG HAG NBG I NCI VLBRM LINERNG ASENSLETG OBFA CPVBENG M BG HAG NBG I NCI VLBRM LINERNG ASENSLETG OBFA
CPVBENG M BG HAG NBG I NCI VLBRM LINERNG ASENSLETG OBFA CPVBENG M BG HAG NBG I NCI VLBRM LINERNG ASENSLETG OBFA
CPVBENG M BG HAG NBG I NCI VLBRM LINERNG ASENSLETG OBFA CPVBENG M BG HAG NBG I NCI VLBRM LINERNG ASENSLETG OBFA
CPVBENG M BG HAG NBG I NCI VLBRM LINERNG ASENSLETG OBFA CPVBENG M BG HAG NBG I NCI VLBRM LINERNG ASENSLETG OBFA
CPVBENG M BG HAG NBG I NCI VLBRM LINERNG ASENSLETG OBFA CPVBENG M BG HAG NBG I NCI VLBRM LINERNG ASENSLETG OBFA
CPVBENG M BG HAG NBG I NCI VLBRM LINERNG ASENSLETG OBFA
CPVBENG M BG HAG NBG I NCI VLBRM LINERNG ASENSLETG OBFA CPVBENG M BG HAG NBG I NCI VLBRM LINERNG ASENSLETG OBFA
CPVBENG M BG HAG NBG I NCI VLBRM LINERNG ASENSLETG OBFA CPVBENG M BG HAG NBG I NCI VLBRM LINERNG ASENSLETG OBFA
.9 3 .9 4 .9 5 .9 6 .9 7 y g a p m e a n
-10 -8 -6 -4 -2
govdef mean
Lowess smoothing, bandwidth = 0.8
INCOME GAP vs GOVERNMENT DEFICIT - TIME MEANS
Figure 5: Relation between Economic and Political Freedoms in ECOWAS GIN GIN GIN GIN GIN GIN GIN GIN GIN GIN GIN GIN GIN GIN GIN GIN GIN GIN GIN GIN GIN GIN GIN GIN GIN GIN GIN GIN GIN GIN GIN GIN GIN GIN GIN GIN GIN GIN GIN GIN GIN GIN GIN GIN GIN TGO TGO TGO TGO TGO TGO TGO TGO TGO TGO TGO TGO TGO TGO TGO TGO TGO TGO TGO TGO TGO TGO TGO TGO TGO TGO TGO TGO TGO TGO TGO TGO TGO TGO TGO TGO TGO TGO TGO TGO TGO TGO TGO TGO
TGO NERNERNERNERNERNERNERNERNERNERNERNERNERNERNERNERNERNERNERNERNERNERNERNERNERNERNERNERNERNERNERNERNERNERNERNERNERNERNERNERNERNERNERNERNER CIV CIV CIV CIV CIV CIV CIV CIV CIV CIV CIV CIV CIV CIV CIV CIV CIV CIV CIV CIV CIV CIV CIV CIV CIV CIV CIV CIV CIV CIV CIV CIV CIV CIV CIV CIV CIV CIV CIV CIV CIV CIV CIV CIV CIV GNB GNB GNB GNB GNB GNB GNB GNB GNB GNB GNB GNB GNB GNB GNB GNB GNB GNB GNB GNB GNB GNB GNB GNB GNB GNB GNB GNB GNB GNB GNB GNB GNB GNB GNB GNB GNB GNB GNB GNB GNB GNB GNB GNB GNB SLE SLE SLE SLE SLE SLE SLE SLE SLE SLE SLE SLE SLE SLE SLE SLE SLE SLE SLE SLE SLE SLE SLE SLE SLE SLE SLE SLE SLE SLE SLE SLE SLE SLE SLE SLE SLE SLE SLE SLE SLE SLE SLE SLE SLE MLI MLI MLI MLI MLI MLI MLI MLI MLI MLI MLI MLI MLI MLI MLI MLI MLI MLI MLI MLI MLI MLI MLI MLI MLI MLI MLI MLI MLI MLI MLI MLI MLI MLI MLI MLI MLI MLI MLI MLI MLI MLI MLI MLI MLI BFA BFA BFA BFA BFA BFA BFA BFA BFA BFA BFA BFA BFA BFA BFA BFA BFA BFA BFA BFA BFA BFA BFA BFA BFA BFA BFA BFA BFA BFA BFA BFA BFA BFA BFA BFA BFA BFA BFA BFA BFA BFA BFA BFA BFA BEN BEN BEN BEN BEN BEN BEN BEN BEN BEN BEN BEN BEN BEN BEN BEN BEN BEN BEN BEN BEN BEN BEN BEN BEN BEN BEN BEN BEN BEN BEN BEN BEN BEN BEN BEN BEN BEN BEN BEN BEN BEN BEN BEN BEN NGA NGA NGA NGA NGA NGA NGA NGA NGA NGA NGA NGA NGA NGA NGA NGA NGA NGA NGA NGA NGA NGA NGA NGA NGA NGA NGA NGA NGA NGA NGA NGA NGA NGA NGA NGA NGA NGA NGA NGA NGA NGA NGA NGA NGA GHA GHA GHA GHA GHA GHA GHA GHA GHA GHA GHA GHA GHA GHA GHA GHA GHA GHA GHA GHA GHA GHA GHA GHA GHA GHA GHA GHA GHA GHA GHA GHA GHA GHA GHA GHA GHA GHA GHA GHA GHA GHA GHA GHA GHA SEN SEN SEN SEN SEN SEN SEN SEN SEN SEN SEN SEN SEN SEN SEN SEN SEN SEN SEN SEN SEN SEN SEN SEN SEN SEN SEN SEN SEN SEN SEN SEN SEN SEN SEN SEN SEN SEN SEN SEN SEN SEN SEN SEN
SEN CPVCPVCPVCPVCPVCPVCPVCPVCPVCPVCPVCPVCPVCPVCPVCPVCPVCPVCPVCPVCPVCPVCPVCPVCPVCPVCPVCPVCPVCPVCPVCPVCPVCPVCPVCPVCPVCPVCPVCPVCPVCPVCPVCPVCPV GMBGMBGMBGMBGMBGMBGMBGMBGMBGMBGMBGMBGMBGMBGMBGMBGMBGMBGMBGMBGMBGMBGMBGMBGMBGMBGMBGMBGMBGMBGMBGMBGMBGMBGMBGMBGMBGMBGMBGMBGMBGMBGMBGMBGMB
3 .5 4 4 .5 5 5 .5 e f m e a n
2 2.5 3 3.5 4 4.5
prcl mean
Lowess smoothing, bandwidth = 0.8
ECONOMIC vs POLITICAL FREEDOM - COUNTRY MEANS
ECOWAS