A Work Project, presented as part of the requirements for the Award of a Masters Degree in Management from the NOVA – School of Business and Economics.
S
MARTM
ACHINES IN DAY-
TO-
DAY FINANCIAL MANAGEMENT:
A
LAUNCH STRATEGY FOR AP
ERSONALF
INANCIALA
DVISORA
PPIN THE
UK
M
ILLENNIALS MARKETLuís Pinto Costa
Student Number: 1885
A Project carried out on the Management Masters, under the supervision of Professor Paulo Faroleiro
i. Abstract
Starting from Novabase’s challenge to launch in the UK Millennials a personal financial advisor mobile application, this work project aims to build a planning model to frame a business side of a launch strategy for mobile application in similar market and category.
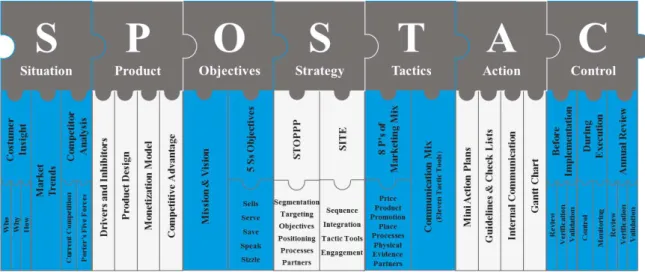
This study culminates on the design of SPOSTAC planning model. The created framework is intended to effectively and efficiently plan a launch strategy, being structured based on
seven sequential elements: Situation, Product, Objectives, Strategy, Tactics, Action, and Control.
ii. Executive summary
Novabase, a Portuguese IT consulting company is developing a mobile application to make
life simpler and happier by facilitating the way how people manage their personal finances. Being a traditional B2B consulting company, Novabase is facing organizational challenges
regarding the B2C channel. The new app was named finzzy and wants to be positioned as the state of art in personal financial management (PFM) apps. This will aloud the opening of a new product category, the personal financial advisor (PFA) apps, where the app
operates not just as a tracking tool but add a level of knowledge to efficiently advise the users. Novabase defined United Kingdom (UK) as a market to release finzzy, and
Millennials as the market segment to focus. This working paper will address the challenge of launching PFA tools like finzzy in UK Millennials market.
“By failing to prepare, you are preparing to fail.” -- Benjamin Franklin. The relevance on
develop a right plan to efficiently and effectively prepare a successful launch strategy leads to the need to define a right planning model. To create a launching plan model, a manager
knows that customers, current competitors and potential substitutes may have to be analysed, as well as, product, goals and the concrete strategy. Thus, it was important to
perform a correct framework. The SOSTAC1 plan model by Smith (2014), gives logical and objective ways to analyse the current position of the company with the target market, and develops the business-enlargement plan for the manager. This planning tool was
projected to elaborate online marketing plans to establish companies. To plan a launch strategy, it is needed to understand the relevant differences in the requirements for each
type of planning tool.
To solve the problem of finding the right structure of a launching strategy it was developed
a thorough analysis of different frameworks. The relevant tools and methodologies were founded and merged into, what is meant to be, a complete and efficient plan model for an
app launch strategy. The SOSTAC plan that was used as a base model, adding the Product perspective in the framework, with a few adjustments. A SPOSTAC plan model was raised and stands out to cover (i) Situation Analysis, overlooking the customers, market trends
and competitors, (ii) Product, addressing the product design and competitive advantage; (iii) Objectives, defining targets to the plan and the product; (iv) Strategy, creating a high
level guidelines for product and launch plan; (v) Tactics, breaking down the strategy; (vi) Actions, setting the activities and events to execute the overall strategy; and (vii) Control, establishing procedures to ensure right implementation and continuous improvement.
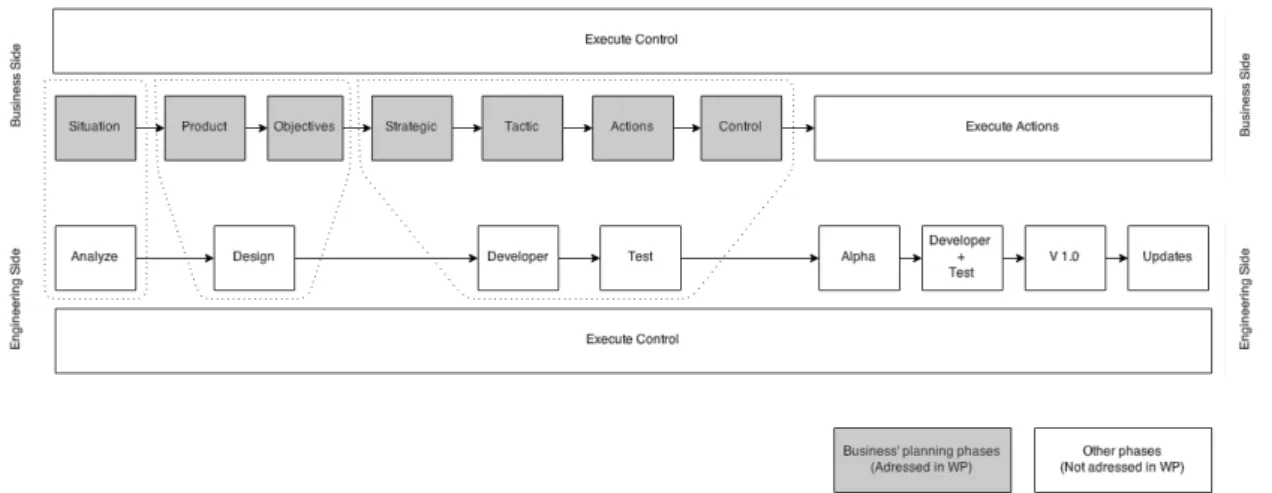
To conclude, the academic relevance of this work project is based on the strength of the framework created to plan the business side in a launch strategy for an app (Figure 1). The SPOSTAC planning model plan application was then tested applying it on every step of
finzzy’ launch strategy for UK Millennials market.
iii. Table of Contents
i. Abstract ... 1
ii. Executive summary ... 2
iii. Table of Contents ... 4
1. Situation ... 5
1.1. Customer insight ... 5
1.2. Market trends ... 8
1.3. Competitor Analysis ... 10
2. Product ... 11
2.1. Drivers and inhibitors on the category ... 11
2.2. Product Design ... 12
2.3. Monetization Model ... 13
2.4. Competitive advantage ... 14
3. Objectives ... 15
3.1. Mission & Vision ... 15
3.2. 5 Ss Objectives ... 16
4. Strategy ... 17
4.1. STOPPP ... 18
4.2. SITE ... 19
5. Tactics ... 20
5.1. 8 P’s of Marketing Mix ... 20
5.2. Communication Mix ... 21
6. Actions ... 22
7. Control ... 23
iv. Conclusions ... 25
v. References ... 27
1.
Situation
“Much computation brings triumph. Little computation brings defeat.” – Sun Tzu. That’s
how Sun Tzu describes the relevance of bringing a strong and depth analysis to structure a strategy. In this sense, this first stage can be seen as “taking a picture” of the current
situation. Extensive internal and external analysis should be done at this stage to understand the consumer and the current situation in this market. The situation analysis will developed an in-depth costumer analysis, this needs, behaviours and purchase process.
This chapter will also cover the relevant market trends for the product category and a competition landscape analysis. The market situation is completed with the elaboration of
the Porter’s fiver forces.
1.1. Customer insight
The first aspect to take in account is costumer centricity. This is the philosophy that every company should adopt to guarantee a successful path in the market. A Bain & Co. (2005)
study found a huge discrepancy while analysing the customer experience from the companies’ perspective: they claim that 80% of superior experience are given to clients;
on the other hand, by analysing the customers’ perspective, just 8% of experiences are really delivered. To develop the customer insight it is recommended to answer three simple but effective questions that follow the MECE principle2 (Rasiel, 1999). By asking (i) who
the potential clients are, (ii) why they need the product and (iii) how they behave during the acquisition process, the analyst made a clean report. The outcome was clear and
objective: by separating the distinctive categories of information, it allowed no overlaps (mutual exclusive) and a full review on the customer insights (collectively exhaustive).
1.1.1. Who
This topic will analyse the customer profiling, by defining who the ideal customer for this product is. With this, the company will know which type of costumers are worth to
spending resources on, making the journey of finding new profitable costumers much efficient. Shortly, this topic will address the customer profiles, segmenting them into different classes and define personas who represent a typical user with similar needs, goals
and motivations, for each segment.
The case study will focus on the Millennials in the UK. There are no precise dates when the generation starts and ends. Howe and Strauss (1992) define Millennial as a person who
born between 1982 and 2004. Millennials are described as independently dependent, practically motivated, tech-savvy, social mindful, and financial freshmen (Deloitte, 2009).
Therefore, it’s clear why Millennials are so different from the precedent generation
(Generation X): the difference relies in how to make financial transactions, patterns of spending and saving and investments. Financial services must take this difference in
account (Oracle, 2010).
Looking into demographic segmentation, UK Millennials are actually (2015) 17.1M,
representing 27% of overall UK population. According Office for National Statistics (2015) this segment of population will increase to 17.9M in 2025. Taking a cue from the
segmentation that have been offered by the U.S. Census Bureau, the Millennials will be segmented in to four distinct profiles: (i) dual earners with kids (DEWKs), (ii) dual income, no kids (DINKs), (iii) single and living alone (SALA), and (iv) college students. Having
in account the four segments presented above, the profile analyst sketched three distinct customer behaviours reflected into three target profiles (see full description in Appendix
1.1.2. Why
This topic will focus on the question: why do customers buy or not the product. This is an important fact to take in account by the marketers because it will give the right knowledge
on how to wisely spend the resources, regarding both channels and message. To draw strong conclusions, it is recommended to take in consideration some available literature for this market or similar ones, as well as run a survey on the target population.
In the case of finzzy is relevant to highlight that an Oracle (2010) study on US Millennials reported that 37% of the respondents felt the need of assistance in managing their financial affairs. In the same direction, a Novantas (2014) study highlighted the importance of PFM
solutions, referring that 46% of respondents wanted their next institution to offer PFM tools. By looking on UK College Students, an Accountz (2011) study said that 70% of
respondents would like more support from their bank when it comes to budgeting, and 84% felt that money management tools would dramatically improve their ability to budget and help them gain control of their finances.
In the same direction, the conducted survey (Appendix 1.2) shows the UK Millennials’ interest on PFA solutions, recording that 31.5% of respondents are actively looking for this
type of solutions. Supporting the relevance of PFA solutions, the survey shows that just 9.3% of respondents claims that have fully capacity to manager their personal finances.
In summary, UK Millennials are looking for an option to better solve the issue of managing
1.1.3. How
To close the customer insight analysis, and after understanding who are our customers, and their needs, it is essential to know how the customer will buy the product: their discover
process, the decision journey and the main influencers. With this, marketers are able to build a communication mix to accelerate the purchase journey and deliver a message that fit the decision process.
In this type of products, family and friends play a major role as a support in the decision process. This fact is supported by the BNY Mellon study (2014) which shows that
Millennials overwhelmingly see their parents as the primary source of advice on financial
planning. In fact, 52% of respondents would turn to their parents first for financial advice,
compared with 24% who would speak to their bank. The conducted survey also showed the
relevance of friends and family (37.0%) on the decision process. Nevertheless, the survey
brings an interesting fact on Millennials’ profile, revealing that Millennials are mostly
independent on finding a new solution, with 64.8% of respondents (Appendix 1.2).
1.2. Market trends
Trend analysis is based on the concept that what happened in the past can give traders and
hint on what will happen in the future. Hence, a well grasp on what are the main trends in the market and how they behave along the time will transfer to the plan a good
understanding on what can be the future on the market that the product will operate.
So, from a Financial Services market point of view, to analyse the strength of finzzy’ entry on the market, it is crucial to understand how banking and financial services environment
changed, as well as the prediction to the following years. On Bank 2.0, Brett King (2010) reflected and changed the way how banking was conceived, analysing (i) the impact of
customer behaviour and the necessity of banks to adapt themselves to this new reality. Just
two years after, King (2012) felt the need to launch Bank 3.0, focusing on the latest trends and consequently redefining financial services and payments. This redefinition led to
customer centricity on banking industry. Some other researches shown the digital era as a propeller in the financial services innovation: according to Deloitte (2014), banks had to adapt to this new era of digital banking; EY and PwC (2014) reported that banks should
be more simpler and clean on helping customers making their financial decisions. In the banking industry, it also needed to highlight a new trend that emerged after the 2008
financial crisis: the banking without bank. In some countries such as US and UK, leading retailers took up the challenge and have now been offering financial services for many years (Worthington et al, 2011). In summary, financial services are changing to a whole
new concept where banking is no longer somewhere to go but something to do.
Another visible trend refers to the diversity and user-base expansion of PFM services, both in terms of channels and of specific features and approaches adopted. Initially they were
basic level tools, then evolved to an analytical level, and currently being action-taking level tools (Mapa, 2014). Geographically, for a while, the PFM trend was restricted to the US.
Then, some PFM vendors emerged in Europe and, in 2012, the first PFM open operations in Asia (Gartner, 2012). PFM is currently a focus of banking innovation with some
launches of PFM tools to complement the online banking. Is interesting to notice that this trend on tracking personal finances are align with the boom recorded in other tracking tools, like the ones related to health, food and work-out.
In the technology field, it is crucial to underline the trend in smart machines, enhancing the benefits of using learning tech in the day to day systems. Smart machines are a rapidly
2014b). This technology opens new windows of opportunities through some appliance
such as (i) Smart Advisor, a type of smart machines that deliver the best answers to users' questions based on their analysis of large bodies of ingested content and knowledge of the
users' needs; (ii) Virtual Personal Assistant, that arguably integrates a broader range of information sources to personally advise with accuracy; (iii) Natural-Language Processing that offers a natural-language generator that can improve understanding and reduce the
risks of cognitive biases in decision making (Gartner, 2014a). This technology will change the way of how we see informatics systems, by having a huge impact on every industry in
the next few years.
The trends reported above simple align to the product that Novabase is creating, showing relevance of this product on the current market status, mainly in the near future.
1.3. Competitor Analysis
After knowing the customer and understanding the market environment, is the time to analyse the competition and define what the main strengths are. To have a better notion on how the competition is structured, they were placed in strategic groups according to how
directly they compete in the market. It is known that to sustain long-term profitability it is necessary to respond strategically to potential competition and not just established rivals.
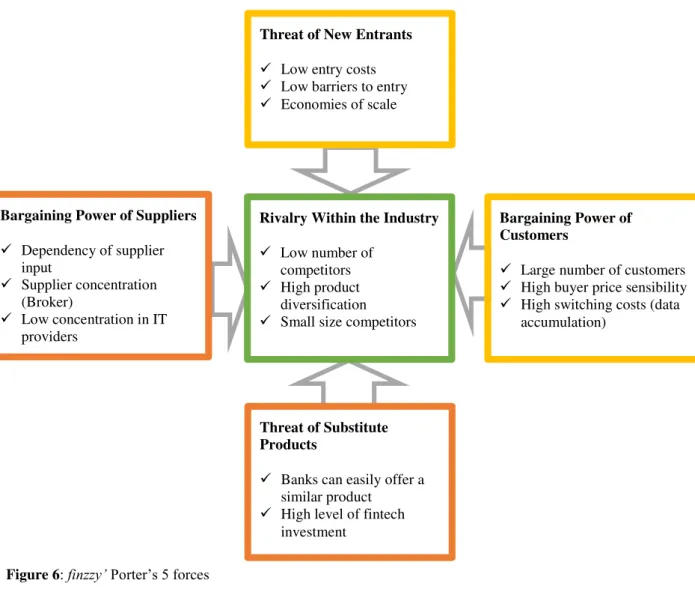
By performing a Porter’s five forces, the competitive landscape is scanning and it gives
hints on how to face the forces of competitive position (Porter, 2008). Contrary to what normally is performed in competition analysis, on the case of app market, due to the
novelty and the fast change on the application market, the PESTLE3 analysis is not relevant for the case because its implementation do not add value to the overall study.
Regarding the specific market in analysis, the competition is split in three main categories,
according the different strategic position and the main feature of the apps: (i) simple PFM mobile app, (ii) third party aggregators and (iii) Bank PFM Solutions (see full description
in Appendix 4). To complete the analysis, the Porter’s five forces was made in order to better define the competitive landscape for industry market (Appendix 5). The analysis highlighted that the key risks are not in the current competition (reflected in the relatively
low rivalry among existing competitors) but on the high bargaining power of suppliers and the thread of substitute products reflected in the ability to banks quickly serve their clients
with PFM tools.
2.
Product
The previous analysis showed the existing need of this product, the historical trends and finally the competition landscape. Based on the existing necessity, the next topic will focus on the product that can fill the market gap. In this way, the analyse should covered (i) the
drivers and inhibitors that will affect the usability of the product in the market, being useful to better define the product, (ii) product design giving insights on how the product fill the
market needs, and (iii) monetization model to understand the viability of the product in the market. A full analysis in these topics will help define the competitive advantages of the app.
2.1. Drivers and inhibitors on the category
information is crucial for the creation and adaptation of the product, as well as to push it
to the market by using an effective message.
The conducted survey’ results (Appendix 1.3.2) follow almost entirely the findings in similar researches, showing that (i) perceived usefulness, (ii) perceived ease of use, (iii)
perceived enjoyment, (iv) compatibility, and (v) trust are drivers of intention to use. In the opposite, perceived risk stands out as an inhibitor on the intention to use PFA solutions.
With this survey, it was not proved that technical barriers have a significant direct correlation on intention to adopt PFA solutions (Figure 2).
Note: * p≤0.005; ** p≤0.001; dotter line denotes non-significant relationship
Figure 2: Standardised theoretical path coefficients
As a result, this study highlight that Novabase should focus more on showcase to consumers the usefulness, convenience, enjoyment and advantages of PFA solution than on directly influencing behavioural intentions. It is also important to reduce the perceived
risk, ensuring a safety and trustable service.
2.2. Product Design
To succeed in product design, many disciplines need to be involved. Thus, a manager should not plan a product design without the technological viability and, the product design
a user friendly system, some other areas of expertise can add value, such as psychology,
graphic designer or product designer (Rogers et al, 2002).
The PFA keystone is the user experience provided, and finzzy is no exception. Taking this in account, the development of the product should focus on being user-friendly, useful and
relevant. According to Forrester (2015), the best practices for this type of products are: (i)
take a systematic approach and focus on understanding customers’ needs, (ii) make it easy
for customers to achieve their save goals, (iii) use marketing and education to drive customer adoption, and (iv) provide useful advice that is easy to use and fun.
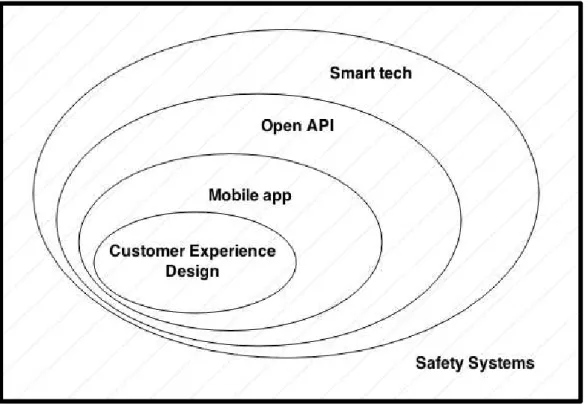
finzzy aims to be a relevant advisor and, consequently, needs to developed with a customer centricity design. Reinforcing the usability and be every time near to user, finzzy is framed as a mobile app. A PFA needs to have fully access to personal finance information and,
therefore, finzzy use open API technology (through a partner) to allow bank synchronization. The advisory power is not on being resourceful but on being smart; so
finzzy differentiates itself by using a mix of smart technologies on areas such as natural-language processing, predictive and prescriptive algorithms, agile business intelligence, and machine learning. Safety is definitely an important issue on PFA solutions and finzzy
is protected with certified safety systems. See more details on product architecture in Appendix 6. Regarding features, the main areas are (i) transactions, (ii) goals, (iii) analyze,
(iv) planner, (v) accounts management, (vi) yoda, and (vii) u.ments grid (see full list of features on Appendix 7).
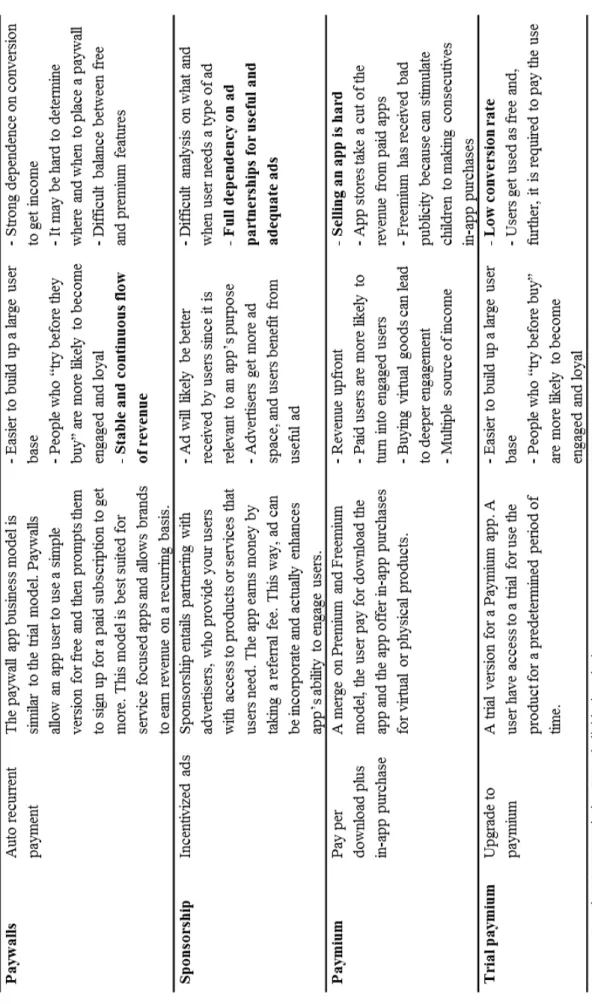
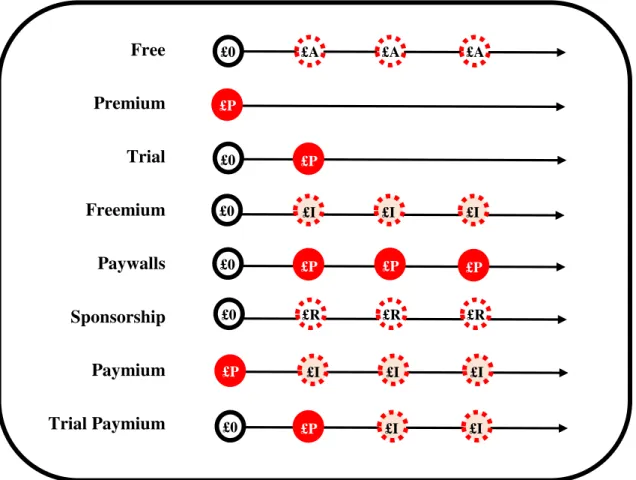
2.3. Monetization Model
The monetization model is the turning point from a great idea to a successful business.
items; to more complex models as (v) paywalls, auto recurrent payment; (vi) sponsorship,
incentivized ads; (vii) paymium, pay per download plus in-app purchase; or (viii) trial paymium, upgrade to paymium (Google 2012; Localytics, 2014).
Choosing the right model is a difficult task: a wrong choice can be the difference between
financial success and a costly app (even if it succeeds on building a large user base). Therefore, a short analysis was performed to each of monetization models (see Appendix
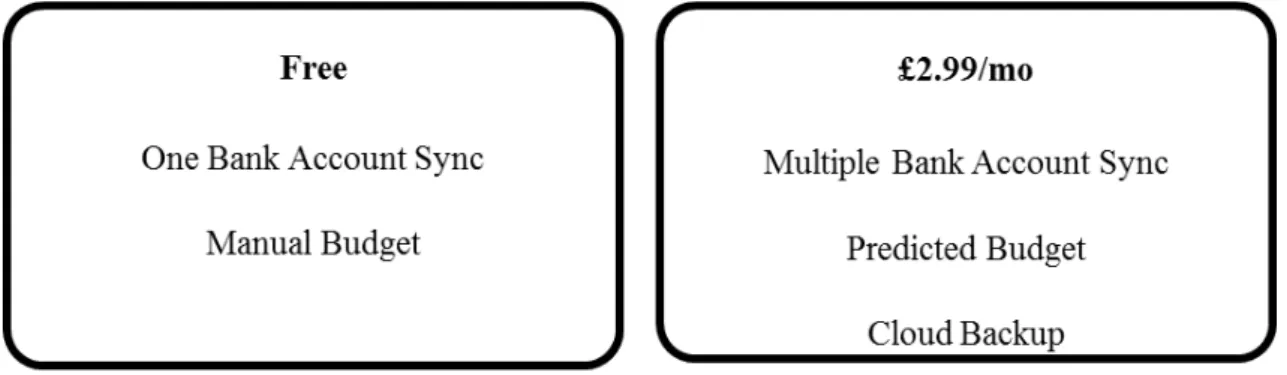
8). Following a theoretical review and analysing the willingness to pay survey conducted (Appendix 1.4), the conclusion was that paywalls is the monetization model that best fits to the product characteristics and Novabase resources. Paywalls model gives to users the
ability to run the basic version as free and requiring a monthly fee of £2.99 to give access to full service. See finzzy pricing package on Appendix 9.
2.4. Competitive advantage
Porter's generic strategies describe how a company pursues a competitive advantage for a product across its chosen market scope. There are three potentially successful generic strategic approaches to outperforming other firms in an industry: (i) overall cost leadership,
(ii) product differentiation and (iii) focus on the niche market (Porter, 1998). To analyse the competitive advantage of a product is interesting to approach the value chain concept
described by Porter (1985). Porter’s value chain is described as a set of activities that a
firm operate in order to deliver a valuable product. The concept of finding the key organization resource that drive the success, can be slightly adapted to analyse the key
feature or particularity that positively differentiate the product in a way to be succeeded in the market. Having a more dynamic view, to leverage the strengths and opportunities and
In the case of the type of product in analysis, it’s clear that the strategy chosen is
differentiation. By definition, differentiation requires a product that outperforms rival brands in the provision of a feature(s), such that it faces reduced sensitivity for other
features (Sharp et al, 2001). The product real value is, indubitably, the mix of smart technologies that supports finzzy to offer a superior quality personal financial advisory. It is also important to foresee the strategies to leverage the current situation into a long term
competitive advantage. Running a TOWS matrix (Appendix 10) it is clear that (i) the mix of smart technology used in finzzy keep up with market trends, leveraging the product in
the market; (ii) the competition forces to need of highlight the differentiator in the message; (iii) the dependence on UK market should led to diversification by entry in other markets; and (iv) the challenge of building a brand can be overcome by buying an established
competitor brand.
3.
Objectives
The previous topics brought to this study a depth analysis on the current market situation and the product to be launch in the near future. Therefore, before strategize the launch
strategy it is necessary to define the goals and objectives. The definition of goals and objectives create the basis on what strategy has to be achieved. The approach for defining the objectives focuses on two different levels: (i) broader goals as mission and vision for
the product, and (ii) detailed objectives.
3.1. Mission & Vision
demonstrate some Corporate Social Responsibility to build connection to community,
while giving direction for the organization. On the other hand, vision statement is more product oriented, setting the major goals for a middle-long term4 success of the product in
the market.
Applying to the case study, there is a strong correlation between the product and the company vision, which is: Make life simpler and happier for users, through finzzy. The
vision intend to transmit the idea of finzzy becoming part of the customers day-to-day life, by playing a role in improving their financial healthy, changing the way people relate with their finances. The finzzy mission statement is: In two years’ time, finzzy will reach the
leading mobile app on the personal financial tools available in the market, recognized by its usability and quality. Novabase clearly pursue the ambition to be market leader in the
industry in the near future by offering an outstanding service.
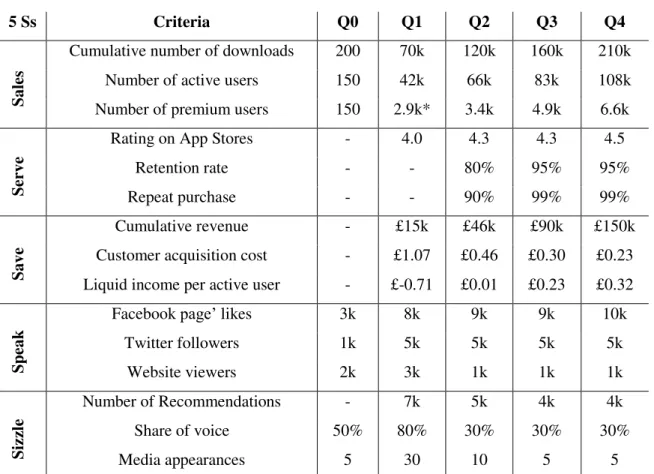
3.2. 5 Ss Objectives
To cover all the relevant areas of product management, considering the business side as opposite to the engineering side, the 5 Ss objective framework created by Paul Smith
(2014) allow us to easily define the areas to focus on when it is needed to define the objectives. The 5 Ss stand for (i) Sells, reflecting the sales goals, (ii) Serve, approach the
quality of product delivered, (iii) Save, addressing the financial side, (iv) Speak, setting objectives related to customer relation, and (v) Sizzle, linked to brand awareness. In the process of creation objectives, is important to ensure that each objective follow the
SMART methodology, creating a Specific goal translated in a Measurable target that is realistic to be Attainable, Relevant for the matter and Timed, creating urgency on
accomplish in a certain time-bound (Doran, 1981). Finally, when it comes to customer
related objectives, is important to use the RACE framework that stands for Reach, Act, Convert and Engage (Smart Insight, 2013), as a mind-set to cover all the customer life
cycle from awareness to engagement with the product.
Applying the suggested framework to define the objectives for finzzy, the main objectives for each Ss were fully addressed in Appendix 11. In a summarized form, it is expected to
have 108k of active users at the end of year one, with about £149k of revenue, being the product rating up to 4.5 and driving 20k of recommendations by users.
4.
Strategy
To build a successful strategy is required the ability to see the big picture. In fact, the
strategy is the smallest but the most difficult part of a plan. The strategy topic will give the response on how to exploit the market opportunity found in the Situation with the Product defined and achieving the Objectives planned. For create a crystal clear strategy, it is
recommended to tackle a nine key components framework. Strategy will be structure at two different levels, first STOPPP to build a strategy for the business, and SITE, more
connected to launch strategy (Smith, 2014). However, some of the key components can overlap the previews analysis, thus, the adoption of all the components should be analysed for each case.
that, here, the recap of some information can be useful, but however, in some other cases,
it may makes sense to not use some of the elements presented in these frameworks.
4.1. STOPPP
On the top level of strategy, STOPPP, developed from the usual STP process (Lancaster
et al, 1988), stands for Segmentation, Targeting, Objectives, Positioning, Processes and Partners. This methodology wants to deliver a good overview on how select the market and adequate the resources to meet the market. Segmentation refers to the process of
identify bases for divide the market into segments and determine important characteristics. Market Targeting is the evaluation of the potential and commercial attractiveness of the segments. Objectives will be a double check on what objectives the strategy should be
committed to achieve. Product Positioning is related to how it wants to be positioned (or perceived) in the minds of the target, and by definition, the positioning is connected to the
product’ differentiator in the market. The launch of a new product will always introduce a
new approach, system, or even, new ways of thinking. Whereby, Process plays a relevant role on the overall strategy. Partners can introduce, strengthen or reduce the overall
strategy, on the edge, the success or failure can be the reflex of decisions related to partnerships.
Implementing the framework for finzzy, it easy to detect that some of the elements were already covered in the previews topic. The relevant segments (College Students, SALA & DINKs, and DEWKs) as well as the main peculiarities of each one were developed in the
customer insights (see topic 1.1.1.). In the same way, detailing the “why the targeting need” for this type of product and the evaluation of the commercial attractiveness for these
life simpler and happier for users at the same time as achieving 1.8k of paid users by the
end of year one, recording about £47k of revenue (see topic 3.). Related to positioning, on Product Analysis was clearly defined that superior quality services must be provided as the
main differentiator (see topic 2.4.). Regarding processes, the main challenge is dealing with B2C channel (since Novabase, at this time, just work in a B2B channel). Thus, processes related with (i) customer experience manager, (ii) social media management,
and (iii) brand and communication on B2C channel need to be implemented. As was analysed in the product design, finzzy is strongly dependent on a third party for gathering
bank information, so, this partner plays a major role in the product strategy. It is also important to stand out the interest in develop some partnerships with finance bloggers to deal with the social media’ content creation to support the app.
4.2. SITE
On a lower level, to strategize how the company will behave in the market, the SITE framework aims to determine the Sequences of different stages in approach the market, highlighting the Integration of customer data, the high level Tactical tools or channels used,
and the Engagement strategy on which sales boosts through first adopters.
The launch of finzzy will be taken in three distinctive phases: (i) concept, defined as the
stage which takes place until an alpha version is distributed, and the stage’ goal is to build a product, and to create buzz about the product; (ii) alpha version, representing the period with product available for a selected group of people for testing purposes: the goals at this
stage are to fix product flaws and create a waiting list of users; and (iii) product release is when finzzy is available in the market and this stage is characterized by the efforts in
launch by building a waiting list, witch are (i) the survey developed for this study, and (ii)
the finzzy website. On tactic tools, the launch strategy was planned across different stages (Sequences stages) and for that, the communication mix crosses its goals along the plan
from building awareness to customer acquisition to customer retention. The different communication goals require to use different mix of communication that will be specifically build further on (see topic 5.2.). Regarding the Engagement strategy, in the
beginning, the engagement it will be driven by content related with personal finances sharing in finzzy’ networks, and at a later phase, the app by itself, by playing a useful role
in user daily life, creating a strong ongoing engagement with active users.
5.
Tactics
“Strategy without tactics is the slowest route to victory” – Sun Tzu. While strategy paints
the bigger picture and ensures everything moves in the right direction, tactics are simply the details of strategy. A clear strategy definition makes tactical decisions much easier.
This topic will cover the 8 P’s of Marketing Mix and, by being focused on launching an
app, it will be delivered a stronger analysis on the communication mix.
5.1. 8 P’s of Marketing Mix
The marketing mix is simple by definition. It is a framework that aims to put the right
product, at the right time, and at the right price. The challenge is to master every aspect of the business to build a strong marketing mix. Marketing mix is usually associated with the
four P’s (price, product, promotion, and place) presented by McCarthy and Jerome (1924).
services. In digital markets, an eight P, Partners is often recommended to boost reach
online (Chaffey et al, 2005).
The main highlights related to finzzy’ marketing mix (Appendix 12) are: (i) the promotional price campaign based on referrals released together with product release; (ii) the trademark
finzzy with the reference to “finzzy makes your personal finances easy”; (iii) apple store and play store are the distributors channels for finzzy; and (iv) customer service, social
media, branding and communication in B2C channel are the main skills required to prepare Novabase to successfully launch finzzy.
5.2. Communication Mix
Designing the right marketing mix involves the eight P’s designed above. However, when
building a launch strategy it is crucial to have an in-depth look on promotion. Also known as Tactical Tools, communication mix refers to specific methods used to promote the brand or its products to targeted customers. Traditionally, presented as a mix of four elements: Advertising, Publicity (or Public Relation), Direct Marketing (or sales force), and Sales Promotion (Mullin, 2010), it was added Sponsorship, Exhibitions, Direct Mail, Retail Store, Word of Mouth, and Packaging, to approach a complete scope (Smith, 2014). A new wave in communication include Social Media as a major tactic tool. For a better understanding the different tactic tools, see Appendix 13. Knowing how good each tactic is at moving customers through various stages of lifetime buying process (Appendix 14), it is important to select the right target, goals and message that fit best each tool to maximize communication outcome.
tools that match to different the communication goals. The main conclusions on the communication mix plan (Appendix 15) are (i) the concept phase is fully focused in creating awareness thought public relations and presence in social media; (ii) the alpha version stage is focus in build a community by investing in paid ad, presence in exhibitions and using social media to start building relationship with users; (iii) first quarter after product release will be the focused in exponentially grow the user base, using a mix of communication focused in paid ad, store optimization, world of mouth and promotion; and (iv) following quarters in product release phase, the marketing focus start to be on building post-purchase relationship and leverage the word of mouth.
6.
Actions
“Everything degenerates into work” -- Peter Drucker. Strategy summarises and gives
To create the action plan for finzzy, at this stage, it were created main tools to deliver the overall launch plan. Mini plans for two key systems for finzzy’ success were develop (i) to structure the referral campaign (Appendix 16.1), and (ii) to boost Facebook visibility and enlarge the waiting list for finzzy through a Facebook ad campaign (Appendix 16.2). On the tactics topic was described the potential on building partnership with bloggers for content creation. Following that, it was develop a content marketing creation guidelines (Appendix 17) to clarify these partnerships. Social media guidelines were structured (Appendix 18) to effectively approach to a major communication channel. Also connected with social media, a checklist was develop to ensure that LinkedIn in not overlooked (Appendix 19). To conclude, it was draw a Gantt chart that resume the main actions in the first months of finzzy (Appendix 20).
7.
Control
Any plan needs to include control systems that let you know whether the planned objectives are on target and can be achieved. A large multi-year control plan can give to the board useful information about the success of the initiative and highlights improvement
points. This control plan addresses (i) the objectives to measure, (ii) the product that is delivered to customers, (iii) the frequency of reporting, and (iv) the process of reporting
and actions to work upon feedback.
Based on the PDCA methodology5, control has a huge impact on the long term success, ensuring a continuous improvement process. The controlling process is well defined by
International Standard Organization (ISO, 2008) on its standards for product realization.
This process is develop in three distinctive phases (review, verification, and validation) to
ensure full control on the quality delivered. Review phase stands for the revision of the requirements stablished for the product, and the detection and fix of fails on meet the
requirements. This phase ensures that the organization has the ability to deliver a quality product in accordance with the defined requirements. Records may be established to provide evidence of conformity to requirements. Verification works upon these evidences
to check if the set of objectives defined have been achieved and defined the necessary actions to overcome any fails detected. In the Validation stage, the organization may
confirm the processes related to product realization where outputs cannot be verified by subsequent monitoring or measurement and, as a consequence, deficiencies become apparent only after the product is in use or the service has been delivered.
Applying the ISO methodology in controlling, it is recommended (i) run the review-verification-validation process before implement the plan, to evaluate the capability to meet the requirements; (ii) control and monitoring the implementation of planned actions
and tracking the objectives defined; and (iii) annually review the full SPOSTAC plan to ensure that the right market strategy is adopted. To conclude, the Control phase is not the
end in a process but the layer that allow the manager to measure the level of success and act upon the Control output to ensure continuous improvement.
To adapt on finzzy’ launch strategy, the main focus should be on (i) establish the responsible for the control processes, (ii) define the frequency if reporting, and (iii) set the process of reporting and actions. By developing the SPOSTAC for finzzy, it was defined
iv. Conclusions
The importance of this study relies on the necessity to build a system that effectively and
efficiently frames a business side of a launch strategy for an app on financial services solutions. Facing this challenge, it was analysed multiple frameworks and planning tools
to build the most suitable one for the market’ specifications and app provider’ characteristics.
It was structured a SPOSTAC planning model. This stands for a framework that segment each field of information in distinctive pieces, to ensure a complete and efficient analysis. Thus, SPOSTAC planning model stands out as a complete framework to think, plan and
prepare an app provider to launch its app.
Regarding the SPOSTAC architecture, it is framed in seven distinct phases: (i) Situation
that is further divided in Customer Insight, Market Trends and Competitive Analysis and the goal is understanding the market and find market opportunities; (ii) Product with the goal of build and define a competitive product, it is segmented on drivers and inhibitors on
use intention in the category, product design, monetization model and the emerged competitive advantage; (iii) Objectives, stating the Mission and Vision as well as
developing KPIs following 5 Ss Objectives framework to define the product’ objectives;
(iv) Strategy, using STOPPP and SITE helping the manager in designing a suitable strategy; (v) Tactics that use 8 P’s of Marketing Mix and Communication mix to
breakdown the strategy in small pieces of strategy; (vi) Action to define the implementation in a lower level by structure mini action planes, guidelines, checklists,
defined are achieved and the continuous improvement in product and market approach (see
Figure 3).
Figure 3: SPOSTAC planning model
Despite of this, the SPOSTAC planning model faced a few limitations. Firstly, this project was build having finances apps as the ultimately goal and consequently, when it is used to different product, the intrinsic product’ characteristics need to be tackle. The diversity of
products creates a need to multiple distinct approaches to the market and the consequently necessity to take different applications of SPOSTAC. Secondly, the work project
timeframe restrict the ability to test this framework on the market. Thus, it cannot be proved that by using this model planning (instead of different one) for an app launch, will leads to better results to app provided.
Finally, it is relevant to emphasize the application of SOSTAC to finnzy that allowed to strengthen the framework created, as well as it was important to demonstrate the usability,
v. References
Accountz. 2011. “How college students relate to finances.” February 16. Bain & Co.. 2005. “Closing the delivery gap.” 3.
BNY Mellon. 2014. “The Generation Game.” September, 8-10.
Booms, Bernard, and Mary Bitner. 1981. Marketing Strategies and Organization Structures for Service Firms. Chicago: American Marketing Association.
Chaffey, Dave, and Paul Smith. 2005. Emarketing Excellence. Oxford: Butterworth-Heinemann.
Deloitte. 2009. “Insuring the Catalyst-Customer: Generation Y and the Insurance
Industry.” March.
Deloitte. 2014. “2015 Banking Outlook: Boosting profitability amidst new challenges.”
10-12.
Doran, George. 1981. "There's a S.M.A.R.T. way to write management's goals and objectives." Management Review, 70(11): 35-36.
EY. 2014. “EY Global Consumer Banking Survey 2014: Winning through customer
experience.” 12-34.
Forrester. 2015. “Follow Best Practices To Encourage Digital Money Management Use”
February 3.
Gartner. 2012. “PFM is Everywhere” April 10.
Gartner. 2014a. “Cool Vendors in Smart Machines” April 11, 2-6. Gartner. 2014b. “Hype Cycle for Smart Machines” July 18, 3-31. Google. 2012. “Monetizing Android Apps” 11-35.
Howe, Neil, and William Strauss. 1992. Generations: The History of America’s Future, 1584 to 2069. Charlotte: Quill.
ISO. 2008. ISO 9001:2008: Quality management systems - Requirements. Geneva: ISO. King, Brett. 2010. Bank 2.0. New York: Marshall Cavendish Reference.
King, Brett. 2012. Bank 3.0. Hoboken: Wiley.
Localytics. 2014. App Monetization: 6 Bankable Business Models That Help Mobile Apps Make Money. http://info.localytics.com/blog/app-monetization-6-bankable-business-models-that-help-mobile-apps-make-money (accessed April 22, 2015).
Mapa. 2014. “PFM Insight Series: Will Big Data projects help put PFM centre stage?”
June, 5-11.
McCarthy, Jerome. 1964. Basic Marketing: A Managerial Approach. Illinois: Irwin. Mullin, Roddy. 2010. Sales Promotion: How to create, implement and integrate campaigns that really work. London: Kogan Page
Novantas. 2014. “BankChoice Monitor.” May.
Office for National Statistics. 2015. UK National Population Projections. www.ons.gov.uk/ons/interactive/uk-national-population-projections---dvc3/ (accessed March 16, 2015).
Oracle. 2010. “Are Banks Ready for the Next Generation Customer?” September, 9-17. Porter, Michael. 1985. Competitive Advantage: Creating and Sustaining Superior Performance. New York: The Free Press.
Porter, Michael. 1998. Competitive Strategy. New York: The Free Press. PwC. 2014. “Retail Banking 2020 Evolution or Revolution?.” 19-38. Rasiel, Ethan. 1999. The McKinsey Way. Berkshire: McGraw-Hill.
Rogers Yvonne, Helen Sharp, and Jenny Preece. 2002. Interaction Design: Beyond Human-Computer Interaction. New York: John Wiley & Sons.
Smart Insights. 2013. “Digiral marketing strategy –Planning Template” January, 6. Sharp, Byron, and John Dawes. 2001. "What is Differentiation and How Does it Work?" Journal of Marketing Management, 17: 739-759.
Smith, Paul. 2014. SOSTAC®: Guide To Your Perfect Digital Marketing Plan. Sofia: Perseus Design.
Weihrich, Heinz. 1982. The TOWS Matrix: A Tool for Situational Analysis. San Francisco: Long Range Planning.
vi. Appendices
Appendix 1 – Survey
Taking into consideration the specificity of the product and the market surrounding, it was decided to develop a survey run in Millennials UK residents, in a way to reinforce
and complement the literature available. In this sense, the survey will help on the process of building a launch strategy, mainly giving insights on (i) customer needs and behaviours, (ii) product acceptance, and (iii) price sensitivity.
The survey structure follows the survey goals, having clearly three main topics: (i) product-market fit (understanding the market needs for personal financial assistance); (ii) usability model, using the Technology Acceptance Model (TAM) and the Innovation
Diffusion Theory (IDT), to understand the main drivers and inhibitors for the product acceptance; and (iii) willingness to pay to understand the consumer intention to pay for
this product.
The following part will explain the sampling and data collection that is shared by the three
survey topics and, following that, describe the conceptual development of each topic, tracked by the results and the main conclusions.
Appendix 1.1 – Sampling and data collection
The survey was made available to the finzzy target (Millennials living in UK) in order to
reinforce the conclusion, allowing no differences in culture, habits and behaviours.
It was collected data during April and May 2015, using an online survey questionnaire.
For this study, the online questionnaire was created via jotform.com. This was operationalised through a modified snowball approach, exploring the network of researchers and their contacts. They were invited through a social network web site to
membership of social network web sites, thereby limiting problems of response bias.
Research carried out by Statista (2014) has shown that among UK Millennials, a vast majority (85%) are active users in social networks.
From the 59 complete responses, 54 were valid answers for the purpose, while the
remaining were annulled as they represent people who do not match the target (UK Millennials). In order to assess the validity of the sample, the questionnaire sought
demographic and behavioural information with regard to respondents’ current use of
mobile phones. Sample characteristics are summarised in Table 1.
Measure Items Frequency Percentage
Gender Male Female 25 29 46.3 53.7
Age 14-17
18-24 25-35 1 35 18 1.9 64.8 33.3
Education Higher Education
Bachelor Master MBA, PhD 20 23 9 2 37.0 42.6 16.7 3.7
Type of mobile phone Smartphone (iOS) Smartphone (AndroidOS) Other 24 27 3 44.4 50.0 5.6 Table 1: Sample characteristics
Appendix 1.2 – Product-Market Fit
The first part of survey address the problem market fit issue. Problem market fit means being in a suitable market with a product that can satisfy that market. This concept rely on the idea: the best team with the best product will fail if the market is not there.
the specific pain points in personal financial management, how they evaluate its ability
on manage their personal finances and how they currently manage these issues.
Appendix 1.2.1 – Conceptual Development
Linked to the Customer insight (topic 1.1.), these questions want to strengthen the knowledge on (i) “why” people need this product and (ii) “how” they buy and use
products in this category. Being more specific; on the “why”, 1-7 scale questions were made to evaluate how they evaluate its ability on manage their personal finances and what
are the main pain points in this issue. On the “how”, it is asked (with close options) if they currently use similar products and how they found a personal financial management solution. Table 1 below shows the questions asked in the survey.
Variable Measurement items
Why A.1. How do you evaluate your ability to manage your personal finances?
A.2. In your daily life, how difficult is it to manage the following issues? A.2.1. Draw a realistic budget;
A.2.2. Stick to a budget planned; A.2.3. Paying a bill on time; A.2.4. Having an emergency fund;
A.2.5. Planning and saving for the very near future; A.2.6. Look to the latest bank transactions;
A.2.7. Knowing the consolidated balance across bank accounts; A.2.8 Manage the home expenditures
A.3. Qualify the impact of the following items if they go over budget: A.3.1. Entertainment & Night out;
A.3.2. Restaurants;
How B.1. How do you manage your finances today?
B.2. Are you actively looking for a product to help you to better manage your money?
B.3. How did you (or, how would you) find a financial management solution? Table 2: Product-Market Fit questions
Appendix 1.2.2 – Results
As it is mentioned above, this survey part is divided in two different goals, evaluating two
different categories of questions (why and how).
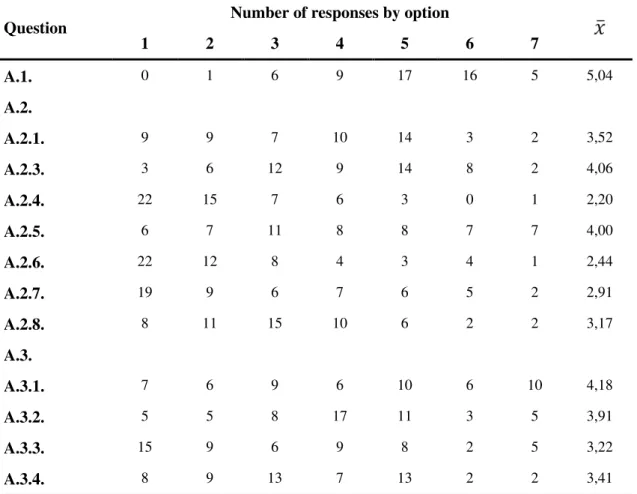
For the Why variable, the collected results are summarized in Table 2.
Question
Number of responses by option
1 2 3 4 5 6 7
A.1. 0 1 6 9 17 16 5 5,04
A.2.
A.2.1. 9 9 7 10 14 3 2 3,52
A.2.3. 3 6 12 9 14 8 2 4,06
A.2.4. 22 15 7 6 3 0 1 2,20
A.2.5. 6 7 11 8 8 7 7 4,00
A.2.6. 22 12 8 4 3 4 1 2,44
A.2.7. 19 9 6 7 6 5 2 2,91
A.2.8. 8 11 15 10 6 2 2 3,17
A.3.
A.3.1. 7 6 9 6 10 6 10 4,18
A.3.2. 5 5 8 17 11 3 5 3,91
A.3.3. 15 9 6 9 8 2 5 3,22
A.3.4. 8 9 13 7 13 2 2 3,41
Table 3: Resume of results for why questions
About how Millennials manage its finances, 33 respondents (61.1% of
respondents) state that they manage it without using any tool; 15 (27.8%) states pen and pencil; 13 (24.1%) claims that are currently using mobile applications; 11
(20.4%) state that they use excel spreadsheet to manage their personal finances; and 7 (13.0%) claim that they pay little attention about managing their finances. It is important to highlight that 40.7% of respondents use more than one tool to
manage their personal finances.
Regarding respondent’ interest for new ways to better manage their money, 31.5%
of respondents (17) state that are actively looking for products to help them in this issue.
Concerning how they find and to whom they ask for help to find a new financial
management solution, individual search lead with search on web (38.9%) and app stores (37,0%) as the most referred option; followed by friends (33,3%) and family (16.7%) references as the second source of information on finding new
solutions; media and social media with media (14.5%), app reviewers (13.0%) and bloggers (5.6%) take the third position; and paid ad takes last position
(3,70%).
Appendix 1.2.3 – Discussion and conclusions
Regarding the self-evaluation on how good is respondent’ ability to manage his/her
personal finances, more than 70% positively evaluate him/her capacity to manage their finances. However, just 9.3% (5 respondents) claim that have fully capacity to manager their personal finances.
On the pain point’ detection, having an emergency fund recorded the higher ranks, having
as hard, followed by stick to budget planned and draw a realistic budget with 44.4% and
35.1% of respondents said that is difficult to hard (rank 5-7) to manage this issues. From this data it is possible to conclude that, for Millennials, the most difficult issues about
managing their money is about budgeting, tracking and saving for emergency (and these should be the key features and the key drivers on communication). On the other hand, paying a bill on time and look to the latest bank transactions is perceived as the easiest
task to do currently, and by that, should not be relevant to highlight on the communication message. Entertainment & Night out and Restaurants are the main categories of spending
when it is looking to over budget reasons. The solution should find ways to help clients to control his/her budget, mainly by paying attention to this categories.
According the data collected, Millennials is not too focused on managing their financials
since 38.9% affirm not having a tool for tracking their finances and 13.0% even claim to pay little attention to their finances. It is important to highlight that about 1 in 4 respondents already use a mobile app to manage their personal finances.
The survey conclude that Millennials are quite independents on finding a new solution to help on managing personal finances, since 64.8% of users claims to use search engine an
app store and just 37.0% say that ask to friends and family for references. Only 3.70% of respondents assume click in paid ads as the way to find new solutions.
To conclude this analysis, is important to highlight a high margin of respondents (31.5%)
Appendix 1.3 – Usability Model
Information technology offers the potential to improve the performance substantially. But
performance gains are often obstructed by users' unwillingness to accept and use available systems (Bowen, 1986). Due to the persistence and importance of this problem,
explaining user acceptance has been a long-standing issue. Although numerous individual, organizational, and technological variables have been investigated, research has been constrained by the shortage of high-quality measures for key determinants of
user acceptance (Davis, 1989).
In this topic, the model developed aims to prove the correlation on the variables to the intention of use and the intensity of this correlation. This information is crucial to create
and adapt the product, as well as to push the product to the market through the most effective message.
Appendix 1.3.1 – Conceptual Development
To understand the impact of a new app, it is important to consider the usability and acceptance of financial management advisor apps by end-users. It is important to consider that some users will embrace these apps while others might not enjoy it (Okumus et al,
2014).
As a result, the current study develop an acceptance model for PFA mobile app solutions.
The basis of the proposed model leans on TAM and the IDT. According to TAM,
behavioural intention is influenced by a user’s attitudes towards a product which in turn
is affected by the perceived usefulness (PU) of the product and its perceived ease of use
(PEOU). People tend to use an application to the extent that they believe it will help them to perform their job better. Reflecting this, emerge the first variable, the PU, whereas
1989). Research has suggested that usefulness and ease of use are significant factors for
the acceptance of mobile services (Koenig-Lewis et al., 2010; Luarn et al, 2005).
To overcome the critics on TAM, about the deterministic approach on the decision to adopt or reject a novel technology and stress, the research has suggested that TAM
typically justify about forty per cent of the variance in usage intention (Venkatesh et al, 2000), the IDT model will refer that the adoption of an innovation is not typically
straightforward process. Relative advantage, observability, trialability, compatibility, and complexity are the best variables in measure the intention of use (Koenig-Lewis et al., 2010). However, studies shown that only relative advantage, complexity, and
compatibility have a significant effect on the adoption rate of innovatory products (Lee
et al., 2003). TAM and IDT complement each other: (i) relative advantage is very closely related to PU, and (ii) complexity refers to PEOU (Koenig-Lewis et al., 2010). Compatibility is a crucial variable to rate the usability of an innovation, that can be defined as the extent to which a new service is consistent with users’ existing values,
beliefs and habits (Chemingui et al, 2013). Researches has shown that compatibly is also (i) lead to higher PEOU as less effort is required to understand how it use, and (ii) boost
PU since a more innovative, and thus more experienced in use of mobile applications, will understand faster the usefulness of a new product (Lin, 2011). The first set of
hypothesis seeks to validate, constructs previously used in the TAM and IDT:
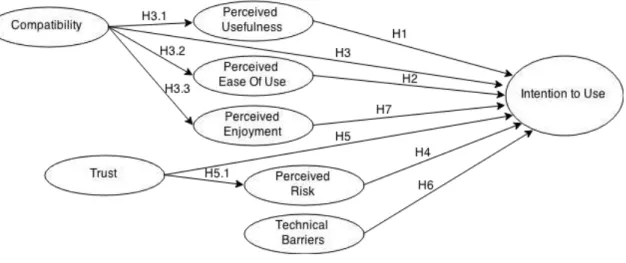
H1. Perceived usefulness has a positive impact on the intention to use PFA app
H2. Perceived ease of use has a positive impact on the intention to use PFA app H3 . Compatibility will lead to higher behavioural intention to use PFA app H3.1. Compatibility positively affects perceived usefulness
This survey seeks to build on a mix of TAM and IDT, adding some variables that have
frequently been cited in the consumer behaviour literature. The concepts of perceived risk and trust are common barriers in the consumer’ path to purchase (Koenig-Lewis et al.,
2010). The decision to use an innovative product can involve a higher level of perceived risk mainly related to security issues and user data privacy, creating a barrier to the
product’ adoption (Gerrard et al, 2006). Rammile and Nel research (2012) notice the
negative impact of perceived risk on intention to use mobile banking. Trust is related to perceived risk because the need for trust only arises in a risk situation. Chemingui and
Iallouna (2013) indicate that trust in web and mobile affects positively the intention to use it. Indeed, trusting beliefs assure the user that the vendor is both able (reducing the perceived risk) and willing (driving the intention of use) to deliver the service. Another
variable to take into account is about technical barriers. Researches highlights that (perceived) technical barriers have negative reflection on intention of use, by the incapability (real or potential) of using the smartphone apps without trouble (Verkasalo
et al, 2010). Perceived enjoyment has recently include as hedonic motivation that drive intention to use new technology (Okumus et al, 2014). Perceived enjoyment is defined as
the extent to which the activity of using a specific system is perceived to be enjoyable in its own right, aside from any performance consequences resulting from system use. Sun and Zhang (2006) found that (i) the acceptance of technologies by consumers is facilitated
by the enjoyment, and (ii) the perceived enjoyment is led by the new app’ consistency
with users’ existing values, beliefs and habits (Compatibility variable). The research
seeks to add the variables of perceived risk, trust, technical barrier and perceived enjoyment to a predictive model through the following hypotheses:
H5. Trust has a positive impact on the intention to use PFA app
H5.1. Trust has a negative impact on the perceived risk
H6. Technical barriers has a negative impact on the intention to use PFA app
H7. Perceived enjoynment has a positive impact on the intention to use PFA app
H3.3. Compatibility has a positive impact on the perceived enjoynment
Identifying the potential constructs and relationships among them, the Figure 4 describes
visually the conceptual model for the intention to use.
Figure 4: Proposal usability model
Next, it will be presented the measurable items that were identified from previous studies.
Table 4 shows the constructs and their measurement items.
Variable Measurement items Adopted from
Perceived usefulness
How important would this financial management solution be for you to better manage your finances?
Davis et al, 1989
An app like this would make the task of managing my money easier
Perceived ease of use
A mobile app is the easiest tool to manage my personal finances
Luarn et al, 2005
Perceived enjoyment
Using an app will make the task of managing my finances more pleasant
Verkasalo et al. 2010
Compatibility This app matches the way I like to manage my finances Lin, 2011
Technical Barriers
Difficult configuration has a negative impact on my usage
Verkasalo et al, 2010
Perceived Risk
I do not feel secure in providing personal information through one app
Rammile a et al, 2012
I do not feel secure giving access to my bank account through an app
Rammile et al, 2012
Trust I would trust the app manufacture to offer a secure system
Chemingui et al, 2013
Intent to use How likely are you to test an app like this that meets your needs?
Lin, 2011
Table 4: Measurable items for usability model
Appendix 1.3.2 – Results
The results’ description starts with exploratory descriptive statistics, regarding to the
intention to use a product in the PFA category. A unidirectional ANOVA test was used
to access that males and females have different levels of intention to use. It was revealed that a significant difference exists between male and female as their intention to use
The proposed model explain 68.4 per cent of the variance in intention to adopt a PFA
solution that is higher than the value of 40 per cent in typical TAM studies (Venkatesh et
al, 2000).
Variable Β p-value Conclusion
H1: Perceived Usefulness → Intention to Use 0.722 0.000 Accepted H2: Perceived Ease of Use → Intention to Use 0.547 0.000 Accepted H3: Compatibility → Intention to Use 0.739 0.000 Accepted H3.1: Compatibility → Perceived Usefulness 0.678 0.000 Accepted H3.2: Compatibility → Perceived Ease of Use 0.531 0.000 Accepted H3.3: Compatibility → Perceived Enjoyment 0.691 0.000 Accepted H4: Perceived Risk → Intention to Use -0.423 0.001 Accepted
H5: Trust → Intention to Use 0.569 0.000 Accepted
H5.1: Trust → Perceived Risk -0.482 0.000 Accepted H6: Technical Barrier → Intention to Use -0.084 0.544 Rejected H7: Perceived Enjoyment → Intention to Use 0.658 0.000 Accepted Table 5: Results of hypothesis testing
From the Table 5, it can be conclude that compatibility had a strong and significant effect on intention to adopt the application (β=0.739, p≤0.001). Other significant drivers for the
intention to use a PFA solution are perceived usefulness (β=0.722, p≤0.001), perceived enjoyment (β=0.658, p≤0.001), trust (β=0.569, p≤0.001), and perceived ease of use (β=0.547, p≤0.001). As inhibitor to the likelihood of use a PFA solution, perceived risk
had a significant effect (β= -0.423, p≤0.001). These results are in line with previous research referred on conceptual development.
perceived ease of use (β=0.531, p≤0.001) and perceived enjoyment (β=0.691, p≤0.001).
Therefore, people who assess PFA as fitting in with their lifestyle and find it a suitable solution are also likely to find it as a useful service, with is easy to use and an enjoyable
service. Trust has a significant effect on perceived risk (β= -0.482, p≤0.001). This means that people who demonstrate trust on the app manufacture identify less overall risk in using the solution.
This paper could not prove that technical barriers have a significant direct effect on
respondents’ intention to adopt PFA solutions. By the fact that this survey have been done
to Millennials, this result can be partly connected to the depth adoption from the
respondents.
Note: * p≤0.005; ** p≤0.001; dotter line denotes non-significant relationship
Figure 5: Standardised theoretical path coefficients
Appendix 1.3.2 – Discussion and conclusions
The results of this study gave insights for researchers and practitioners. For researchers,
this study provides a basis for further refinement of models of consumer adoption in similar products. Understanding the key drivers and inhibitors addressed in the proposed
In terms of academic theory development, the proposed model explained 68.4 per cent of
the variance in intention to adopt PFA solutions, which is higher than 40 per cent, usually found in typical TAM studies (Venkatesh et al, 2000).
This study has given new insights to managers who are responsible for design and develop
a PFA solution. In terms of behavioural and demographic data, the study has identified that genre have no significant influence on the intention to adopt a FPA mobile app. App
providers should focus themselves more on managing belief formation of consumers than on directly influencing behavioural intentions. Then, these efforts on internal psychological processes may result in the intended behaviour. They must educate
consumers about the usefulness, convenience, enjoyment and advantages of personal financial advisor solution. Significant effects of compatibility on perceived usefulness,
perceived ease of use and perceived enjoyment have been observed. The fact that compatibility had significant direct and indirect effect on intention to adopt the PFA solution leads to the need to design a service that it is compatible with UK Millennials’
life-style.
App providers may seek to reduce the perceived risk, since this variable emerged as
having a significant negative effect on intention to adopt. For example, by offering specific service guarantees the app provider protects users from harmful consequences of
service failure.