ORIGINAL ARTICLE
Lifetime shift work exposure: association with
anthropometry, body composition, blood pressure,
glucose and heart rate variability
Breno Bernardes Souza,
1Nayara Mussi Monteze,
2Fernando Luiz Pereira de Oliveira,
3José Magalhães de Oliveira,
4Silvia Nascimento de Freitas,
2Raimundo Marques do Nascimento Neto,
1Maria Lilian Sales,
5Gabriela Guerra Leal Souza
61School of Medicine, Federal
University of Ouro Preto, Ouro Preto, Brazil
2
School of Nutrition, Federal University of Ouro Preto, Ouro Preto, Brazil
3Department of Statistics,
Federal University of Ouro Preto, Ouro Preto, Brazil 4
Institute of Psychiatry, Federal University of Rio de Janeiro, Rio de Janeiro, Brazil 5São Paulo State Cancer
Institute, São Paulo, Brazil 6Department of Biological
Sciences, Federal University of Ouro Preto, Ouro Preto, Brazil
Correspondence to Dr Gabriela Guerra Leal Souza, Departamento de Ciências Biológicas, Universidade Federal de Ouro Preto, Instituto de Ciências Exatas e Biológicas, Departamento de Ciências Biológicas, Campus Morro do Cruzeiro, s/n, Ouro Preto/MG 35400-000, Brasil; [email protected]
Received 27 June 2014 Revised 15 November 2014 Accepted 8 December 2014 Published Online First 24 December 2014
To cite:Bernardes Souza B, Mussi Monteze N, Pereira de Oliveira FL,et al.Occup Environ Med2015;72: 208–215.
ABSTRACT
Objective To evaluate the association between lifetime exposure to shift work and blood pressure, fasting glucose (FG), anthropometric variables, body composition and heart rate variability (HRV).
Methods Male shift workers (N=438) were evaluated using principal component (PC) analysis. The variables used were: weight, body mass index (BMI), waist circumference (WC), neck circumference (NC), hip circumference (HC), hip ratio (WHR), waist-to-height ratio (WHtR), body fat mass (BFKg), body fat percentage (BF%), visceral fat area (VFA), FG, systolic (SBP) and diastolic blood pressure (DBP), and HRV variables. ECG was performed, extracting heart rate (HR), root mean square of the successive differences (RMSSD), high frequency (HF), low frequency (LF) and the LF/HF ratio. Using linear regression models, the lifetime shift work exposure was associated with each PC.
Results Five PCs were obtained, which accounted for 79.6% of the total variation of the data. PC1 (weight, BMI, WC, NC, HC, WHR, WHtR, BFKg, BF% and VFA) was designated as body obesity; PC2 (HF, RMSSD and LF) as good cardiac regulation; PC3 (SBP and DBP) as blood pressure; PC4 (LF/HF ratio and HR) as bad cardiac regulation and PC5 (WHR and FG) as insulin resistance. After age adjustment, the regression analysis showed that lifetime shift work was negatively associated with PC2 and positively associated with PC3.
Conclusions The association of lifetime shift work exposure with PC2 and PC3 suggests that shift work promotes unfavourable changes in autonomic cardiac control related to a decrease in parasympathetic modulation and an increase in blood pressure.
INTRODUCTION
Over the past two decades, occupational conditions have emerged as likely risk factors for cardiovascu-lar diseases (CVD).1 Shift work has been high-lighted among these conditions.1 2Although some
studies do not support the association between shift work and cardiovascular morbidity and mor-tality,3 4 several studies convincingly indicate the existence of this causal relationship and even suggest the potential physiopathological mechan-isms involved.1 5
Working in shifts, according to International Labour Office (ILO),6 is defined as a “method of organisation of working time in which workers succeed one another at the workplace so that the establishment can operate longer than the hours of work of individual workers” and can be classified intofixed shift (working time can be organised in two or three shifts: the early, late and night shifts) or rotating shift (workers may be assigned to work shifts that vary regularly over time). All of the dif-ferent pathways explaining the connection between working in shifts and CVD share a common primary element: desynchronisation of circadian rhythms.5 7 This desynchronisation would impair the daily intracellular and extracellular physio-logical variations of the cardiovascular system, leading to a reduced ability of this system to adapt to external stimuli, with a consequent increase in tissue damage and an increased risk of CVD.5 In addition to physiological changes, some authors believe that circadian stress may lead to behavioural (eg, irregular eating, physical inactivity) and psy-chosocial (eg, working time incompatible with normal social life) changes. These different factors
What this paper adds
▸ Shift work has been inconsistently associated
with cardiovascular risk factors.
▸ Using principal component analysis, we
obtainedfive principal components, which accounted for 79.6% of the total variation of the data, and grouped the measured variables into components of important biological value.
▸ Our results showed associations between
lifetime shift work and cardiovascular risk factors, suggesting that shift work promotes unfavourable changes to autonomic cardiac control that are related to a decrease in parasympathetic modulation and an increase in blood pressure.
▸ It is necessary to determine effective strategies
for health screening and promotion among shift workers, which represent an important operating mode of modern society.
may be intercorrelated and determine, directly or indirectly, a worse cardiovascular condition in shift workers.7 8
Hypertension, obesity, diabetes mellitus type 2 and cardiac auto-nomic dysfunction have been suggested as important members of this not fully elucidated physiopathological model that culmi-nates in CVD due to circadian stress.7 9 10
The estimation of heart rate variability (HRV) using ECG is a non-invasive method for assessing cardiac autonomic regula-tion.11–13HRV has important sympathetic and parasympathetic
components, and the reduction of the latter has been associated with a worse general health status and greater cardiovascular morbidity and mortality.14 15 Furthermore, a decrease in vagal
cardiac function accompanies and precedes the development of several risk factors, and high vagal activity is therefore a pre-dictor of good health and good autonomic regulation.15 16 Several studies have associated shift work with a reduced global HRV,2 11 17–20indicating the existence of a sympathetic
prepon-derance that is detrimental to parasympathetic activity in this population. These unfavourable autonomic changes may be explained by a close association between the circadian clock and cardiovascular regulation because there are projections from the suprachiasmatic nucleus to the autonomic subdivision of the paraventricular nucleus of the hypothalamus.21 Moreover, drowsiness and inadequate sleep, common experiences among shift workers,7 are known to activate the sympathetic nervous system, leading to an increase in blood pressure and heart rate (HR),22which may be a physiopathological explanation for the association between hypertension and shift work reported in recent studies.5 23 24
In relation to obesity, elevated body mass index (BMI),25–27
elevated waist-to-hip ratio (WHR)25 26 28and elevated body fat mass in kilograms (BFKg)29 are commonfindings among shift
workers. These anthropometric and body composition changes are risk factors for changes in glycaemic metabolism30and may
mediate the relationship between shift work and diabetes melli-tus type 2 because greater incidences of this disease are found in these workers than in those who do not work in shifts.31 32
However, there are a few studies of which results do not cor-roborate the association between shift work and alterations in glycaemia,27 33 34blood pressure,7 27 34–36 anthropometry and
body composition,33 35and HRV.37 38In view of this inconsist-ency in the literature, this study was designed to evaluate the association between lifetime exposure to shift work and blood pressure, glucose levels, anthropometric variables, body com-position and HRV. This study has some relevant points: the sample homogeneity (Brazilian, male, rotating shift, mine workers), multiple variables collected on the same sample and a principal component analysis (PCA) approach. PCA is a classical multivariate exploratory tool because it highlights the common variation between variables, allowing inferences about the potential biological meaning of associations between them without pre-establishing hypotheses on the cause–effect relationships.
METHODS
Study design/population
A cross-sectional study was performed with 438 adult Brazilian men, aged between 20 and 55 years, who work as operators of iron ore extraction machinery in four mines owned by the same mining company located in the Inconfidentes region (Minas Gerais, Brazil). The work regimen consisted of rotating shifts (alternating shifts), with 6 h of work followed by 12 h of rest. Each worker alternates between shifts and time off, and for every four shifts of work there is a 36 h rest period, after which
a new cycle begins. This cycle consisted of four consecutive shifts: 19:00–1:00; 13:00–19:00; 7:00–13:00; 1:00–7:00.
All of the employees had similar environmental and work conditions, that is, they were operators of iron ore extraction machinery working in air-conditioned trucks with protection against noise, water and dust. However, their lifetime shift work (years working in shifts) was different. The procedures were performed in the morning and during the employees’ longer off-duty period; the study was conducted from September 2011 to March 2012.
This study was conducted in accordance with the Declaration of Helsinki and was approved by the Ethics Committee of the local institution. All participants freely signed an informed consent form.
Anthropometric variables
The volunteers’weight, height and circumferences were measured by trained professionals with volunteers in the orthostatic position and wearing light clothing. Waist circumference (WC) was mea-sured at the mid-point between the last costal arch and the iliac crest.39Hip circumference (HC), which was used to calculate the WHR, was measured at the level of the greater trochanter.39Neck circumference (NC) was measured immediately below the laryn-geal prominence.40The WHR and waist-to-height ratio (WHtR) were calculated by dividing WC by HC and by height, respect-ively.39 The BMI was calculated by dividing the body weight by the squared height.39
Body composition variables
The BFkg, the body fat percentage (BF%) and the visceral fat area (VFA) were calculated via segmental tetrapolar bioelectrical impedance using a body composition analyser, InBody model 720 (Biospace Co Ltd Factory, Korea).41
Clinical-laboratorial variables
Blood pressure was measured with an automatic digital sphyg-momanometer, model HEM705CP (Omrom, Japan), in the right arm with the participant in the sitting position after 5 min of rest, three times, with a minimum interval of 1 min between readings.42The three measures of systolic blood pressure (SBP) and diastolic blood pressure (DBP) obtained were computed and then averaged to be used for the statistical analysis. A sample of venous blood was collected for the determination of glucose levels after a 12–14 h fast using the glucose oxidase col-orimetric enzyme method (Bioclin, Brazil).
Heart rate variability
A computer running WinCardio (Micromed, Brazil, V.5.5.1.3) software controlled the data acquisition of the ECG parameters. ECG recordings were collected at a sampling frequency of 1000 Hz and at lead II. An off-line peak detection algorithm (derivative plus threshold) was used to estimatefiducial R-wave points, after which the series was screened by hand and cor-rected for artefacts. Successive R-R intervals were estimated in milliseconds. The cardiac parameters were extracted for 3 min in the supine position:
▸ High frequency (HF), from 0.15 to 0.4 Hz: marker of para-sympathetic activity;43
▸ Low frequency (LF), from 0.04 to 0.15 Hz: possibly corre-lated to sympathetic and parasympathetic activity44or to bar-oreflex sensibility;45
▸ LF/HF ratio: index of the interaction between sympathetic and parasympathetic activity (autonomic balance);44
▸ HR: correlated to increased sympathetic and decreased para-sympathetic activity;44
▸ Root mean square of successive R-R interval differences (RMSSD): marker of parasympathetic activity.43
The data processing followed the recommendations of the Task Force of the European Society of Cardiology and the North American Society of Pacing Electrophysiology.44 Matlab software (KARDIA) was used to analyse cardiac parameters.46
Lifetime shift work
The mining company’s human resources department provided a list of dates (month/year) when its workers were hired. On the day of evaluation, the interviewer verified this information with the worker and asked if he had previous experience in shift work. After this, the number of months between the evaluation date and the real start date of shift work was calculated and the result was divided by 12. In this way, a rational number was obtained to represent the total time (in years) that the worker had performed shift work (lifetime shift work).
Procedure
After the employees arrived at the research laboratory and signed the informed consent form, a medical interview was per-formed to collect information on the use and dosage of medica-tions, as well as to calculate the lifetime shift work. Next, body weight, height, WC, HC, NC, BFkg, BF% and VFA were measured.
Subsequently, an ECG was performed for 3 min in the supine position. Finally, blood pressure was measured and a blood sample was collected for the biochemical determination of gly-caemia. The employees had fasted for 12–14 h.
Statistical analysis
The description of variables was presented as mean (±SD) or median (P25–P75) according to normality as tested by the Shapiro Wilk test. The data were analysed using Statistica V.7.0
(StatSoft Inc) software and R Development Core 164 Team (2013). A p<0.05 was considered statistically significant.
PCA was used to group the 18 variables collected: weight, BMI, WC, NC, HC, WHR, WHtR, BFkg, BF%, VFA, fasting glucose (FG), SBP, DBP, HR, RMSSD, HF, LF and LF/HF ratio. PCA is a statistical multivariate method of which the primary aim is to detect the common variation between the original vari-ables and then condense the data by obtaining other varivari-ables, referred to as principal components (PCs). The PCs obtained are linear combinations of the original variables and each PC is, by definition, not correlatable with another. Thefirst PC (PC1) obtained accumulates most of the total variation between the studied variables, while the next components (PC2, PC3, etc) represent, respectively, less variation. So each new PC will pro-gressively include smaller fractions of the variation, which are expressed by their ‘eigenvalues’. Each PC has one eigenvalue, which is obtained by the sum of the squared correlations between the original independent variables and the respective PC, and this sum represents the fraction of variation assigned to each PC. Although several PCs are obtained with PCA, accord-ing to the Kaiser criterion47 only the PCs whose eigenvalue is greater than 1 should be retained. In our study, a varimax rotation was used to improve the interpretability of the data and the cut-off point for the inclusion of a variable in the PC was estab-lished as variable loading ≥0.45.48 Moreover, the Kaiser-Meyer-Olkin test was used to verify the adequacy of the sample for performing PCA and was considered adequate if≥0.5.
Because the PCs are variables derived from other original variables, each individual included in the study has a score related to each PC. Based on these scores, the relationship between the PCs and lifetime shift work was evaluated using univariate linear regression. Subsequently, to reduce the infl u-ence of age on these associations, an adjustment by age was per-formed to obtain the estimated lifetime shift work for each fixed age. In more detail, first, an adjustment was made to obtain estimated, typical lifetime shift work associated to each fixed age group. We achieved this using a linear regression model. The idea was that because (as it is known) there is a strong correlation between age and lifetime shift work, it would be appropriate to obtain such estimates in a manner that also accounts for this correlation. Therefore, by denoting age and lifetime shift work by Z and Y, respectively, the model adjust-ment that we considered was
b
Y¼b^0þb^1Z;
and estimating the parameters above directly by regression gave us the estimated values Yt, t=23; 35; 45; 55, of Y for each of
our age groups. In the sequence, these values were used in linear regression adjustments of each of the PCs PCj, j=2; 3; 4;
5, in terms of Y. Because the PCjs can be considered
independ-ent, this is adequate, and it is not necessary to consider a multi-variate regression model to satisfactorily estimate the PCj, t of
each PCj in terms of lifetime shift work. Notice then that these
are estimates within each age group. If the regression equations for the PCjin terms of Y are
PCj¼gc0jþgc1jY; j¼2;3;4;5;
we see that our PC estimates are given (with an ad hoc modifi ca-tion in the case of PC3, for which a quadratic model was found to be slightly better) by
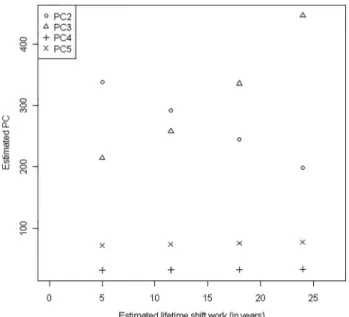
Figure 1 Estimated values of each principal component (PC) for different lifetime shift work (estimated forfixed age). PC2 (circle) represents the cardiac component of good regulation. PC3 (triangle) represents the blood pressure component. PC4 ( plus sign) represents the cardiac component of bad regulation. PC5 (X mark) represents the insulin resistance component.
c
PCj;t¼gc0jþgc1jYbt¼gc0jþgc1j^b0þgc1jb^1t; 8j;t
Generally, these were the values we used in the present work to obtain the results referred to in figure 1 and to proceed with our analysis.
In order to contrast the PCA approach with the ‘standard’
modelling approach, linear regression analyses were applied to examine the relationship between the lifetime shift work and each variable of the PCs previously associated with the respect-ive lifetime.
Finally, our analysis considered the wide range of medications reported49 to be modifiers of HRV. Two different physicians classified the medications used by each worker, and in the event of disagreement between them, a third physician was consulted. Different groups of medicines are known to differentially affect HRV; therefore, to identify the possibility of drug bias, all the analyses were conducted again after excluding workers who were taking medications that could influence the evaluated data.
RESULTS
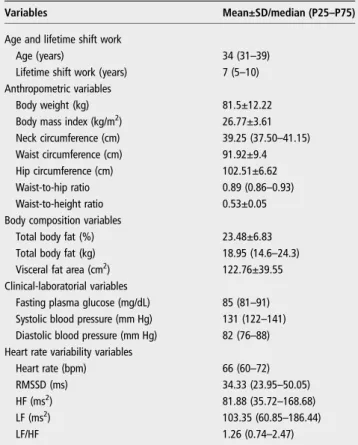
The median age (P25–P75) of the 438 alternating shift workers participating in this study was 34 (31–39) years and the median of lifetime shift work exposure was 7 (5–10) years. The anthropometric, body composition, clinical-laboratorial and HRV variables are shown intable 1.
In the PCA, thefirstfive PCs were retained because they pre-sented eigenvalues≥1.0 (Kaiser criterion).47Together, thesefive components account for 79.6% of the total variation of the data.Table 2shows the loadings related to the variables in each component. For PC1, which accounted for 40.21% of the
variance, 10 variables had loadings greater than the predefined cut-off point, indicating a strong positive association between weight, BMI, WC, NC, HC, WHR, WHtR, BFKg, BF% and VFA. In PC2, three variables (RMSSD, HF and LF) reached the cut-off point in the same direction of variation ( positive load-ings), corresponding to 14.95% of the total variation. Accounting for 10.02% of the total variation, only the pressure variables (SBP and DBP) were included in PC3. Contributing to 7.36% of the variation, PC4 was composed of positive loadings for HR and LF/HF. Finally, PC5 included the variables WHR and FG, accounting for 7.08% of the data variation. Because the analysis performed allows for naming the components according to what they appear to express from a biological point of view, the PCs were respectively named as: body obesity component; cardiac component of good regulation; blood pres-sure component; cardiac component of bad regulation and insulin resistance component. The sampling adequacy was satis-factory for PCA because the Kaiser-Meyer-Olkin test showed an adequacy value of 0.73.
The data from the linear univariate analysis of the association between lifetime shift work and each PC are shown intable 3. Component 2 ( p=0.005) was negatively associated with lifetime shift work, while components 3 ( p=0.023), 4 ( p=0.017) and 5 ( p=0.006) were positively associated with it. After age adjust-ment, the values of each PC were obtained for the different esti-mated lifetime shift work (5, 12, 18 and 24 years) forfixed ages (25, 35, 45 and 55 years old, respectively), which demonstrated that PC2 remained with a definitive negative association with
Table 1 Characteristics of the study population (n=438)
Variables Mean±SD/median (P25–P75)
Age and lifetime shift work
Age (years) 34 (31–39)
Lifetime shift work (years) 7 (5–10)
Anthropometric variables
Body weight (kg) 81.5±12.22
Body mass index (kg/m2) 26.77±3.61
Neck circumference (cm) 39.25 (37.50–41.15)
Waist circumference (cm) 91.92±9.4
Hip circumference (cm) 102.51±6.62
Waist-to-hip ratio 0.89 (0.86–0.93)
Waist-to-height ratio 0.53±0.05
Body composition variables
Total body fat (%) 23.48±6.83
Total body fat (kg) 18.95 (14.6–24.3)
Visceral fat area (cm2) 122.76±39.55
Clinical-laboratorial variables
Fasting plasma glucose (mg/dL) 85 (81–91) Systolic blood pressure (mm Hg) 131 (122–141) Diastolic blood pressure (mm Hg) 82 (76–88) Heart rate variability variables
Heart rate (bpm) 66 (60–72)
RMSSD (ms) 34.33 (23.95–50.05)
HF (ms2) 81.88 (35.72
–168.68)
LF (ms2) 103.35 (60.85
–186.44)
LF/HF 1.26 (0.74–2.47)
HF, power in high-frequency range; LF, power in low-frequency range; LF/HF, ratio LF (ms2)/HF(ms2); RMSSD, root mean square of successive R-R interval differences.
Table 2 Variable loading* matrix and explained variance related to each PC after varimax rotation
PCs
PC1 PC2 PC3 PC4 PC5
Body weight 0.896 −0.059 0.095 −0.049 −0.027
BMI 0.941 −0.047 0.082 0.045 0.063
Neck circumference 0.794 −0.089 0.077 −0.034 0.127
Waist circumference 0.922 −0.051 0.070 0.088 0.251
Hip circumference 0.869 −0.052 0.098 −0.105 −0.204
Waist-to-hip ratio 0.582 −0.027 0.017 0.243 0.590
Waist-to-height ratio 0.870 −0.040 0.053 0.154 0.306
Total body fat (%) 0.830 0.053 0.079 0.082 0.059
Total body fat (kg) 0.940 0.016 0.075 0.037 0.027
Visceral fat area 0.756 −0.053 0.091 0.069 −0.020
Fasting plasma glucose 0.026 −0.032 0.086 −0.094 0.825
Systolic blood pressure 0.153 −0.041 0.927 0.099 0.033
Diastolic blood pressure 0.155 −0.077 0.923 0.044 0.080
Heart rate 0.148 −0.434 0.131 0.456 0.063
RMSSD −0.039 0.906 −0.051 −0.304 −0.010
HF 0.009 0.901 −0.038 −0.191 0.052
LF −0.057 0.903 −0.010 0.207 −0.085
LF/HF 0.009 −0.134 0.071 0.898 −0.052
Proportion of explained variance (%)
40.21 14.95 10.02 7.36 7.08
Cumulative explained variance (%)
40.21 55.16 65.18 72.54 79.62
*Loading denotes the contribution of the variable to each PC. A higher absolute value indicates that the variable has a major influence on the PCs. Bold numbers indicate absolute loadings≥0.45.
BMI, body mass index; HF, power in high-frequency range; LF, power in low-frequency range; LF/HF, ratio LF/HF; PC, principal component; RMSSD, root mean square of successive R-R interval differences.
lifetime shift work and PC3 with a definitive positive association (figure 1).
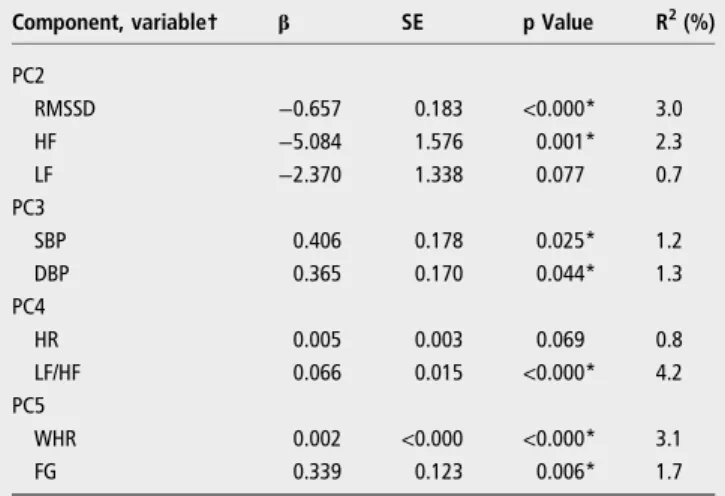
Table 4shows the association between lifetime shift work and each variable of the PCs previously associated with the respect-ive lifetime, allowing a comparison between‘standard’and PCA approaches. In general, the separate variables showed the same pattern of association with lifetime shift work as their PCs, however, the results of LF ( p=0.077) and HR ( p=0.069) were only marginally significant.
Ninety-three of the 438 employees were using some type of medication. Of those 93, 27 were using one of the following groups of medicines, which were not identified as HRV modi-fiers: proton pump inhibitors, corticosteroids, non-steroidal anti-inflammatory drugs, oral anticoagulants and/or statins. The other 66 were using at least one of the following groups, which can potentially influence HRV:49 antihypertensive drugs
(thiazide-type diuretics; calcium channel blockers; ACE inhibi-tors; angiotensin receptor blockers;β-blockers), anticholinergics, β2-agonists, antidepressants, anxiolytics, sedatives/hypnotics, insulin, oral hypoglycaemic agents and/or levothyroxine. After excluding these 66 employees, we repeated the statistical ana-lyses (data not shown) and noted that the significant results found for the total 438 employees remained. This allowed us to
rule out the possibility of drug bias on thefindings reported in this study.
DISCUSSION
The findings reported here point to the existence of five PCs that account for most (79.6%) of the total variation between the studied variables. As PCA groups variables that behave in similar fashion, each PC can be associated with a biological phe-nomenon and thus can be given afictitious name. PC1, named the body obesity component, included the anthropometric and body composition variables (body weight, BMI, WC, HC, NC, WHR, WHtR, BFkg, BF% and VFA). PC2 included the vari-ables HF, RMSSD and LF, and was named the cardiac compo-nent of good regulation. PC3 included the variables SBP and DBP, and was named the blood pressure component. PC4 was designated as the cardiac component of bad regulation, and included LF/HF and HR. Finally, PC5, named the insulin resist-ance component, included WHR and FG. After controlling for the influence of age, lifetime shift work had a definitive negative association with PC2 and a positive association with PC3.
PC1 included all of the anthropometric and body compos-ition variables assessed. These variables are known to be highly intercorrelated,40 indicating that although some are obtained from specific body parts, they can also reflect the individual’s general obesity and vice-versa. That is why component 1 was named the ‘body obesity component’. Component 5, in turn, the‘insulin resistance component’, included only FG and WHR. Thisfinding corroborates recent studies50 51 demonstrating that
WHR is the best anthropometric measure to predict diabetes type 2. Curiously, PC5 did not include VFA, suggesting that FG in shift workers is more associated with WHR than with VFA itself. Thisfinding appears contradictory because WHR is con-sidered a risk factor exactly because it estimates the visceral adipose tissue.26 52However, it should be highlighted that the
quantity of visceral fat for a given WHR can be substantially altered53 54 by individual differences in the quantity of total
body fat and therefore it is possible that, in a given population (eg, shift workers), WHR reflects an ‘adipose balance’ that is more associated with glucose alterations than VFA. There is not sufficient evidence in the literature to prove this hypoth-esis, but there are studies26 55 relating occupational and psy-chosocial factors to a more specific anthropometric change on the WHR.
PC2 included three components of HRV: HF, RMSSD and LF. Different from HF and RMSSD, which are already well established as parasympathetic measures as well as markers of good health and lower cardiovascular morbidity and mortality, 15 16 43 44the origins and clinical significance of LF
are still controversial. This measure has already been indicated to be an index of cardiac sympathetic discharge56and a double
marker: a greater influence of sympathetic and smaller influence of parasympathetic discharge.2 44 Recently, some studies have
provided strong evidence that LF is associated with baroreflex sensitivity; therefore, it is a marker for the proper functioning of this reflex.45 57The present study corroborates the baroreflex thesis because the PCA showed that the LF variable has a strong positive association with HRV measures that are predictors of good health and good regulation.15 16 This strong association
also corroborates a recent review58where LF was argued to be mostly determined by the parasympathetic system. Therefore, PC2 was named the‘cardiac component of good regulation’.
Conversely, PC4 was considered to be the‘cardiac component of bad regulation’because it was comprised of the variables HR and LF/HF ratio, of which high levels have been related to
Table 3 Association between lifetime shift work (in years) and each principal component (PC) using univariate linear regression analyses among 438 shift workers
Component† β SE p Value
PC1 −0.429 0.521 0.411
PC2 −7.315 2.569 0.005*
PC3 0.411 0.022 0.023*
PC4 0.114 0.040 0.017*
PC5 0.281 0.102 0.006*
†Dependent variable.
*p<0.05 was considered statistically significant after univariate linear analyses.
Table 4 Association between lifetime shift work (in years) and variables of the PCs previously associated with the respective lifetime, using linear regression analyses among 438 shift workers
Component, variable† β SE p Value R2(%)
PC2
RMSSD −0.657 0.183 <0.000* 3.0
HF −5.084 1.576 0.001* 2.3 LF −2.370 1.338 0.077 0.7 PC3
SBP 0.406 0.178 0.025* 1.2
DBP 0.365 0.170 0.044* 1.3
PC4
HR 0.005 0.003 0.069 0.8
LF/HF 0.066 0.015 <0.000* 4.2
PC5
WHR 0.002 <0.000 <0.000* 3.1
FG 0.339 0.123 0.006* 1.7
†Dependent variable.
*p<0.05 was considered statistically significant after linear regression analyses. DBP, diastolic blood pressure; FG, fasting glucose; HF, power in high-frequency range; HR, heart rate; LF, power in low-frequency range; LF/HF, ratio LF/HF; PC, principal component; R2, coefficient of determination; RMSSD, root mean square of successive
R-R interval differences; SBP, systolic blood pressure; WHR, waist-to-hip ratio.
several risk factors for the development of CVD.2 59–61
Although there are controversies,62which even include a
discus-sion on the meaning of LF, it is relatively accepted that the LF/ HF ratio reflects the cardiac sympathovagal balance,2 12and an
increase in this ratio indicates sympathetic dominance and a decrease indicates parasympathetic dominance.44 Because the
sympathovagal balance is directly related to HR,59 a positive association between the members of component 4 was expected. Component 3 was named the ‘blood pressure component’
because it presented the variables SBP and DBP.
Using linear regression models, we noted a positive associ-ation between lifetime shift work and the components ‘bad cardiac regulation’, ‘blood pressure’ and ‘insulin resistance’. There was a negative association with the‘cardiac component of good regulation’and no association with the‘body obesity com-ponent’. After a re-analysis considering the influence of age on the associations found, there remained a definitive positive asso-ciation of lifetime shift work with the ‘component blood pres-sure’and a negative association with the‘cardiac component of good regulation’. Therefore, the longer the lifetime exposure to shift work, the higher the blood pressure and the lower the autonomic cardiac regulation. Collectively, thesefindings suggest the occurrence of a gradual worsening of health, particularly cardiovascular health, in long-term shift work.
There is much controversy about the association between shift work and cardiovascular risk factors,1 5 7 but numerous
recent studies reported consistent associations with those reported here.2 9 11 17–20 23 24 33 61In a sample of 360 workers
in alternating shifts, Ha and Park33observed that the longer the lifetime shift work (years), the higher the blood pressure, but they found no association between years of shift work and FG levels and BMI. Additionally, van Amelsvoort et al25 found a positive association between lifetime shift work (years), and BMI and WHR, with a more pronounced effect for WHR. The authors argue that these anthropometric changes are likely because shift work induces eating changes, physical inactivity and alterations in the circadian rhythm of metabolic processes such as digestion and insulin and cortisol secretion.
Regarding the HRV parameters, our group did notfind any studies examining the associations between HRV and lifetime shift work in the literature. However, several other studies indi-cate that these workers have less favourable autonomic cardio-vascular regulation (greater sympathetic modulation and lower parasympathetic modulation) compared with the control group (day shift workers).2 17 19 20 61Wehrenset al61compared shift
workers with daytime workers paired by age, BMI and choles-terol levels, and found lower RMSSD levels and higher LF/HF ratios among shift workers. The authors argue that thisfinding indicates lower parasympathetic modulation and greater sympa-thetic cardiac modulation in shift workers, changes that are both associated with a higher risk of CVD. However, there are studies that did notfind differences in the autonomic cardiovas-cular regulation between shift workers and daytime workers.37 38
Comparing the PCA approach with the analysis shown in table 4 (‘standard’ approach), we can note that although the relationship between lifetime shift work and the individual vari-ables and their PCs were similar, PCA revealed some advantages. First, PCA is a statistical multivariate method of which the primary aim is to detect the common variation between the original variables (without a priori suppositions of the evalu-ator) and then condense the data by obtaining other variables, referred to as PCs. Besides detecting the main source of inher-ent variation among the investigated variables, the PCA
approach allowed us to perform an age adjustment, which would not have been possible in the conventional method because there is a strong association between lifetime shift work and age.
In general, our results corroborate the association between shift work and cardiovascular risk, but some limitations of the study should be noted. First, as the sample is composed of male shift workers with the same work arrangement of alternating shifts, comparisons of gender and shift work specificities ( per-manent or alternating; clockwise or counterclockwise, etc) could not be performed. Second, although the employees had similar environmental and work conditions (they were all opera-tors of iron ore extraction machinery working in air-conditioned trucks with insulation against sound, water and dust), data on behavioural factors (eg, eating habits, physical activity, sleep-wake pattern, smoking) were not collected. This information could be useful in determining potential mediators of the asso-ciations found. It should be emphasised that, considering the current pathophysiological hypotheses to explain the influence of shift work on health status, adjustment for psychosocial and behavioural factors is not appropriate in studies such as ours because they should not be considered confounders, but rather steps in the causal chain. Third, a cross-sectional design is not the best design for establishing the risks associated with lifetime shift work exposure, but without some preliminary identifi ca-tion of transversal associaca-tions, longitudinal studies of the devel-opment of cardiovascular risk factors during a professional life in shifts are unlikely to be undertaken. Fourth, when one inves-tigates the influence of lifetime shift work, age is an important confounder because it is inherently and positively associated with time (years) working in shifts. In our study, an age adjust-ment was performed to reduce the influence of this confound-ing variable. However, as discussed by van Amelsvoort et al,25
there is no way of eliminating this influence completely. Fifth, we did not measure breathing during the ECG recordings. Although it is known that breathing potentially influences the HF variable,2 44 Penttila et al43 demonstrated that RMSSD
values are not affected by the respiratory pattern. In the present study, both parasympathetic variables (HF and RMSSD) appeared in the same PC, and even contributed with almost identical variable loadings; therefore, we can infer that the lack of breathing control most likely did not bias the study results.
CONCLUSION
When the influence of age is diminished, longer lifetime shift work exposure clearly promoted a decrease in the cardiac com-ponent of good regulation (HF, RMSSD and LF) and an increase in the blood pressure component (SBP and DBP). These changes represent a gradual worsening of general health status during a lifetime of shift work, which is a possible explan-ation for the increased risk of CVD in this populexplan-ation. Because shift work constitutes an important operational mode, account-ing for 15% of labour arrangements in the USA and approxi-mately 15–20% in modern society,5 the findings of this study
indicate the need for determining effective strategies for the evaluation and promotion of health among shift workers. These measures may anticipate the diagnosis of health deterioration and ensure early intervention to prevent the development of CVD in this population, which is a population that is essential for the current economic and social challenges of nations worldwide.
Acknowledgements The authors are grateful for the excellent technical assistance of Cristina de Oliveira Lisboa Pereira and Gustavo Henrique de Souza.
Contributors RMNN, MLS and SNF contributed in the conception and design of the study. BBS, NMM, JMO and GGLS compiled the data for analysis and made the analysis plan. JMO monitored the data acquisition of the heart rate variable parameters. FLPO performed the statistical analyses. BBS, NMM, FLPO and GGLS participated in data interpretation. BBS and GGLS drafted the manuscript. All the authors critically reviewed and approved thefinal version of the manuscript. Funding This work was supported by the Federal University of Ouro Preto (UFOP); the National Council for Scientific and Technological Development (CNPq); the Coordination for the Improvement of Higher Education Personnel (CAPES); and the Foundation for Research Support in Minas Gerais (FAPEMIG).
Competing interests None. Patient consent Obtained.
Ethics approval Federal University of Ouro Preto Review Board and Ethics Committee.
Provenance and peer reviewNot commissioned; externally peer reviewed.
REFERENCES
1 Boggild H, Knutsson A. Shift work, risk factors and cardiovascular disease.Scand J Work Environ Health1999;25:85–99.
2 Togo F, Takahashi M. Heart rate variability in occupational health––-a systematic
review.Ind Health2009;47:589–602.
3 Frost P, Kolstad H, Bonde J. Shift work and the risk of ischemic heart disease—a
systematic review of the epidemiologic evidence.Scand J Work Environ Health 2009;35:163–79.
4 Hublin C, Partinen M, Koskenvuo K,et al. Shift-work and cardiovascular disease: a population-based 22-year follow-up study.Eur J Epidemiol2010;25:315–23.
5 Esquirol Y, Perret B, Ruidavets J,et al. Shift work and cardiovascular risk factors: new knowledge from the past decade.Arch Cardiovasc Dis2011;104:636–68.
6 ILO. International Labour Office.Conditions of work and employment programme— shift work. Geneva: International Labour Office, 2004.
7 Puttonen S, Harma M, Hublin C. Shift work and cardiovascular disease—pathways
from circadian stress to morbidity.Scand J Work Environ Health2010;36:96–108.
8 Lowden A, Moreno C, Holmback U,et al. Eating and shift work—effects on habits,
metabolism, and performance.Scand J Work Environ Health2010;36:150–62.
9 Ito H, Nozaki M, Maruyama T,et al. Shift work modifies the circadian patterns of heart rate variability in nurses.Int J Cardiol2001;79:231–6.
10 Karlsson B, Knutsson A, Lindahl B. Is there an association between shift work and having a metabolic syndrome? Results from a population based study of 27,485 people.Occup Environ Med2001;58:747–52.
11 van Amelsvoort L, Schouten E, Maan A,et al. 24-Hour heart rate variability in shift workers: impact of shift schedule.J Occup Health2001;43:32–8.
12 Sztajzel J. Heart rate variability: a noninvasive electrocardiographic method to measure the autonomic nervous system.Swiss Med Wkly2004;134:514–22.
13 Berntson GG, Quigley KS, Lozano D. Cardiovascular psychophysiology. In: Cacioppo JT, Tassinary LG, Berntson GG, eds.Handbook of psychophysiology. Cambridge, UK: Cambridge University Press, 2007:182–210.
14 Tsuji H, Larson M, Venditti F,et al. Impact of reduced heart rate variability on risk for cardiac events—The Framingham Heart Study.Circulation1996;94:2850–5.
15 Thayer J, Lane R. The role of vagal function in the risk for cardiovascular disease and mortality.Biol Psychol2007;74:224–42.
16 Pumprla J, Howorka K, Groves D,et al. Functional assessment of heart rate variability: physiological basis and practical applications.Int J Cardiol 2002;84:1–14.
17 van Amelsvoort L, Schouten E, Maan A,et al. Occupational determinants of heart rate variability.Int Arch Occup Environ Health2000;73:255–62.
18 Su T, Lin L, Baker D,et al. Elevated blood pressure, decreased heart rate variability and incomplete blood pressure recovery after a 12-hour night shift work.J Occup Health2008;50:380–6.
19 Lindholm H, Sinisalo J, Ahlberg J,et al. Attenuation of vagal recovery during sleep and reduction of cortisol/melatonin ratio in late afternoon associate with prolonged daytime sleepiness among media workers with irregular shift work.Am J Ind Med 2012;55:643–9.
20 Yoshizaki T, Kawano Y, Tada Y,et al. Diurnal 24-hour rhythm in ambulatory heart rate variability during the day shift in rotating shift workers.J Biol Rhythms 2013;28:227–36.
21 Scheer F, Ter Horst G, Van der Vliet J,et al. Physiological and anatomic evidence for regulation of the heart by suprachiasmatic nucleus in rats.Am J Physiol Heart Circ Physiol2001;280:H1391–9.
22 Lusardi P, Zoppi A, Preti P,et al. Effects of insufficient sleep on blood pressure in hypertensive patients—a 24-h study.Am J Hypertens1999;12:63–8.
23 Sakata K, Suwazono Y, Harada H,et al. The relationship between shift work and the onset of hypertension in male Japanese workers.J Occup Environ Med 2003;45:1002–6.
24 Suwazono Y, Dochi M, Sakata K,et al. Shift work is a risk factor for increased blood pressure in Japanese men—a 14-year historical cohort study.Hypertension
2008;52:581–6.
25 van Amelsvoort L, Schouten E, Kok F. Duration of shiftwork related to body mass index and waist to hip ratio.Int J Obes Relat Metab Disord1999;23:973–8.
26 Ishizaki M, Morikawa Y, Nakagawa H,et al. The influence of work characteristics on body mass index and waist to hip ratio in Japanese employees.Ind Health 2004;42:41–9.
27 Morikawa Y, Nakagawa H, Miura K,et al. Effect of shift work on body mass index and metabolic parameters.Scand J Work Environ Health 2007;33:45–50.
28 Sookoian S, Gemma C, Gianotti T,et al. Effects of rotating shift work on biomarkers of metabolic syndrome and inflammation.J Intern Med2007;261:285–92.
29 Schiavo-Cardozo D, Lima M, Pareja J,et al. Appetite-regulating hormones from the upper gut: disrupted control of xenin and ghrelin in night workers.Clin Endocrinol (Oxf )2013;79:807–11.
30 Fox K, Despres J, Richard A,et al. Does abdominal obesity have a similar impact on cardiovascular disease and diabetes? A study of 91 246 ambulant patients in 27 European Countries.Eur Heart J2009;30:3055–63.
31 Morikawa Y, Nakagawa H, Miura K,et al. Shift work and the risk of diabetes mellitus among Japanese male factory workers.Scand J Work Environ Health 2005;31:179–83.
32 Suwazono Y, Sakata K, Okubo Y,et al. Long-term longitudinal study on the relationship between alternating shift work and the onset of diabetes mellitus in male Japanese workers.J Occup Environ Med2006;48:455–61.
33 Ha M, Park J. Shiftwork and metabolic risk factors of cardiovascular disease. J Occup Health2005;47:89–95.
34 Biggi N, Consonni D, Galluzzo V,et al. Metabolic syndrome in permanent night workers.Chronobiol Int2008;25:443–54.
35 Romon M, Nuttens M, Fievet C,et al. Increased triglyceride levels in shift workers. Am J Med1992;93:259–62.
36 Sfreddo C, Fuchs S, Merlo A,et al. Shift work is not associated with high blood pressure or prevalence of hypertension.PLoS ONE2010;5.
37 van Amelsvoort L, Schouten E, Maan A,et al. Changes in frequency of premature complexes and heart rate variability related to shift work.Occup Environ Med 2001;58:678–81.
38 Murata K, Yano E, Hashimoto H,et al. Effects of shift work on QTc interval and blood pressure in relation to heart rate variability.Int Arch Occup Environ Health 2005;78:287–92.
39 World Health Organization.Waist circumference and waist-hip ratio: report of a WHO expert consultation, Geneva, 8–11 December 2008. Geneva: World Health Organization, 2011.
40 Ben-Noun L, Sohar E, Laor A. Neck circumference as a simple screening measure for identifying overweight and obese patients.Obes Res2001;9:470–7.
41 Lohman TG.Assessing fat distribution advances in body composition assessment: current issues in exercise science. Champaign, IL: Human Kinetics, 1992:57–63.
42 Chobanian A, Bakris G, Black H,et al. The seventh report of the Joint National Committee on prevention, detection, evaluation, and treatment of high blood pressure—the JNC 7 report.JAMA2003;289:2560–72.
43 Penttila J, Helminen A, Jartti T,et al. Time domain, geometrical and frequency domain analysis of cardiac vagal outflow: effects of various respiratory patterns.Clin Physiol2001;21:365–76.
44 Camm A, Malik M, Bigger J,et al. Heart rate variability—standards of
measurement, physiological interpretation, and clinical use.Circulation 1996;93:1043–65.
45 Goldstein DS, Bentho O, Park MY,et al. Low-frequency power of heart rate variability is not a measure of cardiac sympathetic tone but may be a measure of modulation of cardiac autonomic outflows by baroreflexes.Exp Physiol 2011;96:1255–61.
46 Perakakis P, Joffily M, Taylor M,et al. KARDIA: a Matlab software for the analysis of cardiac interbeat intervals.Comput Methods Programs Biomed2010;98:83–9.
47 Mardia KV, Kent JT, Bibby JM.Multivariate analysis. New York, NY: Academic Press, 1979.
48 Panazzolo D, Sicuro F, Clapauch R,et al. Obesity, metabolic syndrome, impaired fasting glucose, and microvascular dysfunction: a principal component analysis approach.BMC Cardiovasc Disord2012;12:102.
49 Uusitalo A, Vanninen E, Levalahti E,et al. Role of genetic and environmental influences on heart rate variability in middle-aged men.Am J Physiol Heart Circ Physiol2007;293:H1013–22.
50 Cheng C, Ho C, Yang C,et al. Waist-to-hip ratio is a better anthropometric index than body mass index for predicting the risk of type 2 diabetes in Taiwanese population.Nutr Res2010;30:585–93.
51 Xu Z, Qi X, Dahl AK,et al. Waist-to-height ratio is the best indicator for undiagnosed type 2 diabetes.Diabet Med2013;30:e201–7.
52 Baudrand R, Dominguez J, Tabilo C,et al. The estimation of visceral adipose tissue with a body composition monitor predicts the metabolic syndrome.J Hum Nutr Diet 2013;26:154–8.
53 Vanderkooy K, Leenen R, Seidell J,et al. Waist-hip ratio is a poor predictor of changes in visceral fat.Am J Clin Nutr1993;57:327–33.
54 Hill J, Sidney S, Lewis C,et al. Racial differences in amounts of visceral adipose tissue in young adults: the CARDIA (coronary artery risk development in young adults) study.Am J Clin Nutr1999;69:381–7.
55 Rosmond R, Lapidus L, Bjorntorp P. The influence of occupational and social factors on obesity and body fat distribution in middle-aged men.Int J Obes Relat Metab Disord1996;20:599–607.
56 Pagani M, Lombardi F, Guzzetti S,et al. Power spectral analysis of heart rate and arterial pressure variabilities as a marker of sympatho-vagal interaction in man and conscious dog.Circ Res1986;59:178–93.
57 Rahman F, Pechnik S, Gross D,et al. Low frequency power of heart rate variability reflects baroreflex function, not cardiac sympathetic innervation.Clin Auton Res2011;21:133–41.
58 del Paso G, Langewitz W, Mulder L,et al. The utility of low frequency heart rate variability as an index of sympathetic cardiac tone: A review with emphasis on a reanalysis of previous studies.Psychophysiology2013;50:477–87.
59 Fox K, Borer J, Camm A,et al. Resting heart rate in cardiovascular disease.J Am Coll Cardiol2007;50:823–30.
60 Thayer JF, Yamamoto SS, Brosschot JF. The relationship of autonomic imbalance, heart rate variability and cardiovascular disease risk factors.Int J Cardiol 2010;141:122–31.
61 Wehrens SM, Hampton SM, Skene DJ. Heart rate variability and endothelial function after sleep deprivation and recovery sleep among male shift and non-shift workers. Scand J Work Environ Health2012;38:171–81.
62 Billman GE. The LF/HF ratio does not accurately measure cardiac sympatho-vagal balance.Front Physiol2013;4:26.