RBRH, Porto Alegre, v. 22, e39, 2017 Scientiic/Technical Article
http://dx.doi.org/10.1590/2318-0331.0217170002
Flood damping by reservoirs: proposition of a graphical parametric method
Estimativa do amortecimento de cheias em reservatórios: proposta de método gráfico paramétrico
Danilo Nogueira de Souza1, Ticiana Marinho de Carvalho Studart1, Iran Eduardo Lima Neto1 and José Nilson Beserra Campos1
1Universidade Federal de Ceará, Fortaleza, CE, Brasil
E-mails: [email protected] (DNS), [email protected] (TMCS), [email protected] (IELN), [email protected] (JNBC)
Received: January 04, 2017 - Revised: April 13, 2017 - Accepted: April 24, 2017
ABSTRACT
Flood reduction constitutes an important characteristic of surface reservoir design. Thus, to ensure that minimum safety standards are met, the Safety Dams Act was approved in 2010. Many multipurpose surface reservoirs are aging and getting out of the current technical standards. In Ceará State, Brazil, there are several dams built for many decades, with spillways sized by empirical formulae which are currently outdated. This article contributes to improve the understanding of the morphological and hydrological factors involved in the
process of damping loods in reservoirs and the development of a simple application method that estimates the damping, from such factors. To do so, hydrological simulations of several scenarios representative of reservoir and hydrographic basins conigurations were performed. As a result, the impact of each parameter on lood damping was determined. A graphical method was proposed in which
all the morphological parameters of the basin and the reservoir were aggregated into a single dimensionless parameter - the Reservoir
Damping Index (Φ). With the value of Φ calculated, it is possible to estimate the damping capacity of the reservoir. This method can be used for the design of new reservoirs or for the veriication of reservoir spillways already constructed with other methodologies.
Keywords: Flood damping; Dam safety; Overtopping; Hydrological simulation; Graphical parametric method.
RESUMO
O amortecimento de cheias é uma função importante de reservatórios luviais. Para garantir a segurança das barragens brasileiras,
foi aprovada em 2010 a Lei de Segurança de Barragens. Muitos reservatórios de múltiplos usos estão envelhecidos e, possivelmente, não atentem aos atuais padrões se segurança. No Estado do Ceará, Brasil, há muitas barragens construídas há muitas décadas, com vertedores dimensionados por fórmulas empíricas, atualmente ultrapassadas. Este artigo contribui para melhorar a compreensão dos fatores morfológicos e hidrológicos intervenientes no processo do amortecimento de cheias em reservatórios e no desenvolvimento de um método de simples aplicação que estime o amortecimento, a partir de tais fatores. Para tanto, foram realizadas simulações
hidrológicas de vários cenários representativos de conigurações de reservatórios e de bacias hidrográicas para analisar o impacto de cada parâmetro no amortecimento. Foi proposto um método gráico, de fácil aplicação, no qual todos os parâmetros morfológicos da bacia e do reservatório foram agregados em um único adimensional – o Índice de Amortecimento do Reservatório (Φ). A partir de Φ, é possível estimar a capacidade de amortecimento do reservatório. Tal método pode ser utilizado para o dimensionamento de novos reservatórios ou para a veriicação do vertedores de reservatórios já construídos com outras metodologias.
INTRODUCTION
Dam safety has drawn increasing attention from the national media in recent years. This is because dam failures are often associated with devastating consequences, including loss of human life, especially in densely populated areas. According to Dam
Safety Report 2015 published by National Water Agency (ANA),
in the period covered by the report (Oct/2014 to Sep/2015),
there were four accidents and ive incidents with dams in Brazil
(ANA, 2016).
Zhang et al. (2016) analyzed 1,065 cases of dam failure in several countries and noted that most reservoirs have capacities less than 100 hm3 and more than half are less than 15 m high. In other
words, a small earth dam with either a small reservoir capacity or a small height appears to have a relatively high probability to fail. The authors also point out that a dam is most likely to fail
within its irst ive-year service, especially during the irst year
after construction.
When evaluating dam breaks occurring around the world
between 1910 and 2010, one can observe the growth of the occurrence of serious and very serious accidents (WANDERLEY et al., 2016). In this context, several countries approved laws and adopted new safety standards for large dams, in recent decades.
The Safety Dams Act (Federal Law nº 12,334/2010, BRASIL, 2010), a product of domestic concerns about dam safety, established the National Dam Safety Policy (PNSB) and created the National Dam Safety Information System (SNISB). Such norm, now in the process of updating by the Senate Bill PLS n° 224/2016 (BRASIL, 2016), aims to ensure the observance of security standards of Brazilian dams.
It is worth pointing out the number of dams in the Northeast Brazil, because of the ‘Damming Policy’, inserted in the policy to combat droughts in the region (CAMPOS; STUDART, 2008). Only in the State of Ceará is estimated to exist about 30,000 dams (BRASIL, 2005; CAMPOS et al., 2016). Many of them were built more than 50 years ago, designed following appropriate criteria at that time and with data of that time and may constitute potential danger to life and property to downstream populations.
According to Wang and Zhang (2016), it is dificult to identify a distinct, single cause for a dam failure. Often, several causes are involved in a failure and these causes are interrelated with each other. However, the authors identify ‘overtopping’ as a primarily responsible for failures of dams, arriving alone, more than 30% of all failures.
Only in 2004, it is estimated that more than 300 dams of various sizes and types have failed in Brazil; most due to hydrological extreme events occurred that year (BRASIL, 2005).
Reservoirs play a determining role in lood peak damping,
mitigating the adverse effects downriver from these structures.
The rupture of the dam by overtopping results from the insuficiency
of spillway capacity.
This paper contributes to a better understanding of
morphological and hydrological factors involved in lood peak
damping in reservoirs. It also innovates by developing a graphical method for its estimation expeditiously. It is expected to add another valuable tool for dam safety in hydrological perspective.
THE FLOOD DAMPING PROCESS
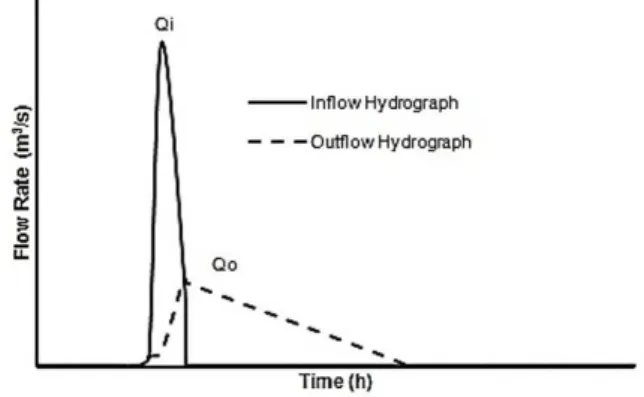
The hydrograph of a lood entering a reservoir changes in shape as is emerging out from the reservoir. This is due to volume of water stored in reservoir temporarily. The peak of the hydrograph will be reduced, the time to peak will be delayed and base of the hydrograph will be increased. It has a positive effect on
the retention at lood by damping the lood wave and attenuating its peak. The damping rate is deined as the ratio between the outlow (Qo) and inlow hydrographs (Qi) peaks (Figure 1).
Numerical solutions of the equations of continuity and
momentum are usually applied to investigate the spread of looding
in a reservoir and assess its effect on attenuation of the peak of
the lood (GARCIA-NAVARRO; ZORRAQUINO, 1993). However, often the intention is merely to verify expeditiously
if the values found for the lood damping in a given project, are
within the range of reasonableness for a given reservoir, with certain characteristics.
In this sense, are found in the literature some studies focusing on the expeditious scaling of small reservoirs, in urban areas. Horn (1987), for example, has proposed a procedure for the
determination of the efluent low as a function of the afluent
hydrograph, reservoir storage and pouring structure, enabling a rapid assessment of the effects of changes of these parameters
in lood mitigation.
Akan (1989) developed a method for the design of detention reservoirs of double outlet (spillway and hole) through the numerical evaluation of dimensionless equations, resulting in many abacuses for various return periods. Akan (1990) proposed dimensionless abacuses for analysis or design of detention reservoirs and spillways, according to different initial conditions. Akan and Antoun (1994) also developed dimensionless graphics
for preliminary sizing of lood control basins, whereas only one
output (hole or spillway), to the storable volume estimates. Basha (1994), also working with urban basins, presented
an analytical solution for simpliied design of circular galleries and detention reservoirs, having the afluent hydrograph and parameters
of the reservoir. Hong (2008) presented dimensionless abacuses for the calculation of the maximum volume of detention reservoirs
for rain, based on their shape, in the spillway type and afluent
hydrograph (triangular). Other graphics methods for design of
detention basins, obtained through generalized numerical solution, are presented by Graber (2009) and Froehlich (2009). In all cases, simplifying assumptions are made for the storms and river basins. As a result, these models are more applicable to urban hydrology and small watersheds (SORDO-WARD et al., 2012).
Sordo-Ward et al. (2012) studied the abatement effect of
large dams with ixed-crest spillways under extreme design lood
conditions. An automated tool was designed for calculations based on a Monte Carlo simulation environment, which integrates models that represent the different physical processes in watersheds with areas of 150-2000 km2. The tool was applied to 21 sites that
were uniformly distributed throughout continental Spain, with
105 ixed-crest dam conigurations. For all cases studied, the
authors obtained a strong linear correlation between the peak
low entering the reservoir and the peak low discharged by the
dam, and a simple general procedure was proposed to characterize
the peak-low attenuation behavior of the reservoir. Additionally, two dimensionless coeficients were deined by Sordo-Ward et al.
(2013) to relate the variables governing both the generation of the
lood and its abatement in the reservoir. Using these coeficients, a model was deined to allow for the estimation of the lood
abatement effect of a reservoir. The method can be used to design reservoirs, as well as to dam safety assessment under the hydrological point of view.
MATERIAL AND METHODS
The methodology adopted in this paper, to describe the
patterns and to estimate the afluent lood damping is hydrological
simulation. The water level of the reservoir is considered at the spillway height, which corresponds to the worst situation for
damping. Without extra volume to allocate the afluent lood, it
spreads on lake surface and has its way out through the spillway
Data used
Since the 1990s, 79 reservoirs have been built in the state of Ceará. From these, it was selected for this study 19 reservoirs, depending on the availability of its original project, to identify the values of its parameters. The choice of the year 1990 to start the research is because, from then on, the “Safety Dam Board in Ceará” was installed, which standardized the projects in the State, adopting more modern methodologies.
Hydrological simulation of reservoirs
For the hydrological simulations, the HEC-HMS software (USACE, 2016) was used. In the loss and transformation processes, the Curve Number methods (D’ASARO et al., 2014; MAHMOUD, 2014) and the SCS unit hydrograph were used (BLAIR et al., 2014). The propagation in the reservoir was determined by the classical Puls Method.
Design storm
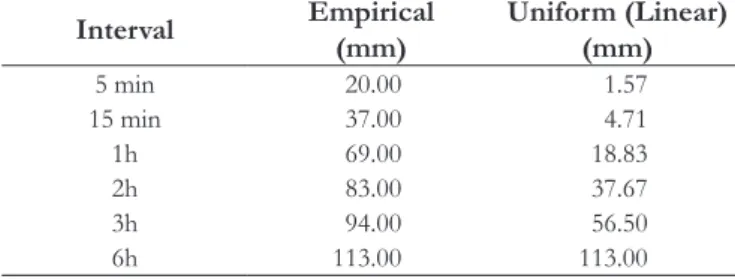
Because it is an expeditious method, it is necessary to make simplifying assumptions. Therefore, it was assumed that the whole State of Ceará features the same storm pattern observed in the João Guerra reservoir. All the reservoirs were simulated with linear hyetograph, with a total of 113 mm and rain duration equal to 6 hours, characteristics of the design storm of this reservoir.
To evaluate the inluence of precipitation (shape, duration and magnitude) in the process of mitigation of lood hydrographs,
reservoirs were also simulated with an empirical hyetograph, with rainfall duration equal to 6, 12 and 24 hours and magnitudes following fractions of P (0.6 P to 1.8 P), where P = 113 mm (Table 1).
Damping intervening parameters
The damping rate (A) is a function of hydrological and morphological parameters of the watershed and reservoir.
The parameters of the reservoir are the form factor (deines if
the reservoir is more ‘open’ or ‘closed’), the spillway height and the spillway width. The parameters of the basin are the area, the Curve Number (average value of the CN of the soils of the basin) and the time of concentration of the watershed contributing to the section of the reservoir.
Thus, the reservoir damping can be deined by Equation 1.
( )
A= αf , B, CN, H, W, tc (1)
Where: A denotes the damping rate, α is the reservoir shape
factor; B represents the area of the watershed; CN is the value
of the “curve number”; H is height of the spillway; W is width
of the spillway and tc is time of concentration of the watershed.
The form factor α is determined by the model of the
inverted cone (CAMPOS et al., 2016):
3
V .H=α (2)
Where: V the storage capacity of the reservoir (m 3).
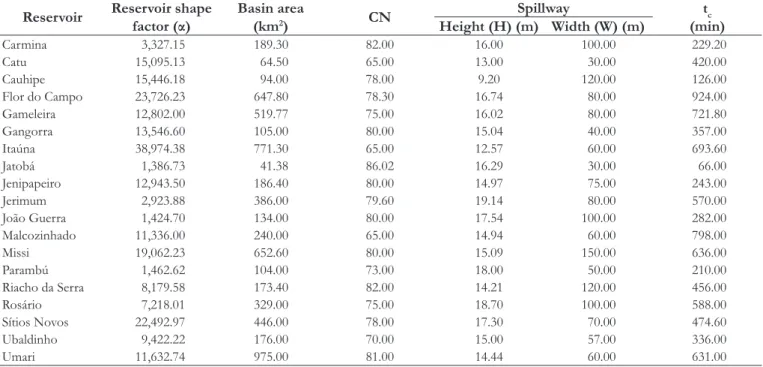
Table 2 presents the 19 reservoirs analyzed with their
characteristics - reservoir form factor (α), spillway height (H) and spillway width (W) - as well as those of their respective
hydrographic basins - basin area (B), Curve Number (CN) and time of concentration (tc).
Table 1. Cumulative Rainfall Hyetographs (Empirical and Uniform).
Interval Empirical
(mm)
Uniform (Linear) (mm)
5 min 20.00 1.57
15 min 37.00 4.71
1h 69.00 18.83
2h 83.00 37.67
3h 94.00 56.50
Simulated damping theoretical scenarios
It was adopted in the simulations the same range of variation of the parameters found in the projects of the 19 reservoirs: reservoir shape factor (1,000 to 40,000), basin area (25 and 1,000 km2), CN
(60 to 90), width of the spillway (50 to 150 m), height of the spillway (10.54 to 20.54 m) and time of concentration (50 to 1,000 min). The adoption of different combinations of values for
the intervening parameters - α, B, CN, H, W and tc - allowed to
analyze the behavior of the damping process according to different
conigurations (theoretical scenarios) and to identify which of them present the greatest impact on the peak low reduction.
General equation of damping determination
The aim was to establish a general equation for damping. To do so, all intervening parameters were aggregated into a
dimensionless factor, called Damping Index (Φ).
The reservoir form factor α and CN are already dimensionless.
Taking the other intervening variables, two other dimensionless parameters were determined: one relating physical characteristics of the reservoir to the hydrographic basin and the other one relating
the forces of gravity with the forces of inertia of the low in the basin. The irst one was called the geometric parameter (γ); the second, low parameter (λ).
Each theoretical scenario, with combinations of α, CN, γ and λ results in a value of Φ, which, for its turn, results in a
damping rate value (A).
Thus, a General Equation of Damping and a graphical method to estimate the value of the damping rate expeditiously,
in function of Φ, were formulated.
General equation of damping validation
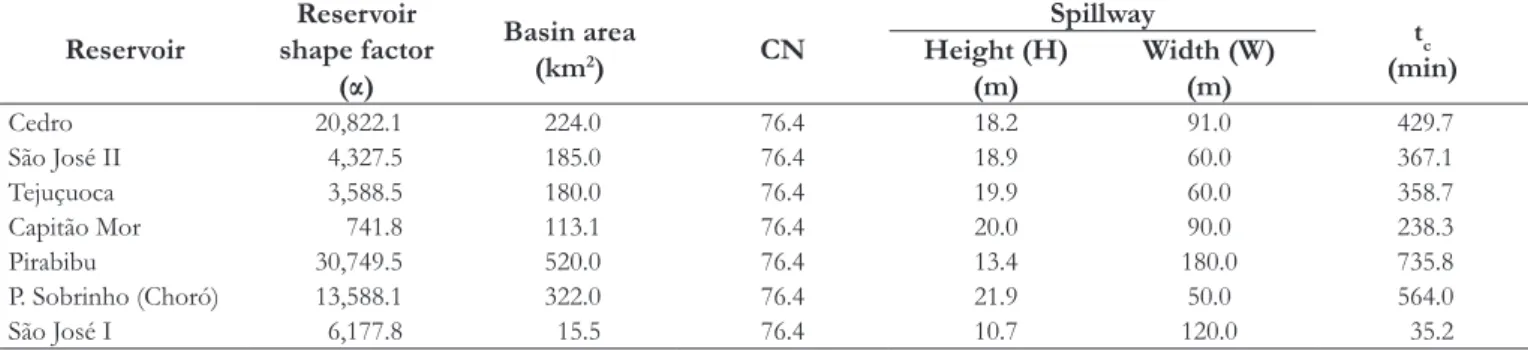
For the method validation, seven other reservoirs built at
different dates were selected (including Reservoir Cedro, the irst
large reservoir in the Northeast Brazil). The reservoirs and their watersheds characteristics are in Table 3.
The reservoirs were simulated, using the same design storm of 113 mm, with duration of 6h, with linear hyetograph. The results of the simulations were compared with the results of the application of the General Equation of Damping.
Comparison of 1,000 and 10,000-years return periods loods
The same methodology was used for the calculation of
10,000-years return periods loods. The values were compared
to identify if the General Equation of Damping can be used for both periods.
RESULTS AND DISCUSSION
The results of the simulations, considering different
parameters involved, were divided into ive groups:
• Analysis of the inluences of the parameters involved in
damping;
• General Equation of Damping adjustment, in function
of the Damping Index (Φ);
• Construction and validation of a graphical method to estimate, in an expeditious way, the damping capacity; Table 2. Reservoirs and their catchment areas characteristics of the sample studied.
Reservoir Reservoir shape factor (α) Basin area
(km2) CN
Spillway tc
(min) Height (H) (m) Width (W) (m)
Carmina 3,327.15 189.30 82.00 16.00 100.00 229.20
Catu 15,095.13 64.50 65.00 13.00 30.00 420.00
Cauhipe 15,446.18 94.00 78.00 9.20 120.00 126.00
Flor do Campo 23,726.23 647.80 78.30 16.74 80.00 924.00
Gameleira 12,802.00 519.77 75.00 16.02 80.00 721.80
Gangorra 13,546.60 105.00 80.00 15.04 40.00 357.00
Itaúna 38,974.38 771.30 65.00 12.57 60.00 693.60
Jatobá 1,386.73 41.38 86.02 16.29 30.00 66.00
Jenipapeiro 12,943.50 186.40 80.00 14.97 75.00 243.00
Jerimum 2,923.88 386.00 79.60 19.14 80.00 570.00
João Guerra 1,424.70 134.00 80.00 17.54 100.00 282.00
Malcozinhado 11,336.00 240.00 65.00 14.94 60.00 798.00
Missi 19,062.23 652.60 80.00 15.09 150.00 636.00
Parambú 1,462.62 104.00 73.00 18.00 50.00 210.00
Riacho da Serra 8,179.58 173.40 82.00 14.21 120.00 456.00
Rosário 7,218.01 329.00 75.00 18.70 100.00 588.00
Sítios Novos 22,492.97 446.00 78.00 17.30 70.00 474.60
Ubaldinho 9,422.22 176.00 70.00 15.00 57.00 336.00
Umari 11,632.74 975.00 81.00 14.44 60.00 631.00
• Analysis of the inluence of the shape of the hyetograph,
the duration and the magnitude of the precipitation in the damping; and
• Application of the results to a real reservoir, including assessment of the impact of different interventions in the basin and in the reservoir.
Understanding intervening parameters in damping
The inluence of the reservoir form factor, the area of the
watershed, the CN, the width and height of the spillway and the
time of concentration in the damping of the loods were analyzed.
Inluence of the reservoir shape factor (α) and the basin area (B)
Figure 2 presents the results of the joint action of reservoir shape factor (ranging from 1,000 to 40,000) and the basin area (ranging from 25 to 1,000 km2) in damping. It is observed in Figure 2a
that, for a given value of the area, as the value of α increases (more
open valleys), the reservoir increases the damping rate, since the
afluent lood passes to have a larger hydraulic basin area for its
spreading. It is also observed that the effect of the form factor on damping is more relevant in smaller basins (25 km2).
It is observed in Figure 2b that, for a same value of α, the damping decreases as the basin area increases. The decrease of
damping with the area is faster in smaller basins (B <200 km2)
and in more closed valleys (α<1,500).
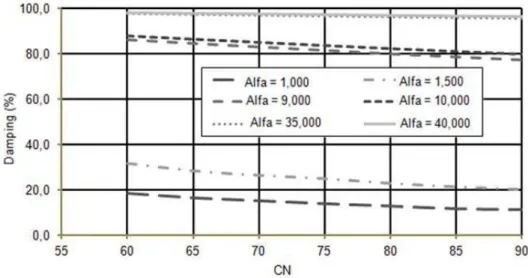
Inluence of reservoir shape factor (α) and the CN of the watershed
It is observed in Figure 3 that the damping capacity decreases with the value of the CN. Highest values of CN indicate greater
impervious areas in the watershed, increasing the volume afluent to the reservoir and reducing its capacity to dampen such a lood. For high reservoir shape factor values (α> 35,000), however, it
has been found that the damping is almost 100%, regardless of the CN value adopted.
Inluence of the height of the spillway (H) and the basin area (B)
It is observed in Figure 4 that the damping increases as the height of the spillway (H) increases, given there is a greater accumulation capacity of the reservoir. There is, once again, the
inluence of the basin area (B); the effect of H is more relevant
in smaller basins.
Inluence of spillway width (W) and basin area (B)
Figure 5 shows that the damping decreases as the spillway
width (W) increases.
Figure 2. Joint impact of reservoir shape factor and basin area in damping: a) Impact of reservoir shape factor in damping with basin area varying between 25 and 1,000 km2; b) Impact of basin area in damping with reservoir shape factor varying between 1,000 and 40,000.
Table 3. Reservoirs and their catchment areas characteristics used for the method validation.
Reservoir
Reservoir shape factor
(α)
Basin area
(km2) CN
Spillway
tc (min) Height (H)
(m)
Width (W) (m)
Cedro 20,822.1 224.0 76.4 18.2 91.0 429.7
São José II 4,327.5 185.0 76.4 18.9 60.0 367.1
Tejuçuoca 3,588.5 180.0 76.4 19.9 60.0 358.7
Capitão Mor 741.8 113.1 76.4 20.0 90.0 238.3
Pirabibu 30,749.5 520.0 76.4 13.4 180.0 735.8
P. Sobrinho (Choró) 13,588.1 322.0 76.4 21.9 50.0 564.0
São José I 6,177.8 15.5 76.4 10.7 120.0 35.2
Figure 3. Impact of CN on damping with the reservoir shape factor (α) varying between 1,000 and 40,000.
Figure 4. Impact of spillway height (H) on damping with basin area (B) varying between 25 and 1,000 km2.
Figure 6. Impact of the time of concentration (tc) in damping.
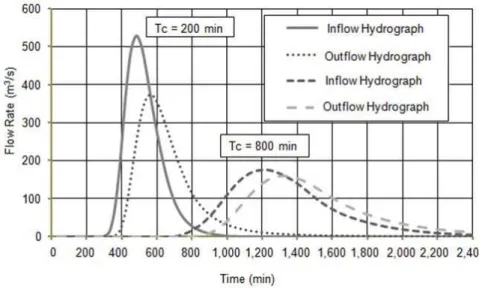
Figure 7. Simulation of the afluent and efluent hydrographs for different times of concentration. This is because the larger the spillway, the greater its
discharge capacity (larger efluent lows) and the smaller the Qo/Qi
ratio. Once again, the effect of the basin area on the damping is
noticed; the effect of W is more relevant in smaller basins.
Inluence of the time of concentration (tc)
Figure 6 shows the impact of the time of concentration on damping. It is observed that the damping decreases with the time of concentration. It was considered other parameters remaining constant (B = 134.00 km2, CN = 80, H = 17.54 m, W = 100 m
and α = 1,424.70).
It is observed in Figure 7 that smaller values of time of
concentration (e.g. 200 min) cause a rapid inlow of water into the
reservoir, generating a considerable rise in water level (increasing the damping). However, higher values of time of concentration (e.g. 800 min) cause a slower supply of water to the reservoir, resulting in a small change in the water level (reducing damping).
General equation of damping
A general equation of damping was determined, inding a dimensionless factor, called Damping Index (Φ) that aggregates
all the other dimensionless parameters. Among the intervening
parameters of A, it is known that only α and CN are dimensionless. Thus, two new dimensionless parameters were deined: the geometric dimensionless (γ), which relects the physical characteristics of the reservoir to the hydrographic basin, and the low parameter (λ), which relates the forces of gravity with the forces of inertia of the low in the basin
The determination of γ was made after the analysis of the inluence of B, H and W on the damping rate (A). It was veriied that A increases with H and decreases with W and B, following low-curvature curves. Thus, the geometric parameter (γ) is described
by Equation 3. It was found that the damping varies linearly with
3
H / W.B
γ = (3)
The determination of λ it was performed by
combining time of concentration (tc), the basin area (B) and the gravitational constant (g). Considering that 2B and tc represent, respectively, a scale of length and a scale of time of the watershed, the Equation 4 can be interpreted as the inverse of the Froude Number, used to describe the free flows (rivers/ponds) through the dimensionless ratio between the forces of inertia and gravity.
2 2
g.Tc
B
λ = (4)
Therefore, the characteristics of the reservoir can be aggregated into a single dimensionless parameter called the
Damping Index (Φ), described by the Equation 5.
( )b
a c d
. 1 / C[α N γ. ]
Φ = λ (5)
Where: α is the reservoir shape factor, CN is the Curve Number of the reservoir basin; γ is the dimensionless geometric parameter and λ is the dimensionless low parameter.
Equations 6 and 7 describe, respectively, the Damping
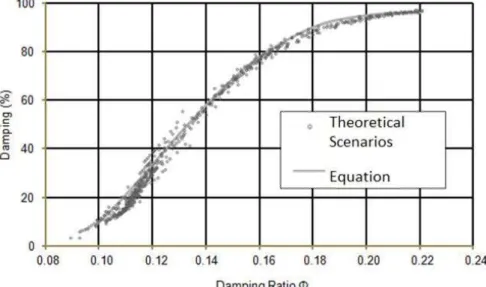
Index (Φ) and the General Damping Equation (A), and were obtained by itting the exponents a, b, c, as well as the coeficients of a fourth-degree polynomial that relates A and Φ, resulting in a coeficient of determination (r2) equal to 0.93.
( )0,3
0,2 0,09 0,08
. 1 / CN[ γ . − ]
Φ = α λ (6)
( ) 4 3 2
A % = 756,1.Φ −509, 9.Φ +119, 0.Φ −10, 5.Φ +304,1 (7)
Figure 8 describes the equation of A. A greater dispersion is observed for values below 0.13 (low damping), which correspond to theoretical scenarios whose parameter combinations are
atypical, such as very large basin areas and with small spillway width values.
The results obtained in the simulations were compared with those obtained by the General Equation of Damping (Figure 9). It was observed that most of the reservoirs (14) presented deviation of less than 10% between the simulated value and the value estimated by the equation, four presented a deviation less than 20% and only one reservoir (Macacos) presented deviation greater than 20%.
Damping of 1,000 and 10,000 years return period loods
All calculations were performed for loods with return
periods Tr = 1,000 years and Tr = 10,000 years. It was observed, however, that for the boundary conditions assumed in the present study, the results were very close to each other, with differences less than 10%. Therefore, the General Equation of Damping (equation and graph) can be used to estimate the damping of the
both return period loods.
Graphical method validation
To validate the General Equation of Damping, seven other reservoirs, constructed in different periods of the sample, were simulated.
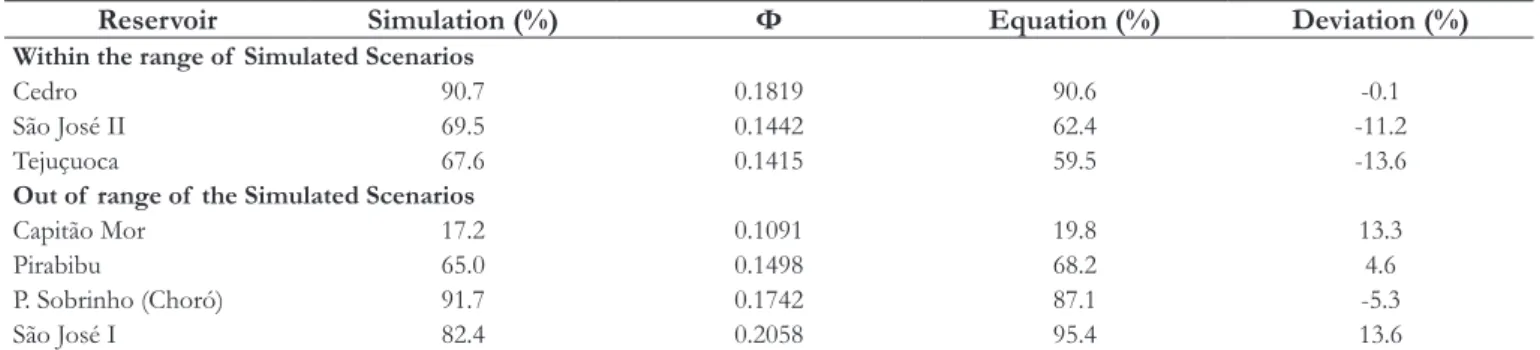
Table 4 presents the results of the damping. Three reservoirs have parameters within the range of variation used for the construction of the equation; the other four have a parameter
outside this range: Capitão Mor (α below minimum and H above maximum), Pirabibu (W above maximum), Choró (H above
maximum) and São José I (B and tc lower than minimum). It is also observed in Table 4 and Figure 10 that, once again, the results of the simulations and the General Equation of Damping are very close to each other, with deviations between the damping values estimated by simulation and general equation less than 14%, which highlights the applicability of the method.
Inluence of the shape of the hyetograph
The inluence of the shape of the hyetograph at peak low of the afluent hydrograph was studied by Figueiredo and Campos (2007). The authors concluded that the larger the slope
of the curve of the hyetograph, the greater the intensity of rain
and, therefore, higher peak low. Alfieri, Laio and Claps (2008) also evaluated the impact of the use of synthetic hyetographs in
the estimation of peak lows during lood events, concluding that
all present a bias in the estimates of the peak of the hydrograph Figure 9. Comparative analysis of damping values calculated by simulation (HEC-HMS) and those estimated by General Equation of Damping (Equation 7).
Figure 10. Graphical representation of the General Equation of Damping (Equation 7) and of the results of the simulations of reservoirs by the HEC-HMS.
Table 4. Reservoirs used for of the General Equation of Damping validation (Equation 7) and the deviations between simulation and equation.
Reservoir Simulation (%) Φ Equation (%) Deviation (%)
Within the range of Simulated Scenarios
Cedro 90.7 0.1819 90.6 -0.1
São José II 69.5 0.1442 62.4 -11.2
Tejuçuoca 67.6 0.1415 59.5 -13.6
Out of range of the Simulated Scenarios
Capitão Mor 17.2 0.1091 19.8 13.3
Pirabibu 65.0 0.1498 68.2 4.6
P. Sobrinho (Choró) 91.7 0.1742 87.1 -5.3
São José I 82.4 0.2058 95.4 13.6
in most climatic and hydrological conditions. The rectangular
hyetograph underestimates the peak lows of the Rational Method
and the hyetograph by the Chicago Method overestimates them.
In this study, the inluence of the shape of the hyetograph on the dampening rate of loods was studied with hydrologic
simulation of 19 reservoirs by applying the uniform hyetograph (linear) and an empirical hyetograph, with the same duration (6h) magnitude of rain (P = 113 mm), described in the Methodology.
The results showed that, on average, the damping corresponding to the uniform rainfall is 5% lower than the damping value using empirical hyetograph. Therefore, in terms of
damping, the impact of the shape of hyetograph is not signiicant.
Somehow, the spreading of the water on the surface of the lake,
performs an aggregation of the afluent volumes and reduces the
effects of the temporal distribution.
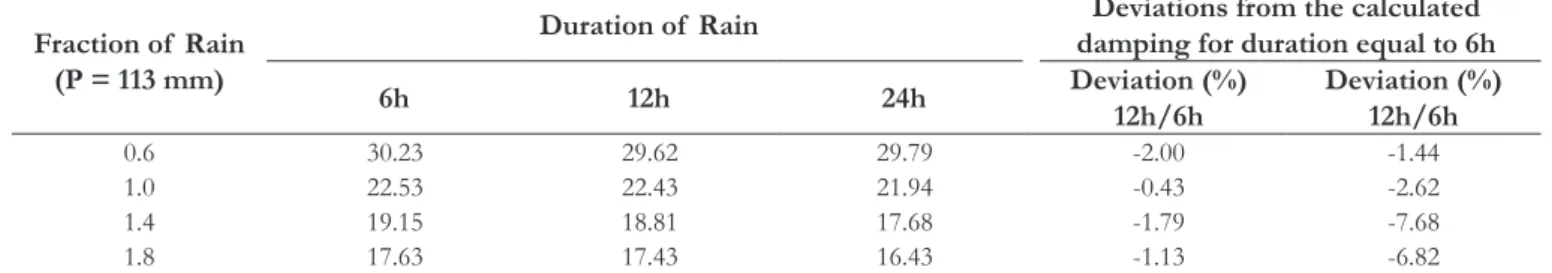
Inluence of duration and magnitude of design storm
The simulations were made with variation of the duration and magnitude of the maximum rainfall. Rainfall durations of 6h, 12h and 24h were adopted and magnitudes varying from 0.6 to 1.8.P (where P = 113 mm). It is observed in Table 5 that the duration
of the precipitation has a very small inluence on the value of the
damping; for the same rainfall value, the deviations in damping values for different durations are less than 10%.
Figure 11. Impact of the magnitude of rainfall in damping.
Because it is expeditious review or veriication of values
previously calculated by different methods, one can therefore adopt 24-hour rainfall obtained directly from the statistical adjustment of the rain gage data, since the duration does not
have a signiicant impact on the damping. On the other hand,
for a given rain duration, a reduction in damping is observed as the magnitude of the rainfall increases, since there is an increase
in the inlow (Figure 11).
Table 6 shows correction of damping coeficients for each fraction of rain. For a design rainfall equal to 0.6, the correction
coeficient shall be 1.1384; to 0.7, will be of 1.0926, and so on
until 1.8. P, where P is the reference rainfall, equal to 113 mm.
Application: the case study of Reservoir Malcozinhado
The General Damping Equation was applied to evaluate
the damping level of the Reservoir Malcozinhado lood, whose
parameters can be found in Table 7.
Based on the basin and reservoir characteristics, the
dimensionless geometric parameter (γ) and dimensionless low parameter (λ) are calculated and then the Damping Index (Φ = 0.1503) is determined.
The graphical determination of the damping is done by
drawing a vertical line from the x-axis (Φ) to the graph (Figure 12). From the given point, a horizontal line is drawn to the y-axis and the damping (A%) is found.
Table 5. Impact of change in design storm (duration and magnitude) in damping.
Fraction of Rain (P = 113 mm)
Duration of Rain Deviations from the calculated
damping for duration equal to 6h
6h 12h 24h Deviation (%)
12h/6h
Deviation (%) 12h/6h
0.6 30.23 29.62 29.79 -2.00 -1.44
1.0 22.53 22.43 21.94 -0.43 -2.62
1.4 19.15 18.81 17.68 -1.79 -7.68
Figure 12. Utilization of the General Equation of Damping (Equation 7) in Reservoir Malcozinhado. Table 6. Damping correction coeficients for each fraction of
reference rain (113 mm). Fraction
of Rain
Coeficient Fraction of Rain Coeficient
0.6 1.1384 1.3 0.9416
0.7 1.0926 1.4 0.9300
0.8 1.0581 1.5 0.9170
0.9 1.0275 1.6 0.9053
1.0 1.0000 1.7 0.8966
1.1 0.9773 1.8 0.8840
1.2 0.9575 -
-Table 7. Reservoir Malcozinhado: current situation.
Parameters Reservoir Malcozinhado
Reservoir shape factor (α) 11,336.00
Basin area (km2) 240.00
CN 65.00
Spillway Width (m) 60.00
Spillway Height (m) 14.94
tc (min) 798.00
Φ 0.1503
Table 8. Damping of Reservoir Malcozinhado: current situation and possible changes in the watershed and reservoir.
Parameters Current
Situation
Alternative Scenarios
Urbanization Sedimentation Increased width of the Spillway
Reservoir shape factor (α) 11,336.00 11,336.00 7,500.00 11,336.00
Basin area (km2) 240.00 240.00 240.00 240.00
CN 65.00 80.00 80.00 65.00
Spillway Width (m) 60.00 60.00 60.00 130.00
Spillway Height (m) 14.94 14.94 14.94 14.94
tc (min) 798.00 798.00 798.00 798.00
Φ 0.1503 0.1412 0.1300 0.1402
Damping ratio (%) 68.7 59.1 45.8 57.9
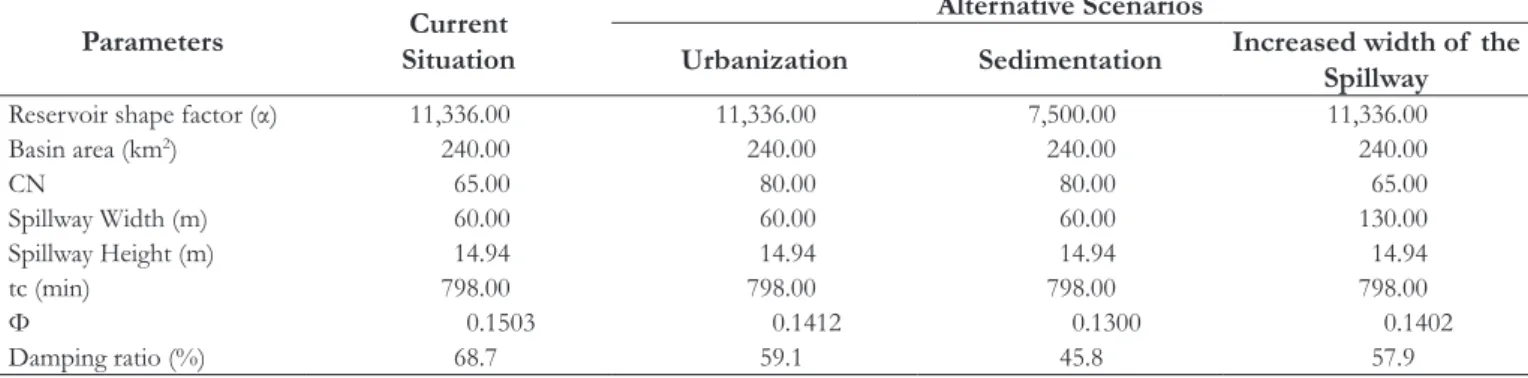
Changes in the basin and in the reservoir
It is also possible to evaluate the damping in different scenarios, such as urbanization of the basin (alteration of the
CN), sedimentation of the reservoir (alteration of α) or increase of the width of the spillway (W change).
Table 8 shows an example of new scenarios for the basin-reservoir system and its impacts on damping. It is observed
that in Reservoir Malcozinhado current situation (Φ = 0.1503),
the estimated damping is around 70%. Assuming an increase in the urbanization of the basin, with CN increasing from 65 to 80
(Φ = 0.1412), the damping capacity reduces to about 60%. In a
joint urbanization scenario (CN = 80) and reservoir sedimentation,
with α being reduced to 7,500 (Φ = 0.1300), the damping is further
reduced to 46% (Figure 13).
In the scenario related to the increase of the spillway width
from 60 to 130 meters (Φ = 0.1402), the estimated damping value
is 60% (Figure 14). In this case, it is observed that by doubling the width of the spillway, the impact on the damping is like the increase of CN from 65 to 80, resulting from the urbanization of the basin.
(current) to 0.6.P. For Φ constant and equal to 0.1503 (Current
Scenario), it is observed that the decrease of the precipitation magnitude increases the damping, which goes from 68.7% to
78.2% (damping correction coeficient for this fraction of rainfall
on Table 6 is 1.1384).
CONCLUSIONS
In this study, hydrological simulations of several scenarios
representative of reservoir conigurations and hydrographic
basins of the State of Ceará, Brazil, were carried out to evaluate reservoir damping.
The results indicated that damping increases with the reservoir shape factor and spillway height. On the other hand, it decreases with the hydrographic basin area, CN factor, spillway width and time of concentration.
The other methods for estimation of damping, cited in
the literature, use inlow hydrographs as input data. The method
proposed here uses morphological parameters of the basin and the reservoir, with the subsequent calculation of the Damping
Index Φ and the correction of the magnitude of the precipitation.
Regarding the precipitation, it was observed that its duration has a reduced impact on the damping capacity of the reservoir, Thus, rainfall with a duration of 24 hours, obtained easily from rain gauges, can be used in this method. As for the shape of the hyetograph, although it is known that it affects the peak of the
afluent hydrograph, it has little inluence on the damping, so that
the simple linear hietograph can be adopted.
The proposed method, called here the General Damping Equation, can be applied to 1,000 and 10,000 years return period
loods, since the results were very similar. It also allows estimating
alternative scenarios by calculating the impact of changes in the Figure 13. Application of General Equation of Dampin (Equation 7) - impacts of basin urbanization and lake sedimentation on damping capacity.
basin (urbanization) or in the reservoir (sedimentation of the lake or increasing the width of the spillway).
In summary, the General Equation of Damping presented very close results to those from HEC-HMSvsimulations, with deviations lower than 15%. Additionally, this method is easy to apply and can be used as a tool for the analysis of the hydrological safety of reservoirs, either for the expedited estimation of the damping of reservoirs in the design phase, or for verifying spillways of existing reservoirs constructed according to other methodologies.
REFERENCES
AKAN, A. O. Detention pond sizing for multiple return periods. Journal of Hydraulic Engineering, v. 115, n. 5, p. 650-664, 1989. http:// dx.doi.org/10.1061/(ASCE)0733-9429(1989)115:5(650).
AKAN, A. O. Single-outlet detention-pond analysis and design. Journal of Irrigation and Drainage Engineering, v. 116, n. 4, p. 527-536, 1990. http://dx.doi.org/10.1061/(ASCE)0733-9437(1990)116:4(527).
AKAN, A. O.; ANTOUN, E. N. Runoff detention for flood volume or erosion control. Journal of Irrigation and Drainage Engineering, v. 120, n. 1, p. 168-178, 1994. http://dx.doi.org/10.1061/(ASCE)0733-9437(1994)120:1(168).
ALFIERI, L.; LAIO, F.; CLAPS, P. A simulation experiment for optimal design hyetograph selection. Hydrological Processes, v. 22, n. 6, p. 813-820, 2008. http://dx.doi.org/10.1002/hyp.6646.
ANA - AGÊNCIA NACIONAL DE ÁGUA. Relatório de Segurança de Barragens 2015. Brasília, 2016. Available from: <http:// www2.ana.gov.br/Paginas/servicos/cadastros/Barragens/
RelatoriodeSegurancadeBarragens.aspx>. Access on: 7 feb. 2017.
BASHA, H. A. Nonlinear reservoir routing: particular analytical solution. Journal of Hydraulic Engineering, v. 120, n. 5, 1994. http:// dx.doi.org/10.1061/(ASCE)0733-9429(1994)120:5(624).
BLAIR, A.; SANGER, D.; WHITE, D.; HOLLAND, A. F.; VANDIVER, L.; BOWKER, C.; WHITE, S. Quantifying and simulating storm water runoff in watersheds. Hydrological Processes, v. 28, n. 3, p. 559-569, 2014. http://dx.doi.org/10.1002/hyp.9616.
BRASIL. Lei nº 12.334, de 20 de setembro de 2010. Estabelece a Política Nacional de Segurança de Barragens. Diário Oficial [da] República Federativa do Brasil, Brasília, DF, 20 set. 2010. Available from: <http://www.planalto.gov.br/ccivil_03/_Ato2007-2010/2010/
Lei/L12334.htm>. Access on: 13 Nov. 2014.
BRASIL. Ministério da Integração Nacional. A segurança de barragens e a gestão de Recursos Hídricos no Brasil. Brasília: Proágua, 2005.
BRASIL. Projeto de Lei nº 224/ 2016. Altera a Lei nº 12.334, de 20 de setembro de 2010. Diário Oficial [da] República Federativa do Brasil, Brasília, DF, 2016. Available from: <http://www25.senado.
leg.br/web/atividade/materias/-/materia/125966>. Access on:
10 feb. 2017.
CAMPOS, J.; STUDART, T. M.C. Drought and water policies in Northeast Brazil: backgrounds and rationale. Water Policy, v. 10, n. 5, p. 425-438, 2008. http://dx.doi.org/10.2166/wp.2008.058.
CAMPOS, J.N.B; LIMA NETO, I.E.; STUDART, T.M.C.; NASCIMENTO, L.S. Trade-off between reservoir yield and evaporation losses as a function of lake morphology in semi-arid Brazil. Annals of the Brazilian Academy of Sciences, v. 88, n. 2, p. 1113-1125, 2016. http://dx.doi.org/10.1590/0001-3765201620150124.
CEARÁ. Governo do Estado. Secretaria dos Recursos Hídricos.
Ceará, 2014. Available from: <http://www.ged.srh.ce.gov.br>.
Access on: 4 mar. 2014.
D’ASARO, F.; GRILLONE, G.; HAWKINS, R. Curve number: empirical evaluation and comparison with Curve Number Handbook Tables in sicily. Journal of Hydrologic Engineering, v. 19, n. 12, 2014. Available from: <http://ascelibrary.org/doi/abs/10.1061/(ASCE)
HE.1943-5584.0000997#sthash.C3dKRGM6.dpuf>. Access on:
08 mar. 2017.
FIGUEIREDO, N. N.; CAMPOS, J. N. B. O efeito do hietograma na vazão de pico de cheias. In: SIMPÓSIO BRASILEIRO DE RECURSOS HÍDRICOS, 17., 2007, São Paulo. Anais... Porto Alegre: ABRH, 2007.
FROEHLICH, D. C. Graphical sizing of small single-outlet detention basins in the semiarid southwest. Journal of Irrigation and Drainage Engineering, v. 135, n. 6, p. 779-790, 2009. http://dx.doi. org/10.1061/(ASCE)IR.1943-4774.0000108.
GARCIA-NAVARRO, P.; ZORRAQUINO, V. Numerical modeling of flood propagation through system of reservoirs. Journal of Hydraulic Engineering, v. 119, n. 3, p. 380-389, 1993. http://dx.doi. org/10.1061/(ASCE)0733-9429(1993)119:3(380).
GRABER, S. D. Generalized numerical solution for detention basin design. Journal of Irrigation and Drainage Engineering, v. 135, n. 4, p. 487-492, 2009. http://dx.doi.org/10.1061/(ASCE)IR.1943-4774.0000010.
HONG, Y. Graphical estimation of detention pond volume for rainfall of short duration. Journal of Hydro-environment Research, v. 2, n. 2, p. 109-117, 2008. http://dx.doi.org/10.1016/j.jher.2008.06.003.
HORN, D. R. Graphic estimation of peak flow reduction in reservoirs. Journal of Hydraulic Engineering, v. 113, n. 11, 1987. http://dx.doi.org/10.1061/(ASCE)0733-9429(1987)113:11(1441).
MAHMOUD, S. Investigation of rainfall-runoff modeling for Egypt by using remote sensing and GIS integration. Catena, v. 120, p. 111-112, 2014. Available from: <http://www.sciencedirect.
com/science/article/pii/S034181621400109X>. Access on: 08
Mar. 2017.
gate-controlled spillways. Journal of Hydrology (Amsterdam), v. 498, p. 113-123, 2013. http://dx.doi.org/10.1016/j.jhydrol.2013.06.010.
SORDO-WARD, A.; GARROTE, L.; MARTÍN-CARRASCO, F.; BEJARANO, M. D. Extreme flood abatement in large dams with fixed-crest spillways. Journal of Hydrology (Amsterdam), v. 466-467, p. 60-72, 2012. http://dx.doi.org/10.1016/j.jhydrol.2012.08.009.
USACE - U.S. ARMY CORPS OF ENGINEERS. Hydrologic Modeling System: HEC-HMS user’s manual. Davis, 2016. Available from: <http://www.hec.usace.army.mil/software/hec-hms/
documentation/HEC-HMS_Users_Manual_4.2.pdf>. Access
on: 4 aug. 2016.
WANDERLEY, L. J.; MANSUR, M.S.; MILANEZ, B; PINTO, R.G. Desastre da Samarco/Vale/BHP no Vale do Rio Doce: aspectos econômicos, políticos e sócio ambientais. Ciência e Cultura, vol. 68, n. 3, p. 30-35, 2016. http://dx.doi.org/10.21800/2317-66602016000300011.
WANG, F.; ZHANG, L. Systemic estimation of dam overtopping probability: bayesian networks approach. Journal of Infrastructure Systems, v. 23, n. 2, p. 1-12, 2016. Available from: <https://www.
researchgate.net/profile/Fan_Wang44/publication/308415292_
Systemic_Estimation_of_Dam_Overtopping_Probability_Bayesian_
Networks_Approach/links/57e3b22508ae112d973bbc97.pdf>.
Access in: 02 mar. 2017.
ZHANG, L.; PENG, M.; CHANG, D.; XU, Y. Dam failure: mechanisms and risk assessment. Singapore: John Wiley, 2016.
Authors contributions
Danilo Nogueira de Souza: Literature review, HEC-HMS simulations, model development and discussion of the results.
Ticiana Marinho de Carvalho Studart: Literature review, model
development, discussion of the results, write the inal paper.
José Nilson Beserra Campos: Model development, discussion of
the results and write the inal paper.