ISSN 0104-6632 Printed in Brazil
www.abeq.org.br/bjche
Vol. 32, No. 01, pp. 127 - 137, January - March, 2015 dx.doi.org/10.1590/0104-6632.20150321s00002696
Brazilian Journal
of Chemical
Engineering
INTERFACIAL ENERGY DURING THE
EMULSIFICATION OF WATER-IN-HEAVY
CRUDE OIL EMULSIONS
V. Karcher
1, F. A. Perrechil
2,3and A. C. Bannwart
1*1Department of Petroleum Engineering, Faculty of Mechanical Engineering,
University of Campinas (UNICAMP), 13083-860, Campinas - SP, Brazil. Phone: + (55) (19) 35213202, Fax: + (55) (19) 32894999
E-mail: [email protected] 2
Center of Petroleum Studies, University of Campinas, (UNICAMP), 13083-970, Campinas - SP, Brazil. 3
Current Address: Institute of Environmental, Chemistry and Pharmaceuticals Sciences, Federal University of São Paulo (UNIFESP), Diadema - SP, Brazil.
(Submitted: May 9, 2013 ; Revised: July 26, 2013 ; Accepted: December 18, 2013)
Abstract - The aim of this study was to investigate the interfacial energy involved in the production of water-in-oil (W/O) emulsions composed of water and a Brazilian heavy crude oil. For such purpose an experimental set-up was developed to measure the different energy terms involved in the emulsification process. W/O emulsions containing different water volume fractions (0.1, 0.25 and 0.4) were prepared in a batch calorimeter by using a high-shear rotating homogenizer at two distinct rotation speeds (14000 and 22000 rpm). The results showed that the energy dissipated as heat represented around 80% of the energy transferred to the emulsion, while around 20% contributed to the internal energy. Only a very small fraction of the energy (0.02 – 0.06%) was stored in the water-oil interface. The results demonstrated that the high energy dissipation contributes to the kinetic stability of the W/O emulsions.
Keywords: Emulsion; Interfacial energy; Energy balance; Droplet size.
INTRODUCTION
During the production and processing of crude oil, the presence of water is very common because water is naturally present in the oil reservoir, caused by the oil recovery method (e.g., water injection in the reservoir) (Fan et al., 2009) and/or from water injection in the production pipeline for friction re-duction purposes (Bannwart, 2001). The turbulent shear associated with fluid flow within a pump, gas lift system and pipeline flow may cause the forma-tion of water-in-oil (W/O) emulsions (Bhardwaj and Hartland, 1994; Peña et al., 2005). These emulsions remain stable for a long period of time, due the
pres-ence of natural emulsifying agents in the oil phase. Crude oils, especially heavy oils, contain significant amounts of asphaltenes (high molecular weight com-ponents), naphthenic acids and resins that act as natural emulsifiers because of their surface activity and capacity to produce viscoelastic layers around the droplets (Djuve et al., 2001; Sjöblom et al., 2003; Wang et al., 2011).
128 V. Karcher, F. A. Perrechil and A. C. Bannwart
viscosity of the heavy oil alone, with a typically non-Newtonian behavior, mainly for higher water volume fractions and lower temperatures (Farah et al., 2005). Thus, the water must be removed to a level of less than 1% using processes called demul-sification or dehydration (Rondón et al., 2006), which contribute to increase the production costs. Moreover, this step of demulsification is not always easily accomplished due to the high stability of these W/O emulsions.
Considering that emulsion formation is an inevi-table process during the production and processing of heavy oils, the understanding of the energy bal-ance involved in the production of water-in-oil emul-sions can be important to define strategies to desta-bilize these emulsions. During emulsion formation, the water-oil interface is first deformed and broken up into many droplets under the action of external forces (McClements, 2005). The force necessary to deform and disrupt a droplet should be larger than the interfacial force, which is characterized by the Young-Laplace equation (2 /R) (where is the in-terfacial tension and R the radius of the droplet). This condition can be achieved by increasing the amount of energy supplied during emulsification through shear stresses in laminar flow, or pres-sure/velocity fluctuations in turbulent flow (Walstra, 1993). However, it has been reported that only a small fraction of the energy input is spent in the in-crease of free energy of the interface (Walstra, 1993; Lemenand et al., 2003; Zhang et al., 2012). In the literature such findings were only qualitatively ob-tained and, to our knowledge, there are no studies that have measured the fraction of energy input that is accumulated at the interface.
The objective of this study was to investigate the interfacial energy and the energy balance involved in the production of water-in-heavy crude oil emulsions through a quantitative study. An experimental set-up was developed in order to measure the terms of the energy balance during the emulsion generation. De-termination of the interfacial energy was based on
the droplet size distribution obtained by optical microscopy and the interfacial properties.
EXPERIMENTAL SECTION
Material
The materials used to prepare the water-in-oil (W/O) emulsions were a 17°API crude heavy oil and distilled water. Before emulsion preparation, the oil was dehydrated during 8 hours using a rotary evapo-rator (Buchi rotavapor model R-215, Buchi, Swit-zerland) in order to remove 13.9% water naturally present in the crude oil. After dehydration, the light compounds (organic phase) were separated from the water and re-mixed with the oil. Table 1 shows the properties of the dehydrated oil and the methods used to obtain these values.
Experimental Apparatus
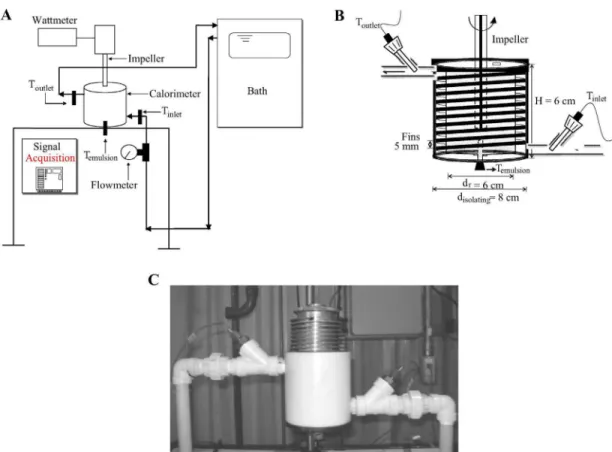
An especially designed calorimeter was built to determine the relative terms of the energy balance of the emulsification process. The schematic view of the experimental apparatus, including the control sys-tem, is shown in Figure 1A. This apparatus was com-posed of a hermetically closed aluminum vessel of 100 cm3 capacity (thermal conductivity ~ 250 W/m.K) with helical fins 1 mm in thickness with 5 mm pitch machined in its external surface to allow the cooling by a water jacket (Figure 1B). The vessel was placed into a cylindrical 1 cm thick Teflon box (thermal con-ductivity ~ 0.3 W/m.K) (Figure 1C), with cover of the same material to get good insulation. In addition, the connections of the calorimeter had rubber sealing rings to prevent heat exchange with the environment. The impeller of a homogenizer (Ultra Turrax T18 Basic, IKA, Germany) was inserted into the vessel to disperse the fluids (Figure 1A). The impeller was of the rotor stator type and the rotor and stator diame-ters were 19 mm and 12.7 mm, respectively.
Table 1: Physico-chemical properties of crude dehydrated heavy oil.
Property Value Measurement method
Viscosity (25 °C) 2250 mPa.s Haake Rheostress rheometer (Haake, Germany)
Specific gravity (25 °C) 0.96 Densimeter
Moisture content 0.24% Karl Fisher 701 KF Titrino (Metrohm, Switzerland)
Surface tension (25 °C) 0.0315 N.m-1 Sigma 701 tensiometer (KSV Instruments, Finland) Water-oil interfacial tension (25 °C) 0.0275 N.m-1
Specific heat (20-100 °C) 1.65 J.g-1.K-1 Differential scanning calorimetry
Asphaltene content (C5I) 9% C5I and C7I were obtained by precipitation with n-pentane and
n-heptane, respectively (methodology described by Santos et al. (2006))
Asphaltene content (C7I) 3%
Figure 1: A) Schematic view of the experimental set-up, B) aluminum vessel and C) calorimeter. Tinlet and Toutlet are the inlet and outlet temperatures of the cooling jacket, Temulsion is the internal temperature of the vessel, dr is the aluminum vessel diameter and disolating is the Teflon box diameter.
The cooling water was supplied by a centrifugal pump installed between the thermostatic bath and the calorimeter. The water flow rate was controlled by valves and measured with a Coriolis mass flowmeter. To reduce the uncertainty in the cooling heat transfer, the water mass flow rate in the jacket was set to 0.3 L/min for all the experiments. Inlet (Tinlet) and outlet (Toutlet) temperatures of the cooling jacket and the internal temperature of the vessel (Temulsion) were recorded by resistance temperature detectors (Pt100) 15 cm in length and 0.5 cm in diameter. A true rms wattmeter (model ET-4080, Minipa, Brazil) was used to measure the electrical power input to the homogenizer. The software LabView Signal Express (National Instruments, USA) was used for the data acquisition.
Experiments
Preliminary studies using single-phase fluids (glycerine and crude oil) were done in order to
vali-date the constructed system. The viscosity of these fluids at 25°C was 1000 mPa.s and 2250 mPa.s, re-spectively. The single-phase fluids were stirred in the Ultra Turrax at 14000 and 22000 rpm and dif-ferent temperatures (15, 25, 35 and 45 °C). In a sec-ond step, emulsions were prepared using different water volume fractions (0.1, 0.25 and 0.4) and rota-tion speeds (14000 – 22000 rpm). The total volume of the emulsion was 90 cm3. Each run lasted approxi-mately 12 min and the cooling water was fixed at 25 °C. The experiments were carried out in duplicate to ensure repeatability.
130 V. Karcher, F. A. Perrechil and A. C. Bannwart
the droplets was determined as the volume-surface mean diameter (d32) (Equation (1)).
3 i i
32 2
i i
n d d
n d
(1)where ni is the number of droplets with diameter di. The specific interfacial area of the emulsions (Ai/V) was calculated using Equation (2).
i 32
A 6α
V d (2)
where V is the volume and α is the water volume fraction.
The rheological measurements on emulsions were carried out at 25 °C in triplicate using a Haake RheoStress 1 rheometer (Haake, Germany). A par-allel plate 30 mm in diameter and a gap of 1 mm was used to evaluate the emulsions. Flow curves were obtained for shear rate values ranging from 0 to 150 s-1. The data obtained were fitted to the power law model
n
( k. ), where is the shear stress, is the shear rate, k is the consistency index and n is the flow behavior index.
Instantaneous Energy Balance
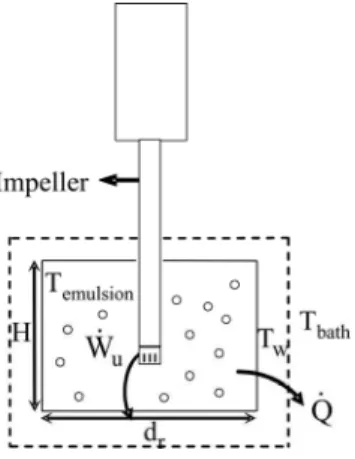
Considering the scheme of Figure 2, the follow-ing general equation for the energy balance can be formulated (Delhaye, 1974).
Figure 2: Schematic view of the emulsion genera-tion experiment. H is the height of the vessel, dr is the vessel diameter, Tw is the temperature of the wa-ter jacket, Tbath is the temperature of the wawa-ter in the bath, Wu is the power transferred to the emulsion by
the impeller and Q is the rate of heat transfer from the vessel.
u o o o w w w vessel vessel
i i emulsion
W Q ρ V c ρ V c m c
d u A dT
dt dt
(3)
where Wu is the power transferred to the emulsion by the impeller (W), Q is the rate of heat transfer from the vessel (W), ρ is the density of the phase (kg/m3), V is the phase volume (m3), c is the specific heat (J/kg.°C), m is the mass (kg), Temulsion is the emulsion temperature (°C), ui is the specific energy per unit of interfacial area (J/m2), Ai is the total interfacial area of the emulsion (m2) and t is the time (s). The subscripts o, w and vessel represent oil phase, water phase and aluminum vessel, respectively.
Thermal resistance inside the vessel was ne-glected due to the strong internal convection caused by the impeller. In addition, as aluminum is a very effective heat conductor, the temperature of the ves-sel wall (Tw) can be considered to be the same as that of the emulsions (Temulsion). In the steady state, Equa-tion (3) becomes:
u Q
W (4)
Thus, if the electric power input (
W
input) is known, then the internal losses of the homogenizer areW
losses
W
input
Q
and the efficiency () can be calculated using Equation (5).u input input steady state
ηW / W Q / W (5)
The specific interfacial energy of the emulsions can be related to the interfacial tension according to Equation (6) (Adamson and Gast, 1997).
i i
i
d
u T
dT
(6)
where is the interfacial tension (N/m) and Ti is the interface temperature (°C).
The first term of this expression ( ) represents the
mechanical effect, while the second one i
i
d T
dT
i i
i
32 i
emulsion
u A 6α d
T
V d dT
(7)
RESULTS
Calorimetric Analysis
The experimental apparatus was first evaluated using pure glycerine and crude oil as single-phase fluids. The heat transfer (Q mc(ToutletTinlet)) and the electric power input (Winput) were measured during the stirring using the data obtained through the temperature detectors and the wattmeter, respec-tively. Figure 3 shows the typical behavior of Q and
input
W with time obtained using glycerine as single-phase fluid, rotation of 14000 rpm and temperature of 25 °C. If the power transferred to the emulsion
u
(W ) is equal to the heat transfer (Q) in the steady state (Equation (4)), the difference between the two curves at 12 min corresponds to the losses in the motor (Wlosses), as shown in Figure 3.
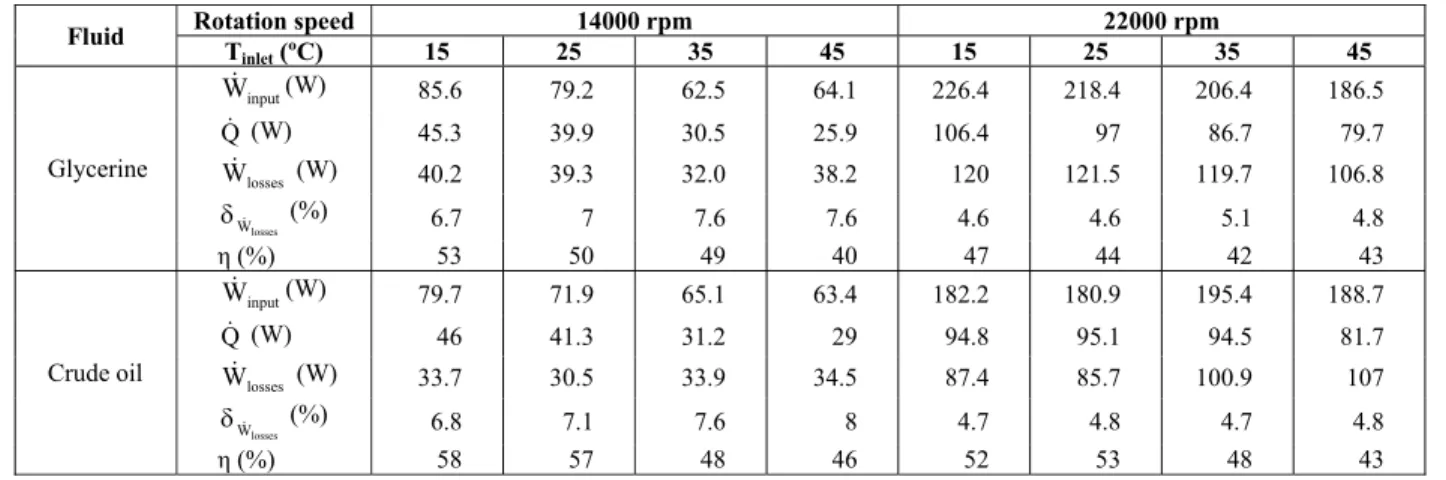
Table 2 shows the mean values of the terms of the energy balance in the steady state for the single-phase fluids (glycerine and crude oil). These tests using single-phase fluids showed that the Wlosses were mainly affected by the rotation speed, and the mean motor efficiency (η) was 48.3% ± 5.3% and tended to decrease with the reduction of temperature. The experimental uncertainties (
losses
W
) were lower than 7.6%. Both parameters (Wlosses and η) were
very influenced by the process conditions (rotation speed and temperature), but η was not affected by the type of fluid. Thus, these results indicated that this is an effective way to measure the losses in the motor of the homogenizer.
Figure 3: Typical time evolutions of the electrical power input (Winput) and heat transfer (Q) for single-phase fluids obtained using glycerine, rotation of 14000 rpm and temperature of 25 °C.
Effect of Emulsification Time
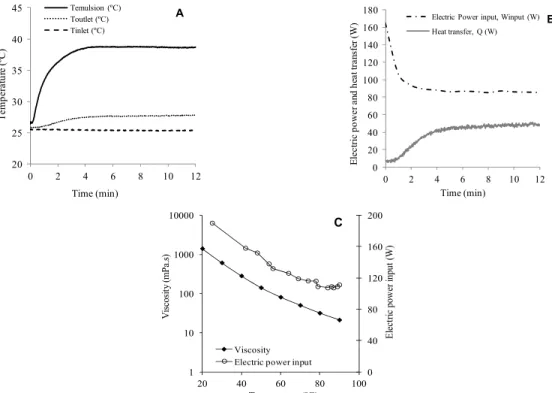
Figure 4 shows the typical time evolutions of temperature, power input and cooling heat transfer for a water-in-heavy oil (W/O) emulsion with a water fraction of 0.1 produced at 14000 rpm. In the beginning of the test (t = 0), all temperatures were approximately 25 °C (Figure 4A), i.e., the same tem-perature as the water bath. During the emulsification process, the emulsion temperature continuously in-creased, which resulted in an increase of the outlet temperature of the water jacket. At the same time, the increase of emulsion temperature promoted a reduction of the power input (Figure 4B). Figure 4C
Table 2: Electrical power input (Winput), heat transfer (Q) and internal losses of the homogenizer (Wlosses)
at the steady state, as well as experimental uncertainty (
losses
W
) and motor efficiency (η) for single-phase fluids homogenized at different rotation speeds and temperatures.Fluid Rotation speed 14000 rpm 22000 rpm
Tinlet(ºC) 15 25 35 45 15 25 35 45
Glycerine
input
W (W) 85.6 79.2 62.5 64.1 226.4 218.4 206.4 186.5
Q (W) 45.3 39.9 30.5 25.9 106.4 97 86.7 79.7
losses
W (W) 40.2 39.3 32.0 38.2 120 121.5 119.7 106.8
losses
W
(%) 6.7 7 7.6 7.6 4.6 4.6 5.1 4.8
η(%) 53 50 49 40 47 44 42 43
Crude oil
input
W (W) 79.7 71.9 65.1 63.4 182.2 180.9 195.4 188.7
Q (W) 46 41.3 31.2 29 94.8 95.1 94.5 81.7
losses
W (W) 33.7 30.5 33.9 34.5 87.4 85.7 100.9 107
losses
W
(%) 6.8 7.1 7.6 8 4.7 4.8 4.7 4.8
132 V. Karcher, F. A. Perrechil and A. C. Bannwart 20 25 30 35 40 45
0 2 4 6 8 10 12
T e mp er at u re ( ºC ) Time (min) Temulsion (ºC) Toutlet (ºC) Tinlet (ºC) A 20 25 30 35 40 45
0 2 4 6 8 10 12
T e mp er at u re ( ºC ) Time (min) Temulsion (ºC) Toutlet (ºC) Tinlet (ºC) A 0 20 40 60 80 100 120 140 160 180
0 2 4 6 8 10 12
E le ct ri c p o w er an d h eat t ran sf er ( W ) Time (min)
Electric Power input, Winput (W) Heat transfer, Q (W)
B 0 20 40 60 80 100 120 140 160 180
0 2 4 6 8 10 12
E le ct ri c p o w er an d h eat t ran sf er ( W ) Time (min)
Electric Power input, Winput (W) Heat transfer, Q (W)
B 0 40 80 120 160 200 1 10 100 1000 10000
20 40 60 80 100
E lect ri c pow er i npu t (W ) V is cosi ty ( m Pa.s ) Temperature (ºC) Viscosity Electric power input
C 0 40 80 120 160 200 1 10 100 1000 10000
20 40 60 80 100
E lect ri c pow er i npu t (W ) V is cosi ty ( m Pa.s ) Temperature (ºC) Viscosity Electric power input
C
Figure 4: Typical time evolutions of A) temperatures and B) power input and heat transfer obtained using an emulsion with water fraction of 0.1 and produced at 14000 rpm. Tinlet and Toutlet are the inlet and outlet temperatures of the cooling jacket and Temulsion is the internal temperature of the vessel. C) Behavior of the viscosity and electrical power input as a function of temperature, obtained using glycerine.
shows the typical behavior of electric power input as a function of the viscosity obtained using a glycerine solution, which indicated that these parameters were directly related. Thus, the increase of emulsion tem-perature caused a reduction in its viscosity and, con-sequently, a decrease in the electrical power input. The other emulsions showed the same behavior of time evolution.
These results indicated that the steady state was achieved at approximately 5 min of homogenization. Thus, all experiments were performed until 12 min, assuring that the steady state was achieved.
Characterization of W/O Emulsions
The W/O emulsions produced after 12 min of homogenization were characterized by optical mi-croscopy and rheological measurements. The droplet sizes of the produced emulsions were obtained through image analysis of the micrographs obtained from optical microscopy. The microstructures of W/O emulsions showed spherical water droplets (sphericity ~1) evenly dispersed in a continuous oily phase (Figure 5). Even for the water fraction of 0.4, flocculation was not observed.
Figure 6 shows the droplet size distribution and the droplet mean diameter (d32) of the W/O emul-sions. In general, the histograms showed a log-nor-mal distribution with the peak between 10 and 30 µm for experiments at 14000 rpm and around 20 µm for tests at 22000 rpm. At 14000 rpm (Figure 6A) the polydispersity (PDI) was higher than at 22000 rpm (Figure 6B). The evaluation of droplet diameters showed that d32 decreased with increasing rotation speed and with decreasing water volume fraction.
Figure 6: Droplet size distribution, mean droplet diameter (d32) and polydispersity (PDI) of the W/O emulsions prepared at A) 14000 rpm and B) 22000 rpm. Water volume fraction: ( ) 0.1, ( ) 0.25 and ( ) 0.4.
Figure 7 shows the rheological properties of the W/O emulsions. The emulsions containing lower water volume fraction (0.1 and 0.25) behaved like Newtonian fluids, while those with 0.4 water fraction showed a shear-thinning behavior.
0 200 400 600 800 1000 1200 1400
0 50 100 150
S
h
ea
r s
tre
ss
(P
a)
Shear rate (s-1)
A
0 200 400 600 800 1000 1200 1400
0 50 100 150
S
h
ea
r s
tre
ss
(P
a)
Shear rate (s-1)
A
0 200 400 600 800 1000 1200 1400
0 50 100 150
S
h
ea
r st
re
ss
(P
a)
Shear rate (s-1)
B
0 200 400 600 800 1000 1200 1400
0 50 100 150
S
h
ea
r st
re
ss
(P
a)
Shear rate (s-1)
B
Figure 7: Flow curves of W/O emulsions produced at A) 14000 rpm and B) 22000 rpm. Water volume fractions of emulsions: ( ) 0 (pure oil), ( ) 0.1, ( ) 0.25 and ( ) 0.4.
The values of the flow behavior index (n) ob-tained from the fit of flow curves to the rheological model and the apparent viscosity at 100 s-1 are shown in Table 3. The results for the flow behavior index confirmed the pseudoplasticity of the emulsions
containing higher water volume fraction (n < 1). In addition, the increase of the water volume fraction led to the increase of emulsion viscosity (Table 3). Emul-sions produced at different rotation speeds were more similar, indicating that this variable had little influence on the rheological properties of the emulsions.
Table 3: Flow behavior index (n), viscosity at 100 s-1 (η100s
-1
) and coefficient of determination (R2) for the different emulsions.
Agitation speed (rpm)
Water volume fraction
n (-) η100s-1
(mPa.s) R2
14000
0.1 1.00 2778 0.998
0.25 1.00 5685 0.999
0.4 0.92 9922 0.996
22000
0.1 1.00 3549 0.998
0.25 1.00 5655 1.000
0.4 0.82 10560 0.979
Energy Balance
The energy balance terms of the emulsification process at the steady state were obtained using Equations (4) and (5) and the values are summarized in Table 4. The results showed that the power input
input
(W ) and heat transfer (Q ) increased as the rotation speed was increased and were quite similar for distinct water volume fractions of the emulsions. The energy efficiency of the motor of the emulsify-ing device was around 50% for all the experimental conditions and had a tendency to decrease with in-creasing rotation speed.
134 V. Karcher, F. A. Perrechil and A. C. Bannwart
the energy necessary to produce the emulsion was between 438.7 and 828.6 J/cm3 and tended to in-crease with increasing rotation speed. Moreover, the increase in rotation speed and water content caused an increase in internal energy. However, about 80% of the total energy required to produce the emulsions was dissipated into heat (Q/Wu) and such energy dissipation was higher for higher rotation speed and lower water volume fraction (Table 5).
Table 4: Steady state energy balance terms for the emulsion generation experiments.
Agitation speed (rpm)
Water volume fraction
input
W
(W)
Q (W)
losses
W (W)
(%)
14000
0.1 86.0 ± 5 48.3 ± 2 37.7 ± 3 56 0.25 97.3 ± 6 51.0 ± 2 46.4 ± 3 52 0.4 95.5 ± 6 51.8 ± 2 43.7 ± 3 54
22000
0.1 196.0 ± 9 93.0 ± 2 103.0 ± 5 47 0.25 203.0 ± 9 102.7 ± 2 100.3 ± 5 51 0.4 196.7 ± 9 97.6 ± 2 99.1 ± 5 50
The energy stored at the interface has a much lower magnitude and can not be accurately deter-mined from integration of Equation (3). Thus, this term should be calculated using Equation (7).
Table 5: Overall energy terms between 0 and 12 min of homogenization.
Agitation speed (rpm)
Water volume fraction
720 u
0
W V (J/cm³)
720
0
Q V (J/cm³)
720
0
U V (J/cm³)
u
Q W (%)
14000
0.1 443.1 349.7 80.2 78.9
0.25 442.7 321.1 103.2 72.5
0.4 438.7 305.6 111.1 69.7
22000
0.1 813.2 702.7 96.6 86.4
0.25 796.8 659.4 121.2 82.8
0.4 828.6 658.3 147.6 79.4
Determination of the Interfacial Energy
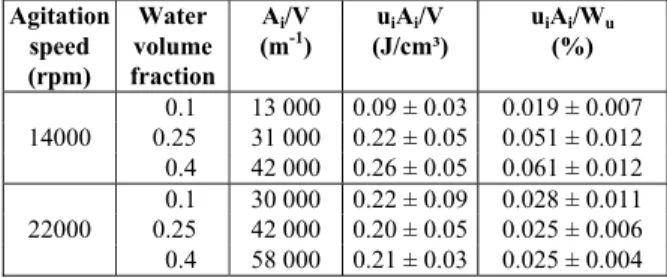
Table 6 shows the interfacial area per unit volume obtained from Equation (2) and the interfacial energy per unit volume (uiAi/V) obtained from Equation (7). The interfacial area per unit volume clearly increased with increasing agitation speed and water volume fraction, as expected. The specific interfacial energy ranged from 0.09 to 0.26 J/cm³ and tended to in-crease as the water volume fraction was inin-creased for emulsions prepared at 14000 rpm. Nevertheless, the interfacial energy of the emulsions produced at 22000 rpm was almost equal and similar to those containing 0.25 and 0.4 water fraction at 14000 rpm.
Compared to the total energy per unit volume pro-vided to the emulsion (uiAi/Wu), the interfacial en-ergy represents a very small fraction (Table 6). This parameter tended to increase with the increase of water volume fraction for emulsions prepared at 14000 rpm, while the values for emulsions prepared at 22000 rpm were very similar.
Table 6: Specific interfacial area (Ai/V), specific
interfacial energy (uiAi/V) and fraction of energy
used to produce the interface (uiAi/Wu).
Agitation speed (rpm)
Water volume fraction
Ai/V
(m-1)
uiAi/V
(J/cm³)
uiAi/Wu
(%)
14000
0.1 13 000 0.09 ± 0.03 0.019 ± 0.007 0.25 31 000 0.22 ± 0.05 0.051 ± 0.012 0.4 42 000 0.26 ± 0.05 0.061 ± 0.012
22000
0.1 30 000 0.22 ± 0.09 0.028 ± 0.011 0.25 42 000 0.20 ± 0.05 0.025 ± 0.006 0.4 58 000 0.21 ± 0.03 0.025 ± 0.004
DISCUSSION
coalescence (Guo and Mu, 2011). The increase of water volume fraction also led to the increase of shear-thinning behavior and viscosity (Table 3), which can be attributed to the greater interaction between water droplets in the emulsion (Paso et al., 2009). Compared to the pure oil (Table 1), the vis-cosity of the emulsions was significantly higher (Table 3), especially for water volume fractions above 0.25. An increase of the viscosity with water volume fraction was also observed by Farah et al. (2005) for W/O emulsions.
The energy balance of the emulsifying process at the steady state showed that the Ultra Turrax effi-ciency was around 50% (Table 4), i.e., only ap-proximately half of the power supplied to the device was transferred to the fluid. Tests carried out with single-phase fluids (glycerine and crude oil) also provided the same average efficiency (Table 2). This efficiency depends on the homogenizer used to pro-duce the emulsions and the conditions of the emul-sification process. Abismail et al. (1999) verified an efficiency of ~40% (electrical power of 130 W and energy transferred to the liquid of 53 W) for ultra-sound and ~70% (electrical power of 170 W and energy transferred to the liquid of 120 W) for me-chanical agitation. Thus, the energy input required to produce an emulsion containing droplets of a given size depends on the energy efficiency of the ho-mogenizer used (McClements, 2005; Jafari et al., 2008).
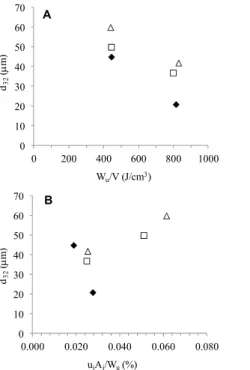
The energy density for the emulsification process (Wu/V) was between 438.7 and 828.6 J/cm3 (Table 5). Comparisons between the energy density for differ-ent devices have been discussed in the literature (Walstra and Smulders, 1998; Schubert et al., 2003; Schultz et al., 2004). In general, these authors veri-fied that energy densities between 1 and 100 J/cm3 are needed to produce O/W emulsions using rotor stator devices. In the present work, the energy em-ployed for emulsion generation was much higher than in other works, probably because of the higher viscosity of the continuous phase of the W/O emul-sions when compared to O/W emulemul-sions. Figure 7A shows the relation between energy density and mean droplet diameter, which demonstrated that the in-crease of the energy employed led to a reduction of the droplet diameter. The same tendency was verified by other authors (Walstra and Smulders, 1998; Schubert et al., 2003; Schultz et al., 2004). Although the energy required to disperse two immiscible fluids is very high, most of the energy employed in the emulsification process (~80%) was dissipated into
heat (Table 5). The reason for this inefficiency is because, in addition to the energy necessary to in-crease the interfacial area ( i A), the disruption of droplets requires the generation of a very high pressure difference, which should be large enough to overcome the Young-Laplace interfacial force
2 R
(McClements, 2005). For the rotor-stator
device, these pressure differences are provided to the system through high shear rates, which result in large amount of energy dissipation due to the friction losses (McClements, 2005).
136 V. Karcher, F. A. Perrechil and A. C. Bannwart
0 10 20 30 40 50 60 70
0 200 400 600 800 1000
d32
(
m)
Wu/V (J/cm3)
A
0 10 20 30 40 50 60 70
0 200 400 600 800 1000
d32
(
m)
Wu/V (J/cm3)
A
0 10 20 30 40 50 60 70
0.000 0.020 0.040 0.060 0.080
d32
(
m)
uiAi/Wu(%)
B
0 10 20 30 40 50 60 70
0.000 0.020 0.040 0.060 0.080
d32
(
m)
uiAi/Wu(%)
B
Figure 8: Relation between mean droplet diameter (d32) and A) total energy density (Wu/V) and B) fraction of energy used to produce the interface (uiAi/Wu) for different water volume fractions: ( ) 0.1, ( ) 0.25 and ( ) 0.4.
CONCLUSIONS
In this study the different terms of the energy bal-ance during the generation of a water-in-oil emulsion were measured in order to determine the interfacial energy involved in this process. The measured terms include: impeller work, heat transfer and internal energy. The interfacial energy was very small and could only be determined from drop size information (d32) and interfacial tension data. The stirring method provided high energy dissipation in the vessel. From the energy provided to the emulsion, about 80% was converted into heat, and just 20% caused a change in internal energy. This energy partition is due to the highly dissipative nature of the method used for emulsion generation. Less than 0.1% of the energy transferred to the emulsion was stored in the water-oil interface and the decrease of this fraction led to emulsions with smaller water droplets, i.e., the in-crease of energy dissipation produced more kineti-cally stable emulsions.
NOMENCLATURE
Ai total interfacial area of the emulsion
m2
Ai/V specific interfacial area m-1
c specific heat J/kg.°C
d32 volume-surface mean diameter m
di diameter of droplets m
k consistency index Pa.sn
m mass kg
n flow behavior index ni number of droplets PDI polydispersity
Q rate of transfer from the vessel W
R radius of the droplets m
R2 coefficient of determination
t time s
Temulsion internal temperature of the vessel °C
Ti interface temperature °C
Tinlet inlet temperature of the cooling jacket
°C
Toutlet outlet temperature of the cooling jacket
°C
Tw temperature of the vessel wall °C ui specific interfacial energy J/m2
V volume m3
input
W
electrical power input Wlosses
W
internal losses of the homogenizerW
u
W
power transferred to the emulsion by the impellerW
Greek Symbols
α water volume fraction
shear rate 1/s
motor efficiency %
η100s-1 viscosity at 100 s-1 mPa.s
ρ density of phase kg/m3
interfacial tension N/m
shear stress Pa
ACKNOWLEDGEMENTS
The authors are grateful to PETROBRAS S.A. and FINEP, Brazil, for the financial support to this study. We also acknowledge the grants conceded by CAPES and CNPq, Brazil.
REFERENCES
Adamson, A. W. and Gast, A. P., Physical Chemistry of Surfaces. Wiley, New York (1997).
Al-Sabagh, A. M., Kandile, N. G., El-Ghazawy, R. A. and Noor El-Din, M. R., Synthesis and evaluation of some new demulsifiers based on bisphenols for treating water-in-crude oil emulsions. Egyptian Journal of Petroleum, 20, 67-77 (2011).
Aoki, K., Size-distribution of droplets in emulsions by statistical mechanics calculation. Journal of Colloid and Interface Science, 360, 256-261 (2011).
Bannwart, A. C., Modeling aspects of oil – water core – annular flows. Journal of Petroleum Sci-ence and Engineering, 32, 127-143 (2001). Bhardwaj, A. and Hartland, S., Dynamics of
emulsi-fication and demulsiemulsi-fication of water in crude oil emulsions. Industrial & Engineering Chemistry Research, 33, 1271-1279 (1994).
Darine, S., Christophe, V. and Gholamreza, D., Emulsification properties of proteins extracted from beef lungs in the presence of xanthan gum using a continuous rotor/stator system. LWT – Food Science and Technology, 44, 1179-1188 (2011).
Delhaye, J. M., Jump conditions and entropy sources in two-phase systems. Local instant formulation. International Journal of Multiphase Flow, 1, 395-409 (1974).
Djuve, J., Yang, X., Fjellanger, I. J., Sjöblom, J. and Pelizzetti, E., Chemical destabilization of crude oil based emulsions and asphaltene stabilized emulsions. Colloid & Polymer Science, 279, 232-239 (2001).
Fan, Y., Simon, S. and Sjöblom, J., Chemical desta-bilization of crude oil emulsions: Effect of non-ionic surfactants as emulsion inhibitors. Energy & Fuels, 23, 4575-4583 (2009).
Farah, M. A., Oliveira, R. C., Caldas, J. N. and Ra-jagopal, K., Viscosity of water-in-oil emulsions: Variation with temperature and water volume fraction. Journal of Petroleum Science and Engi-neering, 48, 169-184 (2005).
Gingras, J.-P., Tanguy, P. A., Mariotti, S. and Chav-erot, P., Effect of process parameters on bitumen emulsions. Chemical Engineering and Processing: Process Intensification, 44, 979-986 (2005). Guo, Q. and Mu, T. H., Emulsifying properties of
sweet potato protein: Effect of protein concentra-tion and oil volume fracconcentra-tion. Food Hydrocolloids, 25, 98-106 (2011).
Jafari, S. M., Assadpoor, E., He, Y. and Bhandari, B., Re-coalescence of emulsion droplets during high-energy emulsification. Food Hydrocolloids, 22, 1191-1202 (2008).
Lemenand, T., Della Valle, D., Zellouf, Y. and Peer-hossaini, H., Droplets formation in turbulent mixing of two immiscible fluids in a new type of static mixer. International Journal of Multiphase Flow, 29, 813-840 (2003).
McClements, D. J., Food Emulsions – Principles, Practices and Techniques. CRC Press, Boca Raton (2005).
Paso, K., Silset, A., Sørland, G., Gonçalves, M. A. L. and Sjöblom, J., Characterization of the forma-tion, flowability, and resolution of Brazilian crude oil emulsions. Energy & Fuels, 23, 471-480 (2009). Peña, A. A., Hirasaki, G. J. and Miller, C. A.,
Chemically induced destabilization of water-in-crude oil emulsions. Industrial & Engineering Chemistry Research, 44, 1139-1149 (2005). Rondón, M., Bouriat, P., Lachaise, J. and Salager, J.
-L., Breaking of water-in-crude oil emulsions. 1. Physicochemical phenomenology of demulsifier action. Energy & Fuels, 20, 1600-1604 (2006). Santos, R. G., Mohamed, R. S., Bannwart, A. C. and
Loh, W., Contact angle measurements and wetting behavior of inner surfaces of pipelines exposed to heavy crude oil and water. Journal of Petroleum Science and Engineering, 51, 9-16 (2006).
Schubert, H., Ax, K. and Behrend, O., Product engi-neering of dispersed systems. Trends in Food Science & Technology, 14, 9-16 (2003).
Schultz, S., Wagner, G., Urban, K. and Ulrich, J., High-pressure homogenization as a process for emulsion formation. Chemical Engineering & Technology, 27, 361-368 (2004).
Sjöblom, J., Aske, N., Auflem, I. H., Brandal, Ø., Havre, T. E., Sæther, Ø., Westvik, A., Johnsen, E. E. and Kallevik, H., Our current understanding of water-in-crude oil emulsions. Recent characteri-zation techniques and high pressure performance. Advances in Colloid and Interface Science, 100-102, 399-473 (2003).
Walstra, P. and Smulders, P. E. A., Emulsion For-mation. In: Binks, B. P., (Eds). Modern Aspects of Emulsion Science. The Royal Society of Chemistry, Cambridge (1998).
Walstra, P., Principles of emulsion formation. Chemi-cal Engineering Science, 48, 333-349 (1993). Wang, W., Gong, J. and Angeli, P., Investigation on
heavy crude-water two phase flow and related flow characteristics. International Journal of Multiphase Flow, 37, 1156-1164 (2011).