*e-mail: [email protected]
Synthesis of Group IVB Metals Oxicarbides
by Carboreduction Reactions
A.D. Mazzonia*, M.S. Conconib
CETMIC (Centro de Tecnología de Recursos Minerales y Cerámica) Cno. Centenario y 506. C.C. 49 (B1897ZCA) M.B.Gonnet - Buenos Aires, Argentina
aCONICET y UNLP bCICPBA
Received: December 21, 2001; Revised: July 30, 2002
The metals of the group IV B (Ti, Zr, Hf) present a series of carbides and oxicarbides with scientific and technological interest. Many of these compounds belong to the subsystem “MO - MC” of the pseudoternary “MO - MN - MC” system (where M = Ti, Zr or Hf).
In this work carboreduction reactions of TiO2 and ZrO2 were performed in argon atmosphere, using temperatures from 1250° to 1650° and reaction times of 120 min. The oxicarbides obtained were in the range TiC0.16O0.84 to TiC0.73O0.27 and ZrC0.46O0.54 to ZrC0.90O0.10. respectively.
The reaction products were characterized by X-ray diffraction (XRD), with the calculation of their cell constants by means of the Rietveld method. Scanning Electron Microscopy (SEM) was used in the characterization of powdered materials. Additionally, the carborreduction reaction was followed by weight loss.
Keywords: carboreduction, anatase, badeleyite, oxicarbides, carbides
1. Introduction
The group IV B metals, as titanium (Ti) and zirconium (Zr), present pseudoternary systems of the type “MO - MN - MC” (where M = metal). Both systems show substitutional solid solutions which correspond to exten-sive monophasic zones. The solutions, named M(C,N,O), have the same cubic crystalline structure (S.G.:Fm3m) that MN, MC and MO phases in the corners of diagrams. The
unit-cell parameter (ao) of M(C,N,O) phase depends on the
MC, MO and MN content.
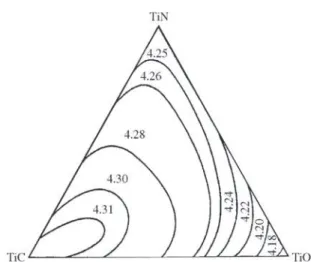
Figure 1 shows the pseudoternary phase diagram “TiO–
TiN–TiC” proposed by Neumann et al.1. The monophasic
zone covers the whole diagram at temperatures higher than 1100 °C. This zone corresponds to the Ti(C,N,O) phase. The cell parameter ao varies between 4.12 Å and 4.32 Å1.
The pseudoternary system “ZrO – ZrN – ZrC” was stud-ied by Constant et al.2.These authors observed a
consider-able solubility of “ZrO” (added as an equimolar mix of ZrO2
+ Zr) in ZrC, ZrN and Zr(C,N). Figure 2 shows the limit of
monophasic zone at 1600 °C. The ao parameter of the phase
Zr(C,O,N) changes between 4.570 Å and 4.692 Å. The monophasic zones cover in part the MO-MC axes in both systems. Thus, the subsystems “MO-MC” present oxycarbides M(C,O). These oxycarbides, Ti(C,O) and Zr(C,O), have the same cubic structure of M(C,N,O) with
ao depending on MC and MO content. The values of ao
in-crease with the MC content , the highest value corresponds to MC pure phase.
The synthesis of these compounds is usually obtained
by TiO, TiC or ZrO2, Zr, ZrC reactions in argon atmosphere
or vacuum3,4. Carborreduction reactions of the MO
2
(TiO2-anatasa, ZrO2- badeleyite) oxides constitute an alter-native method to obtain these phases. This method is within the present tendency to use abundant and cheap raw materi-als to obtain ceramic powders (oxides as well as carbides). Ceramics are manufactured starting from well character-ized raw materials and then purified in order to control the degree of impurities.
crystalline phases by x-ray diffraction (XRD). This method
was developed by Hugo Rietveld in 19695, in order to
re-fine crystalline structures using neutron diffraction data. At the present time, it is also used to perform analysis of struc-ture and crystalline defects, reticular parameter measure-ment and quantitative analysis in X-ray diffraction.
In this work, the carborreduction reactions of anatasa
and badeleyite were studied by XRD. Reaction products were characterized by XRD (Rietveld) and scanning elec-tron microscopy (SEM). The weight loss was also meas-ured.
2. Materials And Methods
Raw materials used were badeleyite Riedel-de Haën from
Germany with more than 99% (ZrO2 + HfO2) content,
anatase Fluka from Switzerland with more than 99% TiO2
content and carbon black (carbon 97%, ash 1%, volatiles
2% and a specific surface area BET = 45 m2/g). All
pow-ders have an average particle size lower than 5 mm. The argon used contains less than 5 ppm of O2 and H2O.
Samples were prepared by wet mixing of the calculated amounts of regents, and then they were dried and pressed at 39 MPa into cylinders of 2 mm in height and 10 mm in
diameter. Samples were called by a letter and the C/MO2
relation. Letter A was used for samples prepared from anatase and letter B for samples from badeleyite. Thus, we
obtain the samples A200 (C/TiO2 = 0.200), A280, A360,
A430 and A500 and the samples B180 (C/ZrO2 = 0.180),
B210, B240, B300 and B450.
Reactions were performed in a horizontal alumina reac-tor with argon flowing through it. The pressure used was 0.05 Mpa above the atmospheric pressure, and the flow was 1 l/min. Experiments were carried out within the range of 1250 to 1650 °C with reaction times of 120 min and the temperature slopes were 10 °C/min upward as well as down-ward. The Ar flow was kept during cooling up to 200 °C.
Crystalline phases were characterized by X-ray diffrac-tion with a Philips 3020 Goniometer with a PW 3710
con-troller, Cu-Kα, Ni filter, 40 kV-20 mA. The scanning was
made between 10° and 75° with step size of 0.02° and a step counting time of 2 sec. Some samples were scanned with 40 kV-30 mA and a step counting time of 4 sec. The set of divergence, receiving and scattering slits were 1°, 0.2°, 1° and no monochromator was used. The unit cell param-eters were refined using the Rietveld refinement
FULLPROF 6 program. The starting crystallographic data
for each phase were taken from literature7-11. The refining
sequence began with the adjustment of the shift in 2θ due
to vertical sample displacement and the background. To do this, elemental Si was added to the samples as internal stand-ard. Then, for each phase, the scale factors, the cell con-stants, the parameters for calculation of the full-width-at-half-maximum (FWHM), the profile (pseudo Voight) func-tion coefficients, the preferred orientafunc-tion parameter for the March function, were sequentially refined. Quantitative phase analysis was also performed by FULLPROF program based on the scale factors of each phase.
The Zr(C,O) and Ti(C,O) crystallite sizes were deter-mined by the full-width-at-half-maximum of peak (200) for
Figure 1. Pseudoternary diagram of the TiN-TiC-TiO system at 1100 °C (from Neumann et al.)1. The cell parameters a
o of
Ti(C,N,O) are indicated. The lines separate zones of similar ao.
Figure 2. Pseudoternary diagram of the ZrN – ZrO – ZrC system at 1600 °C (from Constant et al.) 2. The unit-cell parameters a
o of
obtained after refinement, using the Scherrer equation and the PC-APD (PW 1877) Analytical Powder Diffraction Software, Version 3.6. Weight losses were measured by weighing the samples before and after the reaction process. The reaction products were also studied by scanning electron microscopy (SEM) using a Philips 505 equipment.
3. Results And Discussion
The following theoretical equations describe the reac-tions carried out in these systems:
TiO2 + (a+b) C → {TiCaO2-b} + b CO (A)
ZrO2 + (c+d) C → {ZrCcO2-d} + d CO (B)
where a, b, c and d are stoichiometric coefficients (0 ≤ a ≤ 1,
1 ≤ b ≤ 2, 0.40 ≤ c ≤ 1 and 1.4 ≤ d ≤ 2). The phases {TiCaO2-b}and {ZrCcO2-d} are metal oxicarbides belonging to the MC-MO edge of the MC-MO-MN system. These phases are called Ti(C,O) and Zr(C,O) respectively.
Table 1 shows the results obtained in the TiO2
carborreduction. Estimated standard deviations of weight percents were derived from the estimated standard devia-tions on individual scale factors for the respective phases, and other error contributions were not included.
The Ti (C,O) content increase with the temperature and carbon content being the unique product obtained at high temperatures and high C content.
Table 2 shows the values of ao obtained by the Rietveld
method for the Ti(C,O) phases. Ranges of values appear in some cases due to the necessity of using two or more Ti(C,O)
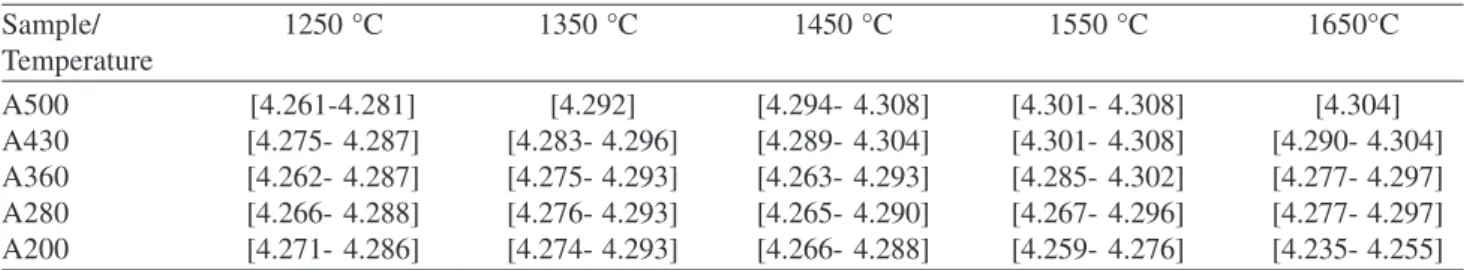
Table 2. Refined unit cell parameter ao (Å) for Ti(C,O) phase in TiO2 samples at different temperatures.
Sample/ 1250 °C 1350 °C 1450 °C 1550 °C 1650°C
Temperature
A500 [4.261-4.281] [4.292] [4.294- 4.308] [4.301- 4.308] [4.304]
A430 [4.275- 4.287] [4.283- 4.296] [4.289- 4.304] [4.301- 4.308] [4.290- 4.304]
A360 [4.262- 4.287] [4.275- 4.293] [4.263- 4.293] [4.285- 4.302] [4.277- 4.297]
A280 [4.266- 4.288] [4.276- 4.293] [4.265- 4.290] [4.267- 4.296] [4.277- 4.297]
A200 [4.271- 4.286] [4.274- 4.293] [4.266- 4.288] [4.259- 4.276] [4.235- 4.255]
Table 1. Phases content (wt.%) of TiO2 samples at different temperatures.
Sample/ 1250 °C 1350 °C 1450 °C 1550 °C 1650 °C
Temperature
A500 Ti(C,O) 95.4(7)* Ti(C,O) 100 Ti(C,O) 100 Ti(C,O) 100 Ti(C,O) 100
Ti3O5 4.6(8)
A430 Ti(C,O) 90.3(6) Ti(C,O) 95.5(7) Ti(C,O) 100 Ti(C,O) 100 Ti(C,O) 100
Ti3O5 9.7(8) γTi3O5 4.5(6)
A360 Ti(C,O) 77.7(6) Ti(C,O) 89.9(6) Ti(C,O) 100 Ti(C,O) 100 Ti(C,O) 100
Ti3O5 22.3(4) γTi3O5 6.9(5)
Ti5O9 3.9(7)
A280 Ti(C,O) 71.1(6) Ti(C,O) 69.9(3) Ti(C,O) 70.0(6) Ti(C,O) 88.8(4) Ti(C,O) 95.6(7)
Ti3O5 28.9(5) γTi3O5 2.4(5) γTi3O5 6.2 (5) Ti2O3 11.2(8) γTi3O5 1.5(9)
Ti2O3 22.9(4) Ti2O3 16.2(4) Ti2O3 1.5(9)
Ti5O9 4.8(6) Ti5O9 7.5(4) Ti5O9 1.5(8)
A200 Ti(C,O) 52.6(5) Ti(C,O) 41.9(4) Ti(C,O) 41.0(7) Ti(C,O) 45.7(6) Ti(C,O) 74.4(8)
Ti3O5 47.4(4) γTi3O5 22.1(6) γTi3O5 5.2(5) Ti2O3 54.3(7) γTi3O5 5.1(3)
Ti2O3 29.1(5) Ti2O3 50.1(5) Ti2O3 14.7(6)
Ti5O9 6.9(8) Ti5O9 3.7(8) Ti5O9 5.8(7)
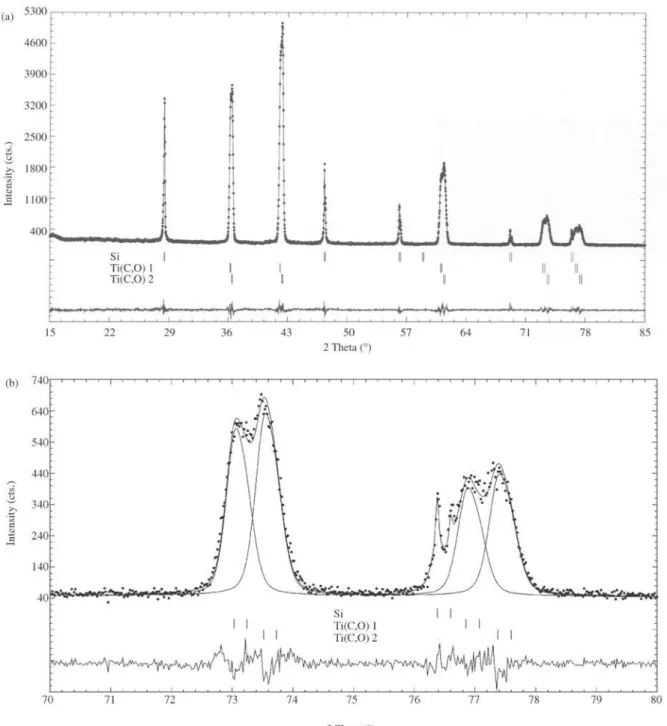
Figure 3. a) Final Rietveld plot for sample A360 treated at 1450 °C. b) Amplified plot of 70°-80° zone.
phases in order to obtain a good fitting of peak widths. Figure 3a shows the final Rietveld plot for sample A360 treated at 1450 and Fig. 3b is part of the same graphic am-plified to show the overlap of Ti(C,O) peaks belonging to different phases. In Fig. 3b, individual calculated profiles for both Ti(C,O) phases are also shown.
Within the temperature range used in these experiments,
the Ti (C, O) cubic phase is throughout the TiO-TiC axis (Fig. 4) as well as the Ti (C, N, O) cubic phases cover the triangular diagram completely (Fig. 1). The carbon content of samples A would allow to obtain the complete
composi-tion range (100% TiO to 100%TiC). In Table 2, ao values of
Table 6. Weight loss % in ZrO2 samples at different temperatures.
Sample/ 1400 °C 1460 °C 1500 °C 1600 °C 1650 °C
Temperature
B450 ~13 13 17 30 37
B300 9 12 15 30 31
B240 8 12 16 18 27
B210 9 12 16 20 24
B180 10 17 17 24 26
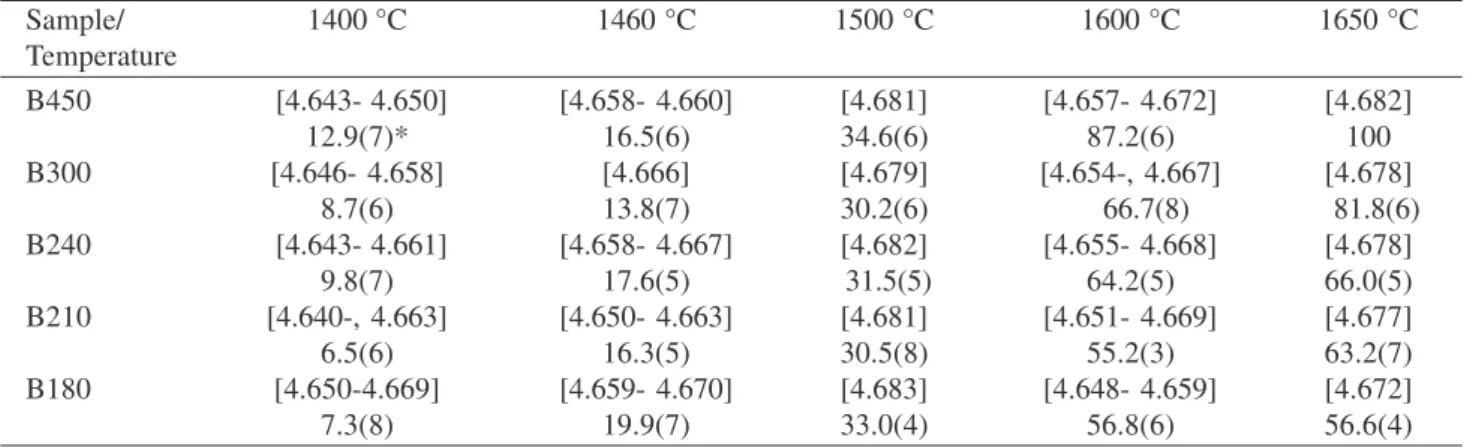
Table 5. Unit-cell parameter ao and weight % of Zr(C,O) for ZrO2 samples.
Sample/ 1400 °C 1460 °C 1500 °C 1600 °C 1650 °C
Temperature
B450 [4.643- 4.650] [4.658- 4.660] [4.681] [4.657- 4.672] [4.682]
12.9(7)* 16.5(6) 34.6(6) 87.2(6) 100
B300 [4.646- 4.658] [4.666] [4.679] [4.654-, 4.667] [4.678]
8.7(6) 13.8(7) 30.2(6) 66.7(8) 81.8(6)
B240 [4.643- 4.661] [4.658- 4.667] [4.682] [4.655- 4.668] [4.678]
9.8(7) 17.6(5) 31.5(5) 64.2(5) 66.0(5)
B210 [4.640-, 4.663] [4.650- 4.663] [4.681] [4.651- 4.669] [4.677]
6.5(6) 16.3(5) 30.5(8) 55.2(3) 63.2(7)
B180 [4.650-4.669] [4.659- 4.670] [4.683] [4.648- 4.659] [4.672]
7.3(8) 19.9(7) 33.0(4) 56.8(6) 56.6(4)
Note: Values between brackets are unit-cell parameters in Å.
* Values in parenthesis represent estimated standard deviations in the last quoted place for wt.% data. Table 3. Mean unit-cell parameters of titanium oxides obtained in the refinement
Phase a b c α β γ Space Group
Ti2O3 5.133(9) 5.133(9) 13.710(8) R-3C
Ti3O5 9.815(10) 3.788(10) 9.892(11) 91.50(3) C2/m
γ-Ti3O5 9.967(8) 5.075(9) 7.176(9) 109.10(9) I2/a
Ti5O9 5.589(7) 7.135(8) 8.862(6) 97.28(9) 112.73(8) 108.76(9) P1
Table 4. Weight loss % in TiO2 samples at different temperatures.
Sample/ 1250 °C 1350°C 1450 °C 1550 °C 1650°C
Temperature
A500 42 45 45 ~ 49 48
A430 41 45 46 46 46
A360 37 38 38 42 42
A280 31 32 35 36 37
A200 25 28 27 36 29
TiC0.73O0.27 (between 16 and 73 mol% of TiC). The
compo-sition range was determined using the calibration curve ao
vs. composition of Ti(C,O) (Fig. 4). This curve, from
Neuman et al.1, was determined from samples prepared by
reaction of pure TiO and TiC.
The values of ao tend to be higher with the increase of
reaction temperature. It is not possible to determine a
de-fined tendency of ao values changes with carbon content.
This little ao variation is due to the low slope in Fig. 4 where big changes in composition produce little shift of the unit cell parameter.
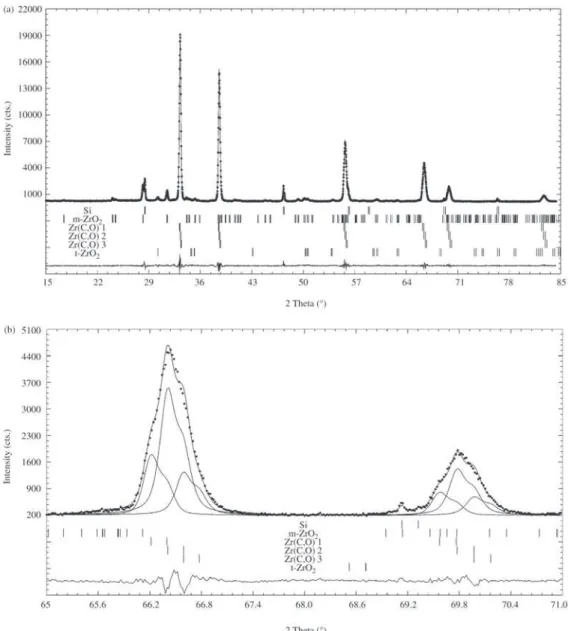
Figure 5. a) Final Rietveld plot for sample B450 treated at 1600 °C. b) Amplified plot of 61°-71° zone
phases are Ti3O5, γ-Ti3O5, Ti2O3, and Magnéli phases (TinOn+2) similar to those observed by other authors12. These
oxides become more important at low temperature and in samples with low carbon content. In Table 3 the refined unit-cell parameters of these phases are in good agreement with published data8-11.
The weight losses showed in Table 4 allow us to see that the reaction progresses with the increase of carbon content and temperature, being the obtained tendency consistent with the detected crystalline phases, within the margin of ex-perimental error.
Badeleyite carborreduction results (reaction B) for the 5 studied samples are shown in Tables 5 and 6.
All samples have enough carbon to obtain an oxicarbide as unique phase. Theoretically oxicarbide compositions
would be between ZrC0.45 O0.55 for B180 and ZrC for B300.
The zirconium phases obtained were: Zr(C,O) phase, monoclinic ZrO2 (badeleyite) and tetragonal ZrO2 in lower proportions. Figure 5a shows the final Rietveld plot for sam-ple B450 treated at 1600 °C and Fig. 5b is part of the same graphic amplified to show the overlap of Zr(C,O) peaks belonging to different phases. In Fig. 5b, individual calcu-lated profiles for all Zr(C,O) phases are also shown.
Badeleyite is the principal phase at temperatures lower than 1600°. The amount of this phase decreases with the increase of temperature and carbon content, being the mi-nority phase at higher temperatures. Mean unit-cell param-eters refined for badeleyite were: a = 5.151(3) Å, b = 5.210(5) Å, c = 5.318(5) Å and b = 99.27(4)° Å.
Tetragonal zirconia content was between 1 and 3 wt.%
in all samples containing ZrO2 presenting similar behavior
to the badeleyite.
Zr(C,O) increases with the increase of temperature and carbon content. It is the principal phase at a temperature of 1600° or higher.
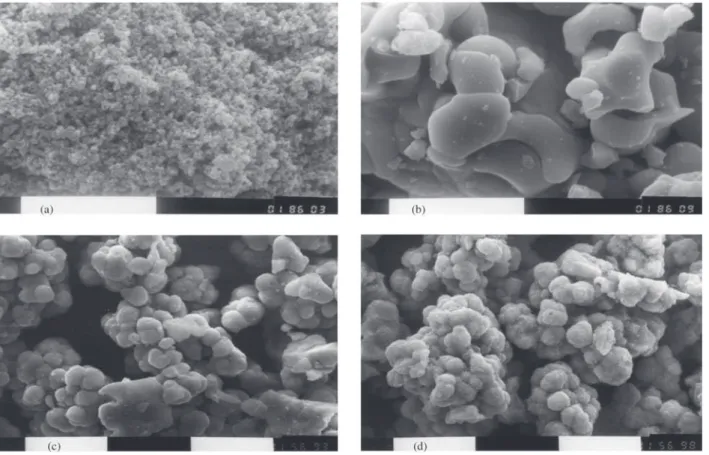
Figure 7. Micrographies (SEM) of reagents and products (scale: white bar = 10 µm). a) Anatase; b) A200 sample treated at 1650 °C; c) Badeleyite; d) B300 sample treated at 1650 °C.
The obtained values of ao (4.640 Å – 4.683Å) show that the formed oxicarbides were within the range ZrC0.46O0.54-ZrC0.9O0.1 (between 54 and 10 mol%.of ZrO). The composition range was determined using the calibra-tion curve ao vs. Zr(C,O) composition (Fig. 6). This curve,
from Kosolopova et al.4, was obtained from samples
pre-pared by reaction of pure Zr, ZrO2 and ZrC.
The Rietveld analysis shows that the wide peaks can be fitted using two or more phases M(C,O) indicating that the wide peaks are actually due to overlap of several narrow peaks. In almost all the samples, the use of two phases
al-lowed to have RBragg values near 2.85 for both M(C,O). The
Rexp are between 4.63 and 5.97 and the Rwp are between
9.20 and 15.56. This phenomenon can be observed in other systems where there are phases having changeable compo-sitions and unit-cell parameters associated13-15.
The crystal sizes of the Zr(C,O) and Ti(C,O) were cal-culated using the width of peaks (200) determined from the fitting results. Both phases presented similar behavior, with crystal size values between 560 Å and 3000 Å without a definite tendency.
Table 6 shows a weight loss increase with the increase of temperature in all samples. The carbon content has influ-ence at 1600 °C or higher temperatures when the Zr(C,O) is the principal phase. High weight loss values obtained
prin-cipally for sample B180 may be due to ZrO(g) loss
(reaction C).
ZrO2 + C → ZrO(g) + CO(g) (C)
ZrO(g) + 2C → ZrC + CO(g) (D)
But in samples with high carbon content, the ZrO(g) loss my be limited by reaction D.
Finally, reagents and reaction products were character-ized by scanning electron microscopy (SEM). Morphology variations caused by reactions were observed (Fig. 7).
When comparing the TiO2 reagent with the reaction
prod-ucts an important increase of the particle size is observed, indicating their sintering. This phenomenon can also be observed in low temperature samples. Besides, the TiO2 grain morphology and that of the products are different.
Nevertheless, B samples seem to preserve the morphol-ogy and size of the raw material that originates them (the badeleyite).
4. Conclusions
1. Carborreduction reactions of TiO2 and ZrO2 are a suit-able method to prepare oxycarbides of TiO-TiC and ZrO-ZrC systems respectively.
2. All oxycarbides obtained belong to MO-MC axes of MO-MC-MN system.
3. The carbon content of oxycarbides increased with
reaction temperature.
4. Carboreduction of TiO2 produced Ti(C,O) as unique
product at temperatures higher than 1450 °C and car-bon/mineral ratios higher than 0.360. In the other sam-ples some titanium oxides and suboxides were
ob-tained but non remainder TiO2 was detected.
5. Carboreduction of ZrO2 produced Zr(C,O) as unique reaction product.
6. The Rietveld method allowed to characterize titanium and zirconium oxycarbides obtained by carboreduction and also to refine unit cell parameters of minority phases.
7. The observation by SEM permitted to see the TiO2
and ZrO2 different behavior with regard to their
mor-phology modification during these reactions.
References
1. Neumann, G.; Kieffer, R.; Ettmayer, P. Über das System TiC-TiN-TiO, Monatshefte für Chemie, v. 103, p. 1130-1137, 1972. 2. Constant, K.; Kieffer, R.; Ettmayer,P.Über das pseudoternare
sys-tem ZrO-ZrN-ZrC, Monatshefte fur Chemie, v. 106, p. 823, 1975. 3. Krainer, H.; Konopicky, K. Untersuchungen von sinterhartmetallen.
Berg-und Huttenm. Mh. v. 92, p. 166, 1950.
4. Kosolapova, T.Y.; Fedorus, V.B.; Panasyuk, A.D.; Kotzina, G.K. Über das System ZrC-ZrO. Poroschkowaya metall. n.1, p. 109, 1972. 5. Young R.A, The Rietveld Method. IUCr, Oxford University Press,
NY, USA,1993.
6. Rodriguez-Caravajal,Abstracts of the Satellite Meeting on Powder Difraction of XV Congres of the IUCr, Toulouse, France, p.127, 1990.
7. Howard, C.J.; Hill, R.J.; Reichert, B.E. Structures of ZrO2 Polymorphs at Room Temperature by High-Resolution Neutron Powder Diffraction. Acta Crystallographica v. 44, p. 116-120, 1988. 8. Wyckoff, R.W.G. Crystal Structures, Interscience, New York, 1963. 9. Le Page,Y.; Strobel, P. Structural Chemistry of Magnéli Phases TinO2n-1(4 ≤ n ≤ 9). I Cell and Structure Comparisons, Journal of Solid State Chemistry, v. 43, p. 314-319, 1982.
10. Åsbrink S.; Magnéli A. Crystal Structure Studies on Trititanium Pentoxide, Ti3O5, Acta Crystallographica, v. 12, p. 575-581, 1959. 11. Hong, S.H.; Åsbrink, S. The structure of γ-Ti3O5, Acta
Crystallographica, v. B38, p. 2570-2576, 1982.
12. Afir, A.; Achour, M.; Saoula, N. X - ray Diffraction study of Ti-O-C system at high temperature and in continuous vacumm, Journal of Alloys and Compounds, v. 288, p. 124-140, 1999.
13. Mazzoni, A.D.; Aglietti, E.F.; Pereira, E. Carbonitriding of clay: Relation between the weight loss and crystalline phases during re-action, Journal of American Ceramic Society, v. 76, n. 9, p. 2337-2340, 1993.
14. Mazzoni, A.D. Conconi, M.S.; Aglietti, E.F., Synthesis of Zr-Si-O-N Phases by Carbonitriding Reaction, Characterization of Crys-talline Phases Using the Rietveld Method, Materials Research, v. 4, n. 2, p. 107-111, 2001.