S
IMULAÇÃO DO
C
LIMA DE
2050
EM
C
AMPO E SEUS
E
FEITOS SOBRE O
C
RESCIMENTO DE
F
ORRAGEIRAS
-
L
ÍVIA
H
AIK
G
UEDES DE
C
AMARGO
B
ORTOLIN
–
O
RIENTADOR:
D
R.
C
ARLOSH
ENRIQUEB
RITTO DEA
SSISP
RADOS
ÃOC
ARLOSE
STADO DES
ÃOP
AULO–
B
RASILU
NIVERSIDADE
F
EDERAL DE
S
ÃO
C
ARLOS
S
IMULAÇÃO DO
C
LIMA DE
2050
EM
C
AMPO E SEUS
E
FEITOS SOBRE O
C
RESCIMENTO DE
F
ORRAGEIRAS
-
L
ÍVIA
H
AIK
G
UEDES DE
C
AMARGO
B
ORTOLIN
–
S
ÃOC
ARLOSE
STADO DES
ÃOP
AULO–
B
RASILA
GOSTO DE2016
À minha amada família,
Meu marido, Carlos Henrique, pelo companheirismo, paciência, incentivo e apoio integral.
Meus filhos, Henrique, Augusto e Rodrigo, pela maturidade e compreensão apesar da tenra idade, pelo olhar terno e carinhoso e pela alegria em todos os momentos.
Meus pais, Saranita e João Otavio, pelos exemplos, conselhos e suporte.
Meus sogros, Alair e Moacir, pela disponibilidade e ajuda com as crianças.
Meus irmãos, Rafael e João, e cunhadas, Marina e Carolina, sempre ótimas companhias.
A
GRADECIMENTOSAo meu amigo e orientador, Dr. Carlos Henrique Britto de Assis Prado, faltam-me palavras para agradecer. Levarei comigo por toda a vida todo o conhecimento oferecido, os conselhos, as conversas formais e informais, a paciência em ensinar e as risadas em momentos de descontração. Mais importante foram o exemplo e o apoio. Em momentos tão difíceis de caráter pessoal e familiar pelos quais passei, sempre foi solícito em ajudar e em fazer o que estava além de sua função. Orientou e se fez presente quando eu não pude estar. Querido amigo Caique, deixo aqui minha homenagem por tudo o que representa para mim.
Ao professor Dr. Carlos Alberto Martinez y Huaman pela oportunidade de trabalhar em um projeto tão grandioso e importante. Sua competência e liderança foram essenciais para o desenvolvimento desse trabalho. Sinto-me honrada em ter participado dessa pesquisa.
A todos os colegas pesquisadores, pós-graduandos e graduandos da USP, UFSCar e outras instituições que participaram desse projeto, por toda ajuda, pronta disponibilidade e competência no trabalho. Em especial a Érique Castro, querido estagiário e meu “braço
direito” em toda a pesquisa.
À Fundação de Amparo à Pesquisa do Estado de São Paulo (FAPESP) pelo financiamento do projeto temático (Processo FAPESP 2008/58075-8) e pela concessão da bolsa de doutoramento (Processo FAPESP 2012/20847-5).
“O rio atinge seus objetivos, porque aprendeu a contornar os obstáculos.”
-
R
ESUMO EH
IPÓTESEG
ERAL-Essa pesquisa foi desenvolvida para entender as respostas climáticas de duas forrageiras tropicais a um cenário futuro previsto para 2050, independente da época do ano. Nós consideramos a hipótese do consórcio entre as duas forrageiras ser uma alternativa de pastagem em um clima futuro.
Para testar essa hipótese, nós estudamos as forrageiras sob controle de concentração de CO2 e temperatura em condições de campo utilizando um sistema denominado
Trop-T-FACE. Esse sistema nos deu competência para mimetizar condições atmosféricas previstas para 2050 (600 ppm de CO2 na atmosfera e aquecimento de 2 ºC na temperatura da cobertura
vegetal). A gramínea C4 Panicum maximum e a leguminosa arbustiva C3 Stylosanthes
capitata foram cultivadas como na prática agrícola vigente, em uma área de 2500 m2 no campus da Universidade de São Paulo em Ribeirão Preto – SP, Brasil.
No inverno de 2013 e outono de 2014 as forrageiras cresceram em consórcio irrigado. No outono de 2015, S. capitata cresceu em plantio solteiro sem irrigação. Dezesseis
parcelas em forma de anéis com 2 m de diâmetro foram utilizadas para o acompanhamento do crescimento e do desenvolvimento das espécies C3 e C4 durante períodos de aproximadamente
35 dias de crescimento após poda inicial. Vários níveis de organização vegetal foram acompanhados em condições de campo nas parcelas Controle, nas parcelas com elevada concentração de CO2 (eC), sob aquecimento (eT) e sob a combinação de tratamentos
(eC+eT).
No primeiro capítulo está descrito o experimento realizado no inverno de 2013, com
P. maximum em consórcio irrigado com S. capitata. As condições climáticas de temperatura
foram sub-ótimas para o crescimento da gramínea C4. Sendo assim, o aquecimento promoveu
claramente o desenvolvimento da folhagem. A maior concentração de CO2 atmosférico
provocou uma “regulação para baixo” (downregulation) no acúmulo de biomassa foliar. As alterações provocadas pelas mudanças atmosféricas causaram também modificações na concentração de N na folha e na partição de biomassa no corpo da planta. Sob o tratamento combinado (eC+eT), os efeitos inibitórios do aumento de CO2 na folhagem foram
o outono, os tratamentos aceleraram os eventos fenológicos foliares da gramínea C4, incluindo
o início da senescência. O aumento isolado na concentração atmosférica de CO2 (eC) ou em
combinação com o aquecimento (eC+eT) condicionou folhas mais estreitas, provavelmente por alteração no processo de formação do meristema foliar. As alterações na largura da folha podem provocar mudanças na qualidade da forragem e afetar o consumo pelo gado. No entanto, a presença de folhas estreitas foi compensada por um maior número de folhas e a biomassa por perfilho se manteve.
Por outro lado, a leguminosa C3 crescendo no consórcio irrigado durante o outono de
2014, apresentou várias alterações sem diferença estatística significativa para o crescimento vegetativo, apesar do aquecimento (eT) ter se mostrado prejudicial ao mesmo. Os resultados desse experimento estão descritos no terceiro capítulo. Por ser uma leguminosa adaptada a climas quentes, as principais alterações negativas observadas em S. capitata sob aquecimento
(eT) foram atribuídas à competição com P. maximum no consórcio. O aquecimento isolado
(eT) estimulou mais o crescimento da gramínea, que sombreou e atenuou a chegada de calor à leguminosa. No entanto, o aquecimento isolado (eT) estimulou significativamente o florescimento. No tratamento que simulou aquecimento e concentração de CO2 no clima de
2050 (eC+eT) ocorreu mais ramificações devido ao intenso florescimento no ápice do ramo e a consequente interrupção da dominância apical. O cenário previsto em clima futuro não é favorável apesar da biomassa foliar para essa espécie de C3 permanecer a mesma entre os
Para identificar a real influência da irrigação no crescimento de S. capitata, um novo
experimento foi realizado durante o outono de 2015, com S. capitata em plantio solteiro e sem
irrigação. O enriquecimento atmosférico com CO2 não incrementou nem a biomassa e nem a
área foliar. Por outro lado, ocorreu maior investimento em flores em detrimento dos compartimentos vegetativos no ramo. No entanto, o incremento do florescimento só foi possível com disponibilidade de água no solo superior a 0,3 m3 m-3. O aquecimento combinado com a reduzida disponibilidade de água no solo provocou elevada mortalidade dos ramos. A elevação da concentração de carbono atmosférico prevista para 2050 não será suficiente para compensar os efeitos negativos do aquecimento de cerca de 2 ºC na produção de biomassa foliar, em condições de campo sem irrigação, nessa leguminosa arbustiva C3.
concentration and temperature in field conditions using a system named Trop-T-FACE. This system gave us the competence to mimic atmospheric conditions predicted for 2050 (600 ppm of CO2 in the atmosphere (eC) and an increase of 2 ºC in the canopy temperature). The C4
grass Panicum maximum and the C3 legume Stylosanthes capitata grew on current
agricultural practice, in an area of 2500 m2 on the campus of the University of São Paulo in Ribeirão Preto – SP. We tested the hypothesis about the consortium between the two forages being a grazing alternative in a future climate.
In the winter of 2013 and the autumn of 2014, the forage grew on irrigated consortium. In the autumn of 2015, S. capitata grew in monoculture without irrigation.
Sixteen parcels in a ring form with 2 m of diameter were used for monitoring the growth and development of the species C3 and C4 species during growth periods of 35 days approximately
after the initial cut. Several plant organization levels were accompanied under field conditions in Control plots, plots with elevated CO2 concentration (eC), under heating (eT), and under
high CO2 concentration and heat (eC+eT).
In the first chapter is the experiment conducted during the winter of 2013, with P.
maximum in irrigated consortium with S. capitata. The climatic conditions of temperature
were suboptimal for the C4 grass growth. Thus, the warming explicitly promoted the foliage
development. The higher atmospheric CO2 concentration caused downregulation in leaf
biomass accumulation. The changes resultant of the atmospheric alterations also caused modifications of leaf N concentration and biomass partition in the plant. Under combined treatment (eC+eT), the inhibitory effects of the CO2 increase were offset by the increment
In the autumn of 2014, a new experiment was performed with P. maximum and S.
capitata growing in irrigated consortium. This experiment is described in the second and third
chapters.
In the second chapter are the results of P. maximum in irrigated consortium. The
purpose of conducting this experiment in the autumn was mainly to compare the influence of warming on the grass leaves in a warmer season. During the autumn, the treatments accelerated the leaf phenology of the C4 grass, including leaf senescence. The isolated
increase in the atmospheric CO2 concentration (eC) or combined with warming (eC+eT)
conditioned narrower leaves, probably by alterations in the leaf meristem formation process. Changes in leaf width may cause modifications in forage quality and affect the consumption by the cattle. However, the presence of narrower leaves was compensated by a greater number of leaves and the tiller biomass remained.
On the other hand, the C3 legume growing in irrigated consortium during the autumn
of 2014, presented several changes with no statistical differences in vegetative growth, despite the heat (eT) have been shown to be harmful to it. The results of this experiment are described in the third chapter. Being a legume adapted to warm climates, the main negative changes observed in S. capitata under warming (eT) were attributed to competition with P. maximum
in the consortium. The separate heating (eT) stimulated further growth of the grass, which shadowed and softened the heat arrival in the C3 species. However, the warming (eT)
significantly stimulated the flowering. In the treatment that simulated warming and CO2
concentration in the 2050 climate (eC+eT), there were more branches due intense flowering at the apex of the shoot and consequently interruption of apical dominance. The predicted future climate scenario is not favorable besides leaf biomass in this C3 species remaining the same
among applied atmospheric regimes. Furthermore, the irrigation of extensive grazing warmed areas is economically and ecologically unviable and did not increase the availability of leaf biomass of S. capitata in the consortium in the year 2050.
An experiment was conducted during the autumn of 2015, with the legume in monoculture without irrigation to identify the real influence of the irrigation on S. capitata
growth. CO2 atmospheric enrichment increased neither biomass nor the leaf area. On the other
-
L
ISTA DEF
IGURAS-
-The Trop-T-Face System -
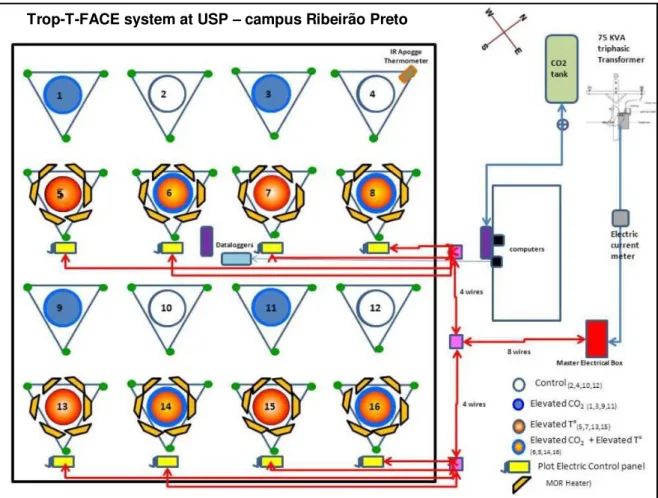
Fig. FACE 1. Experimental design of Trop-T-FACE system, located at University of São Paulo, in Ribeirão
Preto campus...22
Fig. FACE 2. CARBOCAP infrared gas analyzer (IRGA) Model GMP 343 (Vaisala, Finland) ...23
Fig. FACE 3. Gas release yellow pipes (A) with the automatic pressure regulator (SMC Corporation, ITV series, Japan) (B). The flow of each valve was controlled by a programmable control system using the microprocessor-based Proportional Integration Device (PID algorithm) (C)...23
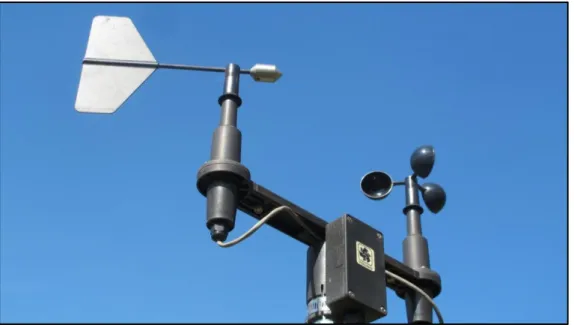
Fig. FACE 4. Anemometer...24
Fig. FACE 5. CO2 fumigation micro holes in outer ring side surrounding each plot...25
Fig. FACE 6. Central control of the Trop-T-FACE system inside the container near the field...25
Fig. FACE 7. Heaters model FTE-750-240 Salamander ceramic infrared heating elements, mounted on Salamander ALEX-F reflectors (Mor Electric, MI, USA) suspended at 0.8 m above the canopy...26
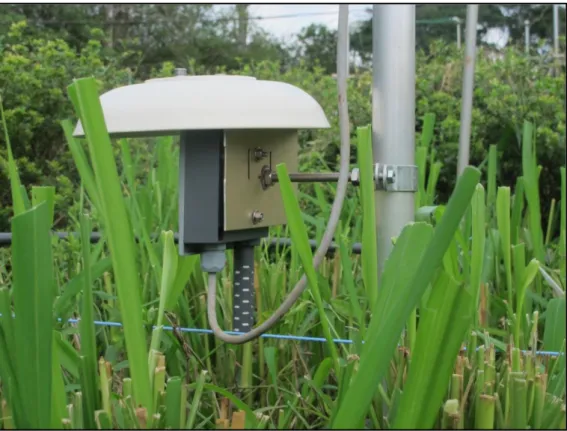
Fig. FACE 8. Infrared thermometer model SI-1H1-L20 (Apogee Instruments, USA) ...27
Fig. FACE 9. PID algorithm installed in a CR1000 data logger (A) with AM25T multiplexors (Campbell Scientific, USA) (B) ...27
Fig. FACE 10. Theta Probe soil moisture (ML2x) and temperature (ST2) sensors...28
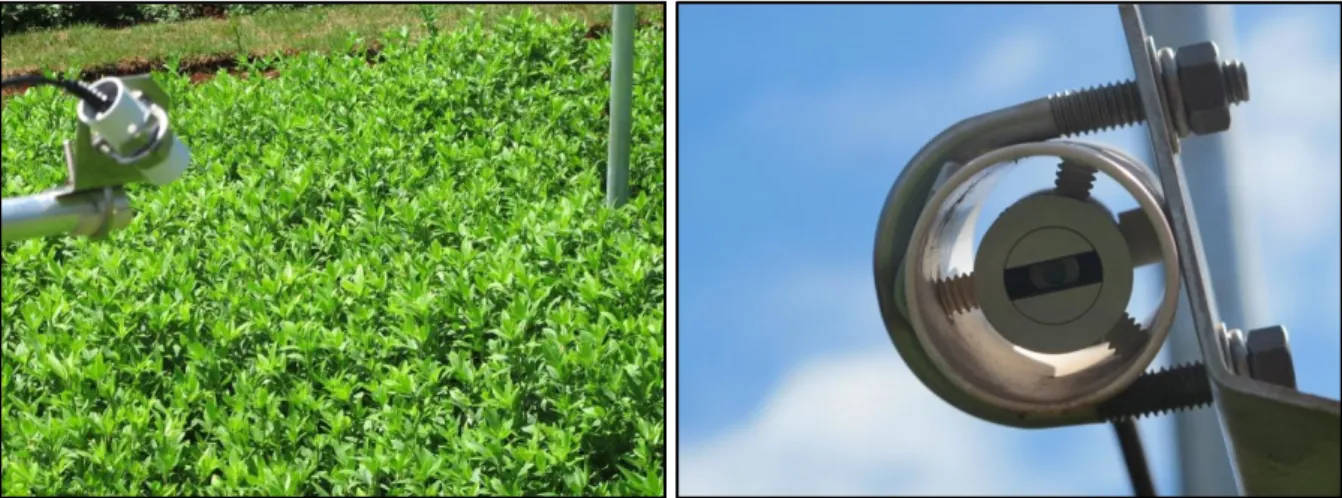
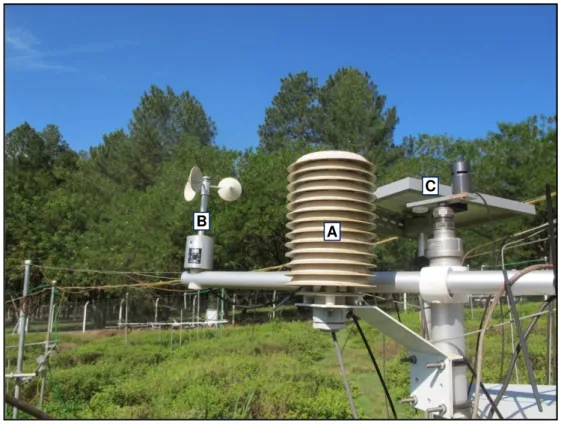
Fig. FACE 11. Automatic microclimatic station (WS-HP1) with a pluviometer (A), an anemometer (B) and a solar panel to capture solar irradiance (C) ...28
Fig. FACE 12. Water sprinklers suspended at the center of the plot...29
- Chapter 1 - Fig 1.1 Daily courses of meteorological conditions and soil temperature during the period of the experiment, from August 22 to September 20, 2013. A - Total solar radiation. B - Air relative humidity (RH) and air temperature. C - Soil temperature in control and heated plots. ...38
Fig 1.2 Canopy temperature during the period of the experiment, from August 22 to September 20, 2013. A - Canopy temperature of heated (solid line) and Control (dashed line) treatments. B - Difference (ΔT canopy) between heated and regular canopy temperatures indicating the deviations from the target elevated temperature of 2 ºC above the Control. ...39
Fig 1.3 Number of green (A), expanded (B), expanding (C), and senescent (D) leaves per tiller of Panicum maximum under ambient CO2 and canopy temperature (Control), under an elevated CO2 concentration of 600 ppm (eC), under an elevated canopy temperature of +2 ºC (eT), and under both treatments (eC+eT). Bars indicate average values and lines at the top of bars indicate the standard error. Different letters above bars indicate significant differences among datasets according to a Mann-Whitney test at p < 0.05. ...40
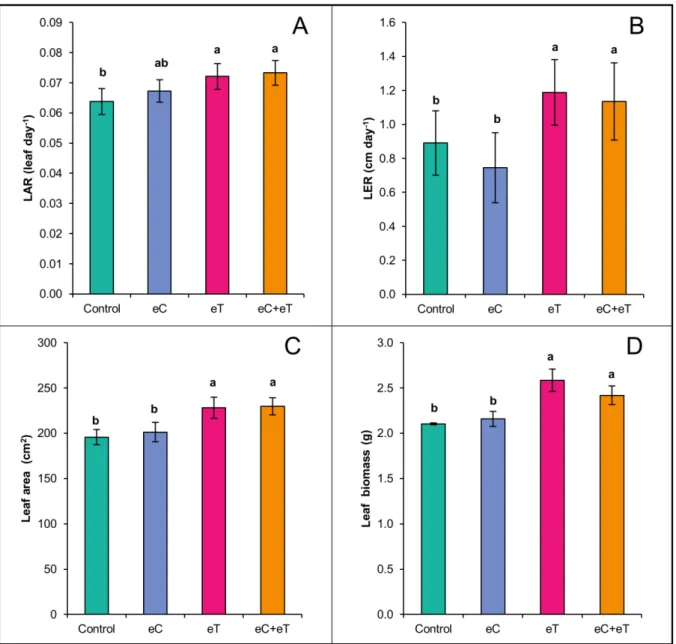
Fig 1.4 Leaf appearance rate (LAR, A), leaf elongation rate (LER, B), leaf area (C), and leaf biomass (D) per tiller of Panicum maximum under regular CO2 and canopy temperature (Control), under elevated CO2 concentration of 600 ppm (eC), under elevated canopy temperature of +2 ºC (eT), and under both treatments (eC+eT). Bars show average values and lines at the top of the bars show the standard error. Different letters above bars indicate significant differences among datasets according to a Mann-Whitney test at p < 0.05. ...41
Fig 1.5 The leaf/stem biomass ratio (A) and leaf nitrogen content (B) of Panicum maximum under regular concentration of CO2 and canopy temperature (Control), under elevated CO2 concentration of 600 ppm (eC), under elevated canopy temperature of +2 ºC (eT), and under both treatments (eC+eT). Bars show average values and lines at the top of the bars the standard error. Different letters above the bars indicate significant differences among the datasets after the Mann-Whitney test at p < 0.1. ...42
respectively, with the averages and the temperature difference between them (∆). ...59
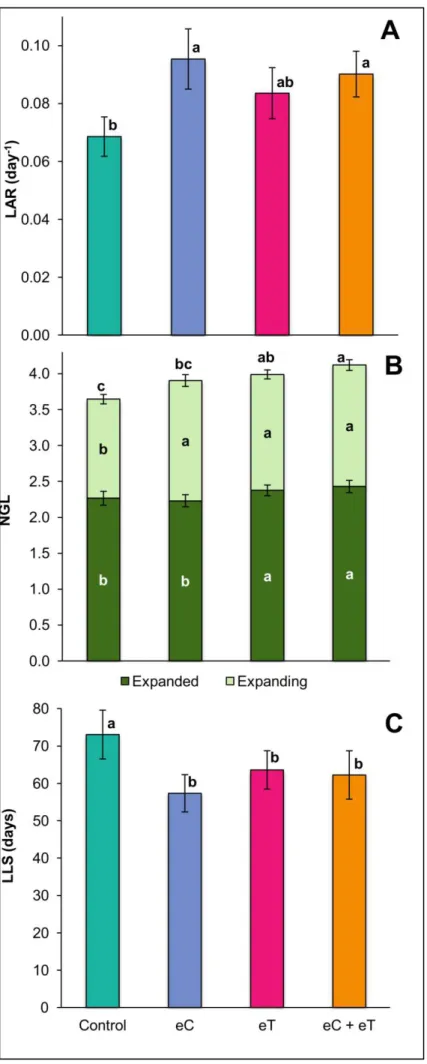
Fig 2.2 Leaf appearance rate (LAR, A), number of green leaves (NGL, B), and leaf lifespan (LLS, C) per tiller of
Panicum maximum under ambient CO2 and temperature (Control), under 600 ppm of CO2 (eC), under elevated temperature at 2 °C above ambient (eT), and under both treatments (eC+eT). Bars show average values and lines at the top of bars the standard error. Different letters above and inside the bars indicate significant differences among data sets after the Mann-Whitney test at p<0.1. The two different colored bar of (C) shows two categories of leaves (expanded and expanding leaves). The size of these two bars considered together represents the NGL.. ...62
Fig 2.3 Leaf elongation rate (LER, A), final leaf length (FLL, B), average maximum expanding leaf width (MLW, C), and stem length (SL, D) per tiller of Panicum maximum under ambient CO2 and temperature
(Control), under 600 ppm of CO2 (eC), under elevated temperature at 2 ºC above ambient (eT), and under both treatments (eC+eT). Bars show average values and lines at the top of bars the standard error. Different letters above bars indicate significant differences among datasets after the Mann-Whitney test at p<0.1. ...64
Fig 2.4 Leaf area (a) and biomass (b) per tiller of Panicum maximum under ambient CO2 and temperature
(Control), under 600 ppm of CO2 (eC), under elevated temperature at 2 ºC above ambient (eT), and under both treatments (eC+eT). Bars show average values and lines at the top of bars the standard error. Different letters above and inside bars indicate significant differences among data sets after the Mann-Whitney test at p<0.1. The two different colored bar of (b) indicate leaves or stem biomass and lines at the top of bars the standard error. The size of these two bars considered together represents the tiller biomass. The number and letters inside the black boxes below bars represent leaf:stem biomass ratio with statistical comparisons. ...65
Fig 2.5 Biomass as a function of leaf area per tiller of Panicum maximum under ambient CO2 and temperature
(Control), under 600 ppm of CO2 (eC), under elevated temperature at 2 ºC above ambient (eT), and under both treatments (eC+eT). In the graphic are demonstrated the equation of the function, the R-square value, and the n value as the number of leaves evaluated. ...66
Fig 2.6 Width as a function of length of intact expanding leaves per tiller of Panicum maximum under ambient
CO2 and temperature (Control), under 600 ppm of CO2 (eC), under elevated temperature at 2 ºC above ambient (eT), and under both treatments (eC+eT). In the graphic are demonstrated the equation of the function, the R-square value, and the n value as the number of leaves evaluated. ...68
- Chapter 3 -
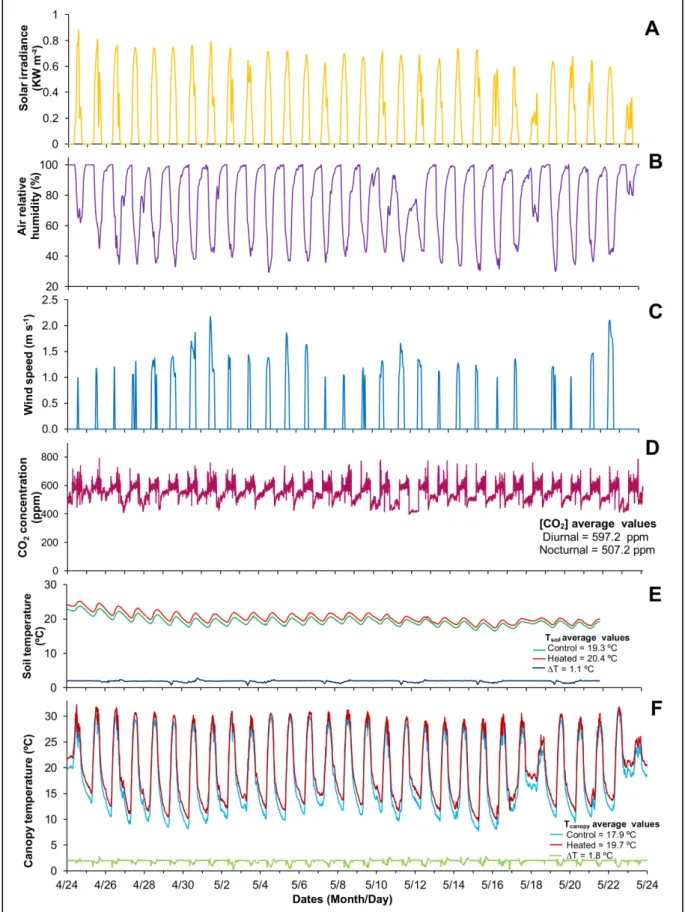
Fig 3.1 The daily courses of total solar irradiance (A), air relative humidity (B), and wind speed (C) recorded
from April 24th 2014 to May 24th 2014 at the center of the experimental area. It is also showed the CO2 concentration in the enriched atmosphere (D) with average values of noctural and diurnal CO2 concentration, and the soil (E) and the canopy (F) temperatures in heated and in control regimes, respectively, with the averages and the temperature difference between them (∆). ...84
Fig 3.2 Total dry biomass per shoot (A) and daily dry biomass gain of leaf per shoot (B) of Stylosanthes capitata growing in consortim with Panicum maximum under ambient CO2 and temperature (Control),
(eC+eT). Bars show the averages and lines at the top of the bars the standard error values. Different letters above bars indicate significant differences among datasets after the Mann-Whitney test at p<0.1. 86
Fig 3.3 Final shoot length (A), and the number of leaves (B) and ramifications (C) per shoot of Stylosanthes capitata growing in consortim with Panicum maximum under ambient CO2 and temperature (Control),
600 ppm of CO2 (eC), elevated temperature at 2 ºC above ambient (eT), and under combined treatments (eC+eT). It is also showed the number of leaves (D), the leaf biomass (E) and the number of ramifications (F) per centimeter of shoot. Bars show average values and lines at the top of bars the standard error. Different letters above bars indicate significant differences among datasets after the Mann-Whitney test at p<0.1. ...87
Fig 3.4 Number of flowers per shoot and number of flowers per flowered ramification of Stylosanthes capitata
growing intercorped with Panicum maximum under ambient CO2 and temperature (Control), 600 ppm of
CO2 (eC), elevated temperature at 2 ºC above ambient (eT), and in combined treatments (eC+eT). Bars show average values and different letters at the top of bars indicate significant differences. The numbers in the panel at the left corner of the graph indicate the flowering percentage and different letters in front of the number indicate significant differences. Differences were tested by Fisher exact test at p<0.1...89
Fig 3.5 Average values of number of ramifications (A) and flowers (B) per initial marked shoots of Stylosanthes
capitata growing intercorped with Panicum maximum under ambient CO2 and temperature (Control), 600
ppm of CO2 (eC), elevated temperature at 2 ºC above ambient (eT), and in combined treatments (eC+eT) throughout the experimental period. ...90
- Chapter 4 -
Fig 4.1 The daily courses and the average values ± standard deviation at midday of total solar irradiance (A),
relative air humidity (B), and wind speed (C) recorded from April 30th to June 17th 2015 at the center of the experimental area. It is also showed the soil temperature (D) in each treatment with the average differences between the treatments and Control (∆). The average between the plots with ambient CO2 and temperature (Control) and with 600 ppm of CO2 (eC) is represented by a continuous line. The average between the plots with elevated temperature at 2°C above ambient (eT) and with the combined treatments (eC+eT) is represented by a dotted line. The soil water content (E) was obtained in plots with ambient CO2 and temperature (Control), 600 ppm of CO2 (eC), elevated temperature at 2°C above ambient (eT), and in the combined treatments (eC+eT). The arrows with numeric values on (E) represent the most significant rainfall (mm) along the experimental period. ... 107
Fig 4.2 Daily courses of canopy temperature recorded from April 30th to June 17th 2015. The average between
the plots with ambient CO2 and temperature (Control) and with 600 ppm of CO2 (eC) is represented by a dotted line. The average between the plots with elevated temperature at 2°C above ambient (eT) and with the combined treatments (eC+eT) is represented by a continuous line. The average difference between the treatments and Control are also showed as the ∆ value. ... 108
Fig 4.3 Survivorship percentage of shoots of Stylosanthes capitata growing under ambient CO2 and temperature
(Control), 600 ppm of CO2 (eC), elevated temperature at 2°C above ambient (eT), and the combined treatments (eC+eT). Bars show the percentages and different letters at the top of the bars indicate significant differences among them after Chi-square test (p<0.1). ... 110
Fig 4.4 Leaf, stem and total shoot biomass of Stylosanthes capitata growing under ambient CO2 and temperature
(Control), 600 ppm of CO2 (eC), elevated temperature at 2°C above ambient (eT), and the combined treatments (eC+eT). Bars show the averages and lines at the top the standard error values. Different letters above bars indicate significant differences among corresponding datasets after the Mann-Whitney test (p<0.1). Numbers at the base of the bars representing leaf and stem are the percentages in relation to the total shoot biomass. ... 111
Fig 4.5 Leaf area per shoot (A) and leaf area per cm of shoot (B) of Stylosanthes capitata growing under ambient
CO2 and temperature (Control), 600 ppm of CO2 (eC), elevated temperature at 2°C above ambient (eT), and the combined treatments (eC+eT). Bars show the averages and lines at the top the standard error values. Different letters above bars indicate significant differences among datasets after the Mann-Whitney test (p<0.1). ... 111
Fig 4.6 Number of flowers per shoot (A) and number of flowers per flowered ramification (B) of Stylosanthes
capitata growing under ambient CO2 and temperature (Control), 600 ppm of CO2 (eC), elevated
-
L
IST OFA
BBREVIATIONS-
Treatments
eC CO2 atmospheric enrichment (600 ppm CO2)
eT Canopy warming (2 ºC above current temperature)
eC+eT CO2 atmospheric enrichment (600 ppm CO2) and canopy warming (2 ºC above
current temperature)
Panicum maximum parameters
FLL Final Leaf Length
LAR Leaf Appearance Rate
LER Leaf Elongation Rate
LLS Leaf Lifespan
MLW Maximum Leaf Width
NGL Number of Green Leaves
PHY Phyllochron (LAR-1)
SL Stem Length
Climate classification
CA Camargo
KG Köppen - Geiger
TH Thornthwaite
Other abreviations
FACE Free Air Carbon Dioxide Enrichment
GHG Greenhouse gas
IPCC Intergovernmental Panel on Climate Changes
OTC Open Top Chamber
1.1 Introduction ...31
1.2 Materials and Methods ...33
1.2.1 Experimental area, plant material, soil preparation, and sowing...33
1.2.2 Trop-T-FACE system, watering, and treatments ...34
1.2.3 Foliage measurements and data analysis ...34
1.3 Results ...37
1.4 Discussion...45
1.5 Conclusions ...49
Chapter 2 -Leaf ontogeny in a C4 pasture under a future climate scenario ...50
Abstract ...50
2.1 Introduction ...51
2.2 Material and methods ...54
2.2.1 Experimental area, species, planting, and standardization...54
2.2.2 The Trop-T-FACE system, the watering facilities, and the treatments ...55
2.2.3 Foliage measurements and data analysis ...55
2.3 Results ...58
2.3.1 Meteorological data ...58
2.3.2 Growth results ...61
2.3.3 Leaf ontogeny ...67
2.4 Discussion...70
2.5 Conclusions ...74
Chapter 3 - Growth of forage C3 legume intercropped with C4 grass under simulated future climate ...75
Abstract ...75
3.1 Introduction ...76
3.2 Materials and methods ...79
3.2.1 Experimental area, species, planting, and standardization...79
3.2.2 The Trop-T-FACE system, the watering facilities, and the treatments ...80
3.2.3 Measurements on crown and data analysis ...80
3.3 Results ...83
3.3.1 Meteorological conditions ...83
3.3.2 Vegetative growth ...86
3.3.3 Reproductive growth and phenology ...88
3.4 Discussion...91
3.4.1 Vegetative growth and environmental conditions ...91
3.4.2 Reproductive growth and phenology ...94
3.4.3 Final considerations ...95
3.5 Conclusion ...97
Chapter 4 - Rain-fed growth and flowering of forage C3 legume in future climate ...98
Abstract ...98
4.1 Introduction ...99
4.2 Material and Methods ... 103
4.2.1 Experimental area, species, planting, and standardization... 103
4.2.2 Treatments in the Trop-T-FACE facility ... 104
4.2.3 Measurements of the shoots ... 104
4.2.4 Statistics ... 105
4.3.1 Climate and soil water content ... 106
4.3.2 Vegetative and reproductive growth ... 109
4.4 Discussion... 116
4.5 Conclusion ... 120
Conclusões para 2050 ... 121
Conclusions for 2050 ... 122
The thematic project involved several research institutions and researchers, making possible the development of institutional research and training people with experience and knowledge in the use of the FACE system. Moreover, it allowed the improvement in the process of collecting and processing data. Also, the research provided theoretical material for the development of new techniques of pasture management and public policy for maintaining the production of meat and milk.
Teamwork was essential throughout the process. The members of all research groups of thematic project could cooperate with each other, allowing excellent results and productive research. Four scientific papers resulted from the research presented in this thesis, one for each chapter. Also, it will be produced and published a literature review gathering all these results to existing data in the literature, critically and at various organizational levels of the plants. The literature review is expected to be published after the publication of four scientific articles cited above.
The first chapter was published in PLoS ONE (DOI: http://dx.doi.org/10.1371/journal.pone.0149620)
in the year 2016. The second chapter is being finalized to be submitted in Planta. The third chapter was accepted
under major review in PLoS ONE. The fourth chapter was submitted in Annals of Botany, together with leaf
-
B
ASICL
ITERATURE-
I
NTRODUCTIONAt the beginning of the Industrial Revolution, the atmospheric concentration of CO2
was about 280 ppm (1). Currently, it reaches values above 400 ppm. The average annual CO2
concentration for the year 2015 was 401.85 ppm (2). It is a significant increasing since 1960 when 320 ppm of CO2 was recorded at the Mauna Loa Observatory in Hawaii (2). Projections
estimate a future atmospheric CO2 concentration above 600 ppm for the year 2050 and may
exceed 800 ppm by the end of the century (3,4). The higher CO2 concentration may influence
the energy balance of the Earth (5).
Several activities have contributed to rising global atmospheric concentration of carbon dioxide. These activities are, primarily, the increasing use of fossil fuels, industrial processes as the concrete production and land use change such as deforestation, forest burns, and agriculture. The cement industry is responsible for approximately 3% of global emissions of greenhouse gases (GHG) and for almost 5% of total CO2 emissions (6). According to
Brazilian Ministry of Technology, Science, and Innovation (MTCI), the contribution of energy production for emissions of GHG has increased from 16% in 2005 to 32% in 2010 in Brazil (7). GHG emissions from agriculture correspond to 35% of all Brazilian GHG emission mostly due to the use of nitrogen fertilizers and the methane resulting from the digestive processes of cattle (7).
Among the GHG, CO2 is the main gas related to plant growth by participating
directly in photosynthesis. The Brazilian Institute of Geography and Statistics (8,9), stated that forest burns and changes in land use contributed for more than 75% of the CO2 emission
in Brazil. Deforestation resultant from the woods burns to deploy pastures and agriculture further aggravates the situation by reducing the uptake of carbon from the atmosphere by trees and the amount of water transported daily to the atmosphere by plant transpiration (10).
The increase in GHG emissions causes global warming and climate change. Probably the CO2 is no longer primarily responsible for the greenhouse effect, but it may have been the
originator. CO2 probably served as a trigger, i.e. after the rise of the CO2 concentration, the
Fourth and fifth reports of Intergovernmental Panel on Climate Changes (IPCC) (1,3) indicated a high correlation between the increasing of GHG concentration and the average rising of Earth surface temperature. The increase in CO2 atmospheric concentration and other
GHG have lead to unprecedented changes in the Brazilian climate according to National Institute for Space Research (INPE) from Brazil and the UK Met Office-Hadley (13).
The IPCC (3) uses a range of future scenarios based on social, technological, economic, and environmental conditions for predicting the atmospheric CO2 concentration
and temperature, and projects an increase in the surface temperature of 2 ºC by 2050 with very different stages of human development in a scenario named B1. This less pessimistic emission scenario designs a future CO2 atmospheric concentration of 600 ppm for the year
2050 (3,4,14). Along with increased CO2 atmospheric concentration and the rise of global
average atmospheric temperature (1), there are changes in rainfall patterns in many regions of the Earth (11). These climate changes will have a significant economic and ecological impact on grassland and forests (15) because heating and the greater availability of CO2 will affect
plant growth, development, and yields (5,16). Since forages are directly exposed to atmosphere conditions in the field, climate change will significantly impact the management of pastures (17).
concentration and warming have not yet been evaluated under field conditions in Brazil. Studies on tropical forages are necessary and relevant for predict future impacts and provide adequate management. Heating and greater availability of CO2 in the atmosphere will impact
impact on grassland and forests (27).
Carbon dioxide plays a major role in plant metabolism because it is the single carbon source for the photosynthetic production of carbohydrates. The current atmospheric concentration of CO2 is lower for saturating photosynthesis especially for C3 plants (28).
Thus, C3 species respond positively to increased atmospheric CO2 concentrations (29).
Stimulation of photosynthesis by increasing CO2 concentration has been widely described
(4,27,30–33). On the other hand, as a consequence of CO2 increase, plant photorespiration
may reduce. Recently, has been suggested that the reduction of photorespiration-photosynthesis ratio in response to the ~100 ppm CO2 increase over the 20th century was ca.
25% (34). Mathematical models predict that CO2 concentration at 600 ppm could raise C3
photosynthesis up to 40% (4). Panicum maximum (C4) and Stylosanthes hamata (C3)
produced 67 and 85% more fresh and dry biomass, respectively, under 600 + 50 ppm CO2 in
open top chambers (OTC) (35). The increase in atmospheric CO2 concentration caused a rise
of 30% in the dry biomass production in a pasture based on two C3 forages (Lolium perenne
and Trifolium repens) growing in experimental rooms (36,37). Elevated CO2 concentrations
also caused 25% increase in yield of C3 legume Arachis glabrata growing intercropped with
C4 grass Paspalum notatum in a temperature-gradient greenhouse (38). Besides physiological
adaptations, this increment is also coupled with leaf anatomical alterations, such as increased mesophyll size and chloroplasts numbers per cell (39). On the other hand, the stimulation of photosynthesis in C3 plants under 500-600 ppm CO2 was significantly lower (14%) in field
experiments conducted on free-air carbon dioxide enrichment, the FACE system (19,31,40). It happens because the concentration of CO2 is lower in FACE than OTC (4). Also, in FACE
there is a direct influence of external factors on plants (41), setting the results of FACE closer to the reality (31,41). Moreover, elevated atmospheric CO2 concentration may partially offset
photosynthetic capacity up-regulation and by better access to water (42). Nonetheless, for each 1.0 ºC increment in seasonal temperature, a reduction between 3-16% in crop yield is expected (16,43) due to increased respiration and photorespiration in C3 species.
Plants clearly respond to increased CO2 concentrations. Even for some C4 species,
the current concentration of atmospheric CO2 is below the CO2 saturation point for net
photosynthesis (44). Indeed, some results from OTC studies have found that an elevated CO2
concentration can stimulate biomass production in C4 species (35,45). However, the net
photosynthesis and growth of C4 species are less responsive than those of C3 species under
elevated CO2 (31). In contrast to physiological responses, information on morphological
alterations in the leaf blades of C4 grasses under future climatic change is scarce. This is an
Anatomical and morphological traits of leaf blade in Panicum maximum are related
to animal preference and may influence consumption and digestibility, thus interfering in forage quality (46). Considering this, leaf width and length provide valuable complementary information on using this grass as fodder in the future (46). These leaf morphological parameters are closely related to leaf meristematic activity. The activity of meristems plays central roles in plant developmental processes (48). The investigation of the responses of meristems to the environment may contribute to understanding the plant growth since it depends on the supply of new cells produced by meristems (48) and it reflects on plant plasticity and adaptation to the environment. Two meristems control leaf growth: 1. shoot apical meristem, which gives rise to leaf meristem and is responsible for the leaf width; and 2. leaf meristem, responsible for the leaf growth in length (48).
In C3 crops, the growth temperature above a finely tuned threshold can trigger
flowering, bypassing the need for other inductive stimuli (49). High temperature during flowering may lower CO2 effects by reducing grain number, size and quality (50). Increased
temperatures may also reduce CO2 effects indirectly, by increasing water demand (50). The
combination of 450 ppm CO2 concentration and 0.8 ºC temperature increased yield by
approximately 5.3% in rain-fed spring wheat (51). Nonetheless, the combination of 450 ppm CO2 concentration and 1.8 °C warming reduced wheat yield by roughly 5.7% (51). As the
increase in CO2 atmospheric concentration also leads to a rise in temperature, forecast how C3
T
HE CONSORTIUM WITHC
3 ANDC
4 FORAGESThe prediction of less advantage of C4 plants regarding C3 species under high CO2
concentration does not necessarily happen in ecosystems. C4 species growth is as sensitive as
C3 species to changes in CO2 concentration especially when the water supply constrains
growth, a common condition in pastures containing C4 species (52). Higher temperatures will
likely increase the response to CO2 in warm season grassland (52). Besides, environmental
conditions in subtropical climate are favorable to C4 species and should remain favorable
under elevated CO2 (52). C4 forages must be affected by CO2 concentration increase without
losing the greatest relative biomass production capacity, and higher nutrients use efficiency (52). Also, availability of water in the systems is limited. A sudden improvement in the availability of soil moisture under elevated CO2 may favor the C4 species that were not as
affected by water stress (52).
Threatened water resources, changes in precipitation pattern and global warming are factors that interact strongly with the C4 plants growth responses to increasing atmospheric
CO2 (25). These conditions will influence competition between C3/C4 and among shrubs/grass
(25). In a consortium between Abutilon theophrasti (C3) e Amaranthus retroflexus (C4), CO2
increases the intensity of plant-plant interactions and increases the growth of survived individuals (5). Probably rapid growth leads to a fierce competition by other features that rapid growth requires, affecting the survival of plants.
Mortality and difference in the sizes of Abutilon theophrasti (C3) e Amaranthus
retroflexus (C4) are increased with the rise of temperature and CO2 concentration (53). The
characters variation is higher under high CO2 concentration and/or high temperature. This
response may indicate significant events, such as acclimatization and change in floral phenology by changing the size of the reserves for flowering (53). As the size of the individual is often related to fertility, an increase in size in response to elevated CO2, together
with the decreased survival of individuals can result in a smaller population (53). The changes in response to elevated CO2 may cause a reduction in the minimum size of the individual for
the time of beginning of flowering (53). It may lead to a lower population as a result of accelerated growth and greater competition for resources, particularly nutrients (53).
The consortium between Stylosanthes guianensis cv. Mineirão (C3 legume) and
P. maximum cv. Mombaça produced approximately 3200 kg ha-1 of dry matter in
monoculture. In a consortium with S. guianensis cv. Mineirão, this production has increased
to about 4500 kg ha-1 (54). Also, Panicum maximum intercropped with Stylosanthes hamata in
open top chambers at a 600 ± 50 ppm CO2 increased the plant height and biomass production
-
T
HET
ROP-T-FACE
S
YSTEM-
The Trop-T-FACE system is a new combined Free-air Temperature and CO2
Controlled Enhancement system to evaluate the performance of tropical pastures under future climate change scenarios. The FACE component for elevated CO2 treatments under field
conditions was a modified POPFACE sonic injection system of pure CO2 designed by our
colleagues (58). Sixteen plots were created inside rings with a diameter of 2 m. A small FACE system named miniFACE provided the treatment of elevated CO2 on eight of these
plots. The eight plots of miniFACE were placed randomly within the experimental area so that no ring was less than 10 m from another to minimize CO2 cross-contamination (Fig.
FACE 1).
Fig. FACE 13. Experimental design of Trop-T-FACE system, located at University of São Paulo, in Ribeirão
Preto campus.
The CO2 was sampled at the center of each miniFACE ring by an air pump and
monitored by a high-speed gas analyzers CARBOCAP infrared gas analyzer (IRGA) Model
Fig. FACE 14. CARBOCAP infrared gas analyzer (IRGA) Model GMP 343 (Vaisala, Finland).
Fig. FACE 15. Gas release yellow pipes (A) with
the automatic pressure regulator (SMC Corporation, ITV series, Japan) (B). The flow of each valve was controlled by a programmable control system using the microprocessor-based Proportional Integration Device (PID algorithm) (C).
B
The CO2 concentration measured at the center of each miniFACE ring and the wind
speed determined by an anemometer located 2 m above the ground in the center of the plantation area (Fig. FACE 4) were integrated with PID determining the voltage of the valve and thus the rate of release of pure CO2 in each ring (Fig. FACE 5). CO2 fumigation began at
sunrise and ended at sunset each day. All variables (CO2 concentration, valve voltage, and
wind speed) were recorded every minute on a computer located in the central control of the miniFACE system inside a container near the plantation (Fig. FACE 6). The CO2 treatments
consisted of two concentrations of CO2. In four separated plots out of miniFACE, there was
the actual environmental CO2 concentration at approximately 400 ppm (Fig. FACE 1). In
eight miniFACE plots, then plants were under elevated CO2 concentration in 50% of the
environmental concentration at 600 ppm (Fig. FACE 1).
Fig. FACE 17. CO2 fumigation micro holes in outer ring side surrounding each plot.
Fig. FACE 18. Central control of the Trop-T-FACE system inside the container near the field.
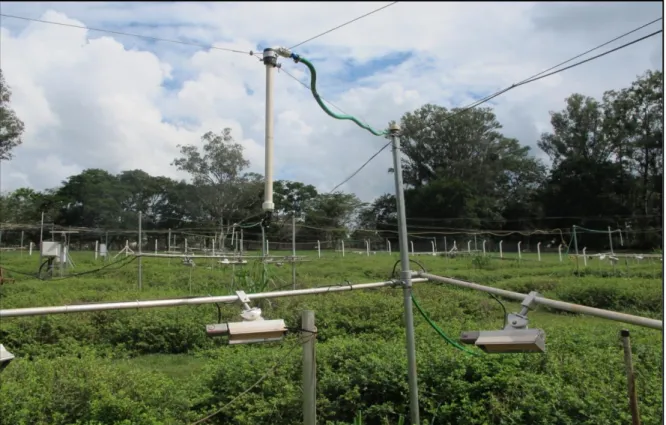
MI, USA (Fig. FACE 7)) and stayed suspended from a triangular aluminum pole system. There were six heaters per plot, with a heater at each point of the hexagon. A similar array of dummy heaters consisting of aluminum reflectors without a heating element was installed in the reference plots to produce a consistent amount of shade between the warmed and reference plots.
Fig. FACE 19. Heaters model FTE-750-240 Salamander ceramic infrared heating elements, mounted on
Salamander ALEX-F reflectors (Mor Electric, MI, USA) suspended at 0.8 m above the canopy.
Fig. FACE 20. Infrared thermometer model SI-1H1-L20 (Apogee Instruments, USA).
Fig. FACE 21. PID algorithm installed in a CR1000 data logger (A) with AM25T multiplexors (Campbell Scientific, USA) (B).
Theta Probe soil moisture (ML2x) and temperature (ST2) sensors (Fig. FACE 10) connected to a data logger DL2e (Delta-T Devices, UK) monitored, respectively, the soil water content and the soil temperature in each ring. An automatic microclimatic station (WS-HP1) monitored and continuously stored the climatic data (temperature, relative humidity, irradiance, and precipitation) using specific sensors (Fig. FACE 11). Once the plants were grown under field conditions, soil and air moisture were monitored continuously. There were water sprinklers for irrigating the entire area of all 16 plots during the period of the experiments with irrigation (Chapters 1-3) for maintaining the soil moisture near field
B
capacity (Fig. FACE 12). In the experiment without irrigation (Chapter 4), the sprinklers were used only during the implementation of the area.
Fig. FACE 22. Theta Probe soil moisture (ML2x) and temperature (ST2) sensors.
Fig. FACE 23. Automatic microclimatic station (WS-HP1) with a pluviometer (A), an anemometer (B) and a
solar panel to capture solar irradiance (C).
A B
Publicado em PLoS ONE, em 19 de fevereiro de 2016. DOI: http://dx.doi.org/10.1371/journal.pone.0149620
-
1
-
L
EAF DYNAMICS OFP
ANICUM MAXIMUM UNDER FUTURECLIMATIC CHANGES
A
BSTRACTPanicum maximum Jacq. ‘Mombaça’ (C4) was grown in field conditions with
sufficient water and nutrients to examine the effects of warming and elevated CO2
concentrations during the winter. Plants were exposed to either the ambient temperature and regular atmospheric CO2 (Control); elevated CO2 (600 ppm, eC); canopy warming (+2 ºC
above regular canopy temperature, eT); or elevated CO2 and canopy warming (eC+eT). The
temperatures and CO2 in the field were controlled by temperature free-air controlled
enhancement (T-FACE) and mini free-air CO2 enrichment (miniFACE) facilities. The most
green, expanding, and expanded leaves and the highest leaf appearance rate (LAR, leaves day-1) and leaf elongation rate (LER, cm day-1) were observed under eT. Leaf area and leaf biomass were higher in the eT and eC+eT treatments. The higher LER and LAR without significant differences in the number of senescent leaves could explain why tillers had higher foliage area and leaf biomass in the eT treatment. The eC treatment had the lowest LER and the fewest expanded and green leaves, similar to Control. The inhibitory effect of eC on foliage development in winter was indicated by the fewer green, expanded, and expanding leaves under eC+eT than eT. The stimulatory and inhibitory effects of the eT and eC treatments, respectively, on foliage raised and lowered, respectively, the foliar nitrogen concentration. The inhibition of foliage by eC was confirmed by the eC treatment having the lowest leaf/stem biomass ratio and by the change in leaf biomass-area relationships from linear or exponential growth to rectangular hyperbolic growth under eC. Besides, eC+eT had a synergist effect, speeding up leaf maturation. Therefore, with sufficient water and nutrients in winter, the inhibitory effect of elevated CO2 on foliage could be partially offset by elevated
temperatures and relatively high P. maximum foliage production could be achieved under
future climatic change.
Keywords – elevated CO2 concentration, forage, leaf development, leaf phenology,
Publicado em PLoS ONE, em 19 de fevereiro de 2016. DOI: http://dx.doi.org/10.1371/journal.pone.0149620 of future scenarios based on social, technological, economic, and environmental conditions to predict the atmospheric CO2 concentration and the Earth’s surface temperature. The IPCC
projects an increase in the surface temperature of 2 ºC by 2050 with very heterogeneous stages of human development in a scenario named A2. In this scenario, the concentration of atmospheric CO2 will be around 600 ppm (28). Heating and the greater availability of CO2
will affect plant growth, development, and yields (5,16). Since forages are directly exposed to atmosphere conditions in the field, climate change will significantly impact the management of pastures (17).
Brazil has been the world’s largest meat exporter since 2008, with 200 million head of cattle, and the value of the meat and milk production chains has been estimated at US$31 billion (18). The favorable climate and large size of Brazil contribute to this success. However, despite the great importance of ranching, the effects of climate change on forages and their acclimation to the combined effects of elevated CO2 concentration and warming
have not yet been evaluated under field conditions in Brazil. In fact, there is a multi-biome gap in experimental data from the tropics and subtropics on plant responses to future climatic changes (19,20).
Plants clearly respond to increased CO2 concentrations, since even for some C4
species, the current concentration of atmospheric CO2 is below the CO2 saturation point for
net photosynthesis (44). Indeed, some results from open-top chamber studies have found that an elevated CO2 concentration can stimulate biomass production in C4 species (35,45).
However, the net photosynthesis and growth of C4 species are less responsive than those of C3
species under elevated CO2 (31). In contrast to physiological responses, information on
morphological alterations in the leaf blades of C4 grasses under future climatic change is
Publicado em PLoS ONE, em 19 de fevereiro de 2016. DOI: http://dx.doi.org/10.1371/journal.pone.0149620 The purpose of this work was to determine the effects of future climate change on foliar growth and the stages of leaf development in tillers of Guinea grass (Panicum maximum
Jacq.) following the A2 scenario. The major C4 grasses used as forage for cattle in Brazil
belong to the genera Panicum and Brachiaria (46). Our results will support pasture
management in farms in future climate changes since the experiment was carried out under field conditions using a mini Free-air Carbon Dioxide Enrichment (miniFACE) system and a Temperature Free-air Controlled Enhancement (T-FACE) system.
We hypothesized that a temperature increase of 2 ºC will stimulate foliage production in P. maximum, especially if there is no water shortage. This would be possible,
especially in winter, because P. maximum is a C4 tropical forage with a high optimal leaf
temperature for photosynthesis (30 ºC –40 ºC) (60,61). Heating probably stimulates the rate of leaf expansion, as found in C4 buffel grass Cenchrus ciliaris, resulting in higher foliar area
and biomass (45). On the other hand, an elevated CO2 concentration will promote little or no
change in leaf area and leaf biomass of P. maximum since the C4 photosynthetic pathway
already acts as a CO2 concentration mechanism (62). Nonetheless, if leaf growth rate, leaf
area, and leaf biomass will increase under warming in winter, the effect of elevated CO2 on
heated leaves of P. maximum in the field would be hard to predict. Therefore, we tested the
leaf dynamics of P. maximum under current conditions and the predicted A2 atmospheric
Publicado em PLoS ONE, em 19 de fevereiro de 2016. DOI: http://dx.doi.org/10.1371/journal.pone.0149620 classification is efficient in macroscale, so we also considered the Thornthwaite classification (TH) which is efficient in mesoscale (65). According to TH, Ribeirão Preto city shows the B2rB’4a’ classification (66), a humid climate, with little or no water deficiency in dry season
from April to September (66,67). The Camargo climate classification (CA) combines the simplicity of KG with the accuracy of TH using an agroclimatic zoning (65). According to CA, Ribeirão Preto city shows the TR-SBi classification, a subhumid tropical climate with dry winter (65). Historical data from 1982 to 2012 present the average annual temperature and rainfall of 21.9 ºC and 1508 mm, respectively (68). For the period August-September, the historical data (1982-2012) show an average temperature of 21.2 ºC, with minimum and maximum temperatures of 14.2 ºC and 28.2 ºC, respectively (68).
According to the U.S. Department of Agriculture and "Embrapa Solos" in Brazil, the soil in the area is a dystrophic Red Latosol (Oxisol) (69). The area is fenced, and soil analysis, contouring, railing, and soil pH correction by liming had been performed previously. The value of the average initial pH was 4.0 to 4.5 and remained at 5.0 to 5.5 after liming. Chemical soil fertilization happened after pH correction according to the initial nutrient availability. Therefore, the soil was appropriate and homogeneous at the time of planting.
Seeds of Guinea grass, Panicum maximum Jacq. (Poaceae), were planted into holes
Publicado em PLoS ONE, em 19 de fevereiro de 2016. DOI: http://dx.doi.org/10.1371/journal.pone.0149620 1.2.2TROP-T-FACE SYSTEM, WATERING, AND TREATMENTS
The Trop-T-FACE system was previously described (Section ‘The Trop-T-FACE
system’, pages 22 to 29). The experiment occurred from 22nd August to 20th September 2013, during winter, with Panicum maxium in irrigated consortium with Stylosanthes capitata.
The design of this experiment to evaluate foliar growth and stages of leaf development in tillers of P. maximum included four treatments: ambient conditions (Control),
an atmospheric CO2 concentration elevated to 600 ppm (eC), a canopy temperature elevated
2°C above the ambient temperature (eT), and both an elevated CO2 concentration and canopy
temperature (eC+eT). Each treatment had four replicates, totaling 16 experimental units.
1.2.3FOLIAGE MEASUREMENTS AND DATA ANALYSIS
Foliage growth and stages of leaf development were set in the context of the tiller, the basic unit of growth in grasses. Three randomly equidistant tussocks of P. maximum were
selected in each plot. Five tillers were chosen per tussock, resulting in 15 tillers per plot for assessing foliage. Since the experiment was performed with four replicates per treatment, 60 tillers were measured per treatment. Data collection took place on August 22 and 29 and September 3, 9, 12, 19, and 20 in 2013.
Foliage traits recorded on each date included the number of expanded and expanding leaves (with and without visible ligule, respectively), the number of senescent leaves (with at least 50% of the area yellowing), and the length of the expanding leaves. From these measurements, average values per tiller were obtained in each treatment, and the following parameters were calculated.
The number of leaves that emerged in each period between data collection days was named the leaf appearance rate (LAR, day-1). We obtained LAR as the number of leaves from
the current data collection day minus the number of leaves from the previous data collection day, with only positive values considered. The final LAR in a corresponding treatment was obtained by summing all positive values from each measurement time divided by the number of days in the entire experiment (30 days). This parameter indicated the rate of the appearance of leaves per tiller. Among the original 60 tillers marked per treatment, 58, 56, 56, and 57 in the Control, eC, eT, and eC+eT treatments, respectively, were usable for obtaining the average value of LAR.
Publicado em PLoS ONE, em 19 de fevereiro de 2016. DOI: http://dx.doi.org/10.1371/journal.pone.0149620 without green color. The NGL was calculated as the total number of expanded and expanding leaves on each data collection day. An average NGL value was obtained for the entire experimental period to show how many functional leaves were maintained in each treatment. The total number of leaves considered was 349, 351, 358, and 349 in the Control, eC, eT, and eC+eT treatments, respectively. From the seven data collection days, it was possible to calculate the average number of green, expanded, expanding, and senescent leaves per tiller in each treatment.
From the data collection days, it was possible to compute the expanded, expanding, and senescent leaves accumulated per tiller. The accumulated values were obtained as the number of leaves on the first data collection day plus the number of leaves on subsequent data collection days. Trimming at the beginning of the experiment cut some expanding and expanded leaves, causing a permanent, typical scar on the leaf blade. In contrast, leaves that expanded after pruning had a typical intact apex. Therefore, it was possible to count the number of intact and cut green leaf blades among the expanded and expanding leaves per tiller. The leaf area of P. maximum was measured using the WinDIAS Leaf Image Analyses
System (Delta-T, UK). The marked tillers of P. maximum in the field were collected intact by
cutting their stem base at the ground level at the end of the experiment (21 September). The leaves were detached, and the area per tiller was measured. The foliage of each identified tiller was dried separately in a stove with forced air circulation at 60°C to obtain the leaf biomass. In addition, the foliar nitrogen content, N%, was determined in each ring using expanded and expanding leaves (the green leaves) by the semi-micro-Kjeldahl methodology (70). Overall, four measurements of foliar nitrogen were carried out, and the average N% was obtained for each treatment at the end of the experiment.
Publicado em PLoS ONE, em 19 de fevereiro de 2016. DOI: http://dx.doi.org/10.1371/journal.pone.0149620
Fig 1.1 Daily courses of meteorological conditions and soil temperature during the period of the experiment, from August 22 to September 20, 2013. A - Total solar radiation. B - Air relative humidity (RH) and air temperature. C - Soil temperature in control and heated plots.
Publicado em PLoS ONE, em 19 de fevereiro de 2016. DOI: http://dx.doi.org/10.1371/journal.pone.0149620
Fig 1.2 Canopy temperature during the period of the experiment, from August 22 to September 20, 2013. A -
Canopy temperature of heated (solid line) and Control (dashed line) treatments. B - Difference (ΔT canopy) between heated and regular canopy temperatures indicating the deviations from the target elevated temperature of 2 ºC above the Control.
Publicado em PLoS ONE, em 19 de fevereiro de 2016. DOI: http://dx.doi.org/10.1371/journal.pone.0149620
Fig 1.3 Number of green (A), expanded (B), expanding (C), and senescent (D) leaves per tiller of Panicum maximum under ambient CO2 and canopy temperature (Control), under an elevated CO2 concentration of 600
ppm (eC), under an elevated canopy temperature of +2 ºC (eT), and under both treatments (eC+eT). Bars indicate average values and lines at the top of bars indicate the standard error. Different letters above bars indicate significant differences among datasets according to a Mann-Whitney test at p < 0.05.
Publicado em PLoS ONE, em 19 de fevereiro de 2016. DOI: http://dx.doi.org/10.1371/journal.pone.0149620
Fig 1.4 Leaf appearance rate (LAR, A), leaf elongation rate (LER, B), leaf area (C), and leaf biomass (D) per
tiller of Panicum maximum under regular CO2 and canopy temperature (Control), under elevated CO2
concentration of 600 ppm (eC), under elevated canopy temperature of +2 ºC (eT), and under both treatments (eC+eT). Bars show average values and lines at the top of the bars show the standard error. Different letters above bars indicate significant differences among datasets according to a Mann-Whitney test at p < 0.05.
Publicado em PLoS ONE, em 19 de fevereiro de 2016. DOI: http://dx.doi.org/10.1371/journal.pone.0149620 (Fig 1.4B). In the Control treatment, there was a nonlinear increase in leaf biomass as a function of leaf area (Fig 1.6A). However, in the eC treatment the leaf biomass-area relationship had a rectangular hyperbolic response with a higher degree of correlation (Fig 1.6B). Alternatively, leaf biomass and area had a linear relationship in the eT treatment (Fig 1.6C and D). This indicates that there were important differences in leaf blade formation among treatments.
Fig 1.5 The leaf/stem biomass ratio (A) and leaf nitrogen content (B) of Panicum maximum under regular
Publicado em PLoS ONE, em 19 de fevereiro de 2016. DOI: http://dx.doi.org/10.1371/journal.pone.0149620
Fig 1.6 Average values of leaf biomass as a function of leaf area per tiller of Panicum maximum under regular
atmospheric CO2 concentration and canopy temperature (Control, A), under elevated atmospheric CO2 concentration of 600 ppm (eC, B), under elevated canopy temperature of +2 ºC (eT, C), and under both treatments (eC+eT, D).
Publicado em PLoS ONE, em 19 de fevereiro de 2016. DOI: http://dx.doi.org/10.1371/journal.pone.0149620
Fig 1.7 Accumulated number of expanded (A), expanding (B), and senescent (C) leaves; and the mean number
of cut-expanded leaves (D) per tiller of Panicum maximum growing under different atmospheric conditions. A -
Publicado em PLoS ONE, em 19 de fevereiro de 2016. DOI: http://dx.doi.org/10.1371/journal.pone.0149620 experiment, since the maximum temperature did not reach 35 ºC even at midday. Thus, an increase of 1 ºC –2 ºC above the regular temperature during winter (Fig 1.2) probably led to a significant difference in the carbon net assimilation after 30 days in Panicum maximum.
Further, the increase in leaf temperature towards the optimum for photosynthetic activity promoted foliage production (Figs. 1.3A, B, and C, Fig 1.4, and Fig 1.7A and B). Besides, eT did not favor leaf senescence or limit the survival of cut-expanded leaves. Consequently, high leaf area and leaf biomass was observed when eT was applied alone or in combination with eC. Indeed, since the eT treatment had the most expanded and expanding leaves, it had the highest number of green leaves per tiller.
The benefits of elevated CO2 to C4 crop species are controversial. C4 crops benefit
from elevated CO2 only under drought that causes low stomatal conductance and an increased
concentration of intercellular CO2 and water use efficiency (72). However, the supply of C4
acids may exceed the carboxylation capacity, resulting in the leaking of CO2 from the bundle
sheath under a high atmospheric CO2 concentration (73). In this sense, the downregulation of
the molecular components of C4 carbon assimilation may occur under a high atmospheric CO2
concentration. Actually, the carboxylation efficiency and CO2 saturation rate of
photosynthesis were lower in the C4 crop Sorghum bicolor grown free of water stress at
elevated CO2 (700 ppm, growth chamber), accompanied by a 49% reduction in the
phosphoenolpyruvate carboxylase content of leaves (74). In addition, the carboxylation efficiency and the activities of C4 enzymes in Zea mays were reduced in a growth chamber
with CO2 enrichment at 750 ppm (75).
An increase in leaf area and leaf biomass allocation is not expected to be concomitant with the downregulation of photosynthetic enzymes under high CO2
concentrations. Indeed, the leaf area and LAR did not change in C4 Zea mays under 750 ppm