Spectroscopy: Comparison of Techniques, Storage Periods and Photo-activation Methods
*e-mail: [email protected]
Degree of Conversion of Z250 Composite Determined by Fourier
Transform Infrared Spectroscopy: Comparison of Techniques, Storage
Periods and Photo-activation Methods
Andresa Carla Obicia, Mário Alexandre Coelho Sinhoretia*, Elisabete Frollinib, Lourenço Correr Sobrinhoa, Simonides Consania
aFaculdade de Odontologia de Piracicaba, UNICAMP Av. Limeira 901, Bairro Areião, 13414-903 Piracicaba - SP, Brazil
bInstituto de Química de São Carlos, USP C.P. 780, 13560-970 São Carlos - SP, Brazil
Received: June 1, 2004; Revised: August 23, 2004
The purpose of this study was to evaluate the degree of conversion (DC) of the Z250 compos-ite, using six photo-activation methods, two storage periods and two preparation techniques of the FTIR specimens (n = 3). For the KBr pellet technique, the composite was placed into a metallic mold and photo-activated as follows: continuous light, exponential light, intermittent light, stepped light, PAC and LED. The measurements were made after 24 h and 20 days. For the resin film technique, approximately 0.07 g of the composite was pressed between two polyester strips, photo-activated as above described and analyzed. The DC was calculated by the standard technique and submitted to ANOVA and Tukey’s test (α = 5%). Independently of the storage period and speci-men preparation technique, there were no significant differences among photo-activation meth-ods. No statistical difference was observed between the time periods used. The specimens analyzed under the KBr pellet technique presented higher DC values than those analyzed by the resin film technique.
Keywords:dental materials, composite resin, degree of conversion, FTIR, photo-activation methods, depth of cure
1. Introduction
Restorative composite resins are composed by a resin-ous matrix (organic phase), in which silanizated fillers are dispersed. This matrix is typically a mixture of at least two dimethacrylate monomers. In general, one of the monomers is relatively viscous, nominated as base monomer, whilst the other one presents a low viscosity, the diluent monomer. The dimethacrylates frequently employed as base monomers in Dentistry are Bis-GMA and UDMA, as a diluent monomer is used TEGDMA. This combination results in a material with good handling properties.
The base monomers decrease polymerization shrinkage due to their relatively large molecular volume and, in the case of Bis-GMA, the stiffness of the molecule results in increased elastic modulus of the polymer. Conversely, the diluent monomer improves copolymer conversion due to its greater flexibility, lower molecular volume and lower viscosity, which provides greater mobility to the system1,2.
With regard to the light cured composites, the final prop-erties of the material depend upon light curing, which diffi-cult the description of the ideal curing method. Although optimization of the mechanical and physical properties of a composite is desirable, it is important to minimize polym-erization shrinkage, in order to preserve the tooth/restora-tion interface integrity3,4.
in-tensity is the most common and well known6,9. Some varia-tions in technique may be performed in an attempt to re-duce polymerization shrinkage, whilst maintaining the DC. Such variations include stepped light10-13, exponential light14 and intermittent light12. Another method employs the plasma arc curing (PAC) lamps, which provide a high intensity in a short time15. Finally, the light emitting diode (LED) can also be used to initiate the photo-activation process in the com-posite resin16,17.
Irrespective of the photo-activation method, the DC should be higher as possible. However, Bis-GMA and UDMA based dental composites exhibit incomplete con-version of double bonds, ranging between 43-85 %13,15,18-21, due to the complex reaction mechanism.
FTIR spectroscopy has been extensively used to deter-mine the DC of dental composites18,20-24. However, the tech-niques for FTIR analysis and the time periods required af-ter specimen preparation are not well established. The lit-erature reports two techniques for FTIR analysis: potassium bromide (KBr) pellet18,20 and thin resin films15,20-24. Time periods reported can range from immediately after speci-men preparation to up to some days18,20-24.
The purpose of this study was to evaluate the DC of the Z250 composite resin, using six photo-activation methods (continuous light, exponential light, intermittent light, stepped light, PAC And LED), two time periods (24 h and 20 days), and two preparation techniques of the FTIR speci-mens (Potassium Bromide [KBr] pellet and thin resin film).
2. Materials and Methods
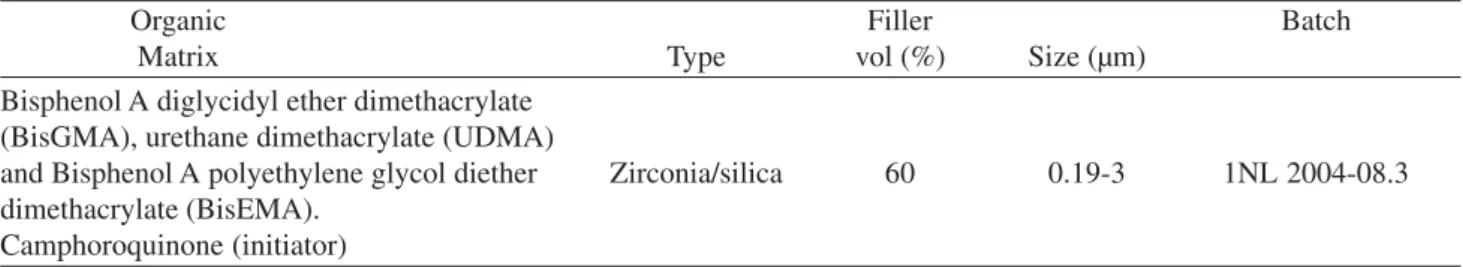
The present study used the Z250 composite resin, shade A3 (3M, St. Paul, MN, USA). Composition and batch number are listed in Table 1. The samples to be analyzed by FTIR spectroscopy were prepared by two techniques: po-tassium bromide (KBr) pellet and thin resin films. Concern-ing about KBr pellet technique, the FTIR analysis was per-formed with specimens submitted to two storage periods: 24 h and 20 days.
For the KBr pellet technique, 0.11 g of the composite was placed in a circular brass matrix of 6 mm in diameter and 2 mm in height. The composite was then covered with a polyester strip and pressed with a glass slab to accommo-date the material into the matrix. Photo-activation was
per-formed as it follows: a) continuous light; b) exponential light; c) intermittent light; d) stepped light; e) PAC, or; f) LED. For the continuous light photo-activation method, the cur-ing tip was positioned close to the brass matrix/restorative composite. The photo-activation was performed for 40 s with a light intensity of 800 mW/cm2, using Elipar Trilight curing unit (3M-ESPE, Seefeld, Germany). For the expo-nential light technique, the same curing unit was used, how-ever, the light intensity began at zero, increasing gradually to 800 mW/cm2, with a total exposure time of 40 s. Curing with the intermittent light method was performed using a device made in the Dental Materials Department, Dental School of Piracicaba, UNICAMP, which provided 2 s of light with intensity of 600 mW/cm2 and 2 s without light. The total exposure time was 80 s. The stepped light method was performed using a XL 2500 curing unit (3M-ESPE, Seefeld, Germany), which provided an initial 10-second exposure of the activating light with an intensity of approxi-mately 150 mW/cm2, maintaining a distance of nearly 2.0 cm to the specimen. The curing tip was then positioned close to the brass matrix/restorative composite, resulting in an in-creased light intensity of 650 mW/cm2, which was main-tained for additional 30 s. For the PAC technique, the Apollo 95 E curing unit was used (DMD, Westlake, Village, CA, USA) which, according to manufacturer’s information, achieved an intensity of 1320 mW/cm2. The exposure time was 3 s. Finally, for the LED method, a LEC 470 l curing unit (M M Optics, São Carlos - SP, Brazil) was used to photo-activate the composite, providing an intensity of 100 mW/cm2 for 40 s. The light intensity of the curing units was measured with a radiometer (Curing Radiometer, model 100, Demetron/Kerr, Danbury, CT, USA), with the exception of the Apollo 95 E curing unit.
After photo-activation, the polymerized composite resin was pulverized into fine powder with a hard tissue-grind-ing machine (Marconi, model MA590, Piracicaba - SP, Bra-zil). The pulverized composite was maintained in a dark room until the moment of the FTIR analyzes. Ten milli-grams of the ground powder was thoroughly mixed with one hundred milligrams of KBr powder salt. This mixture was placed into a pelleting device (Aldrich, Milwaukee, WI, USA) and then pressed in a hydraulic press (Carver Labo-ratory Press, model 3648, Wabash, St. Morris, USA) with a
Table 1. Composition of organic matrix and filler of the Z250 composite resin.
Organic Filler Batch
Matrix Type vol (%) Size (µm)
Bisphenol A diglycidyl ether dimethacrylate (BisGMA), urethane dimethacrylate (UDMA)
and Bisphenol A polyethylene glycol diether Zirconia/silica 60 0.19-3 1NL 2004-08.3 dimethacrylate (BisEMA).
Spectroscopy: Comparison of Techniques, Storage Periods and Photo-activation Methods
load of eight tons, to obtain a pellet. This pellet was then placed into a holder attachment into the spectrophotometer (Bomem, model MB-102, Quebec - Canada) for analysis. For this technique, the specimens were made and analyzed after two storage periods: 24 h and 20 days.
For the thin resin film technique, approximately 0.07 g of the composite was placed between two polyester strips and pressed with two plain glass slides, on either side of the material. The thin resin film (60-70 µm) was photo-acti-vated according to the same methods as described before. After 24 ± 1 h, the thin films were separated from the poly-ester strips and analyzed by the FTIR spectrophotometer. The uncured composite resin was analyzed using a metallic siliceous window. The measurements were recorded in ab-sorbance, with a FTIR spectrometer (Bomem, model MB-102, Quebec, Canada) operating under the following con-ditions: 300-4000 cm-1 wavelength; 4 cm-1 resolution; 32 scans. The percentage of unreacted carbon-carbon dou-ble bonds (% C=C) was determined from the ratio of ab-sorbance intensities of aliphatic C=C (peak at 1638 cm-1) against internal standard before and after curing of the speci-men: aromatic C…C (peak at 1610 cm-1) and urethane N…H (peak at 1537 cm-1). The degree of conversion was deter-mined by subtracting the % C=C from 100%. All experi-ments were carried out in triplicate. The data were analyzed by ANOVA and the means were compared by Tukey’s test (5% of significance level).
3. Results and Discussion
According to the results presented in Tables 2 and 3, all photo-activation methods showed no statistical difference among themselves (p > 0.05) for DC values, inspective of the FTIR technique and period of storage. These results in-dicate that all tested methods were able to appropriately cure Z250 composite, despite the differences (e.g. energy den-sity) among them. Several factors may be responsible for
such a similarity among the photo-activation methods, in-cluding spectral distribution of the light emitted by the cur-ing unit, the polymerization process itself and the nature of the monomer system.
The energy density is the product of the output of the curing unit (in mW/cm2) and the time of irradiation (in sec-onds), and is an important parameter of the curing unit4,15,25, keeping the distance between the curing tip and the speci-men surface constant. On this study, the energy densities of the tested photo-activation methods varied greatly, ranging between 3.96 and 32 J/cm2. However, this variation did not affect the DC values of the specimens tested. Variations in DC may be the consequence of other factors that affect the conversion of the material (spectral distribution of light, the polymerization reaction itself and monomer system), as well as the variations in the property measurements of the out-put of the curing unit obtained. Mills et al.26 showed that the output of the curing unit differs greatly when it is meas-ured using a commercial dental radiometer designed for office use or when measured with a power meter, which shows the distribution of the light output across the spec-trum. Differences also exist among commercial radiometers and these measurement variations result in different den-sity energies. In this study, it was employed a headpiece radiometer to obtain the light intensity.
Camphoroquinone presents an absorption peak at a wavelength of 468 nm. Hence, the closer the curing unit is wavelength to this absorption peak, the greater its ability to activate camphoroquinone and, thus, to initiate the polym-erization process. Although LED devices usually achieve lower light intensity (and lower energy density) than halo-gen curing units, the wavelength peak of the LED curing unit is 466 nm16, i.e. very close to the camphoroquinone absorption peak. According to Nemoto27, the narrow wave-length spectrum emitted by LED devices lies within the 450-490 nm range, a range which appropriately
polymer-Table 2. Means of DC according to analyzed periods and photo-activation methods, for the KBr pellet technique.
Photo-activation DC after 24 h DC after 20 days
method (%) (%)
Continuous light 66.25 (2.55) a A 62.64 (1.98) a A Intermittent light 63.74 (2.37) a A 59.14 (5.24) a A Stepped light 62.94 (4.92) a A 62.17 (6.26) a A LED 62.14 (10.15) a A 58.05 (3.50) a A PAC 60.01 (1.13) a A 59.64 (2.14) a A Exponential light 59.61 (5.85) a A 60.37 (1.79) a A Means followed by distinct small letters are statistically different in columns (p < 0.05), by Tukey’s test.
Means followed by distinct capital letters are statistically different in lines (p < 0.05), by Tukey’s test.
( ) Standard deviation.
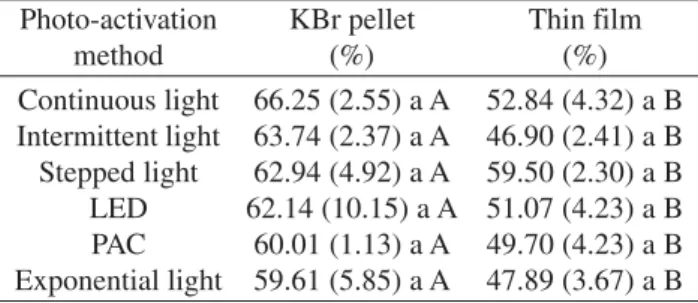
Table 3. Means of DC according to FTIR technique analyzed and photo-activation methods used (24 h).
Photo-activation KBr pellet Thin film
method (%) (%)
Continuous light 66.25 (2.55) a A 52.84 (4.32) a B Intermittent light 63.74 (2.37) a A 46.90 (2.41) a B Stepped light 62.94 (4.92) a A 59.50 (2.30) a B LED 62.14 (10.15) a A 51.07 (4.23) a B PAC 60.01 (1.13) a A 49.70 (4.23) a B Exponential light 59.61 (5.85) a A 47.89 (3.67) a B Means followed by distinct small letters are statistically different in columns (p < 0.05), by Tukey’s test.
Means followed by distinct capital letters are statistically different in lines (p < 0.05), by Tukey’s test.
izes the composites that use camphoroquinone as initiator. Thus, the LED light curing device achieves an almost ideal light source emission.
PAC units are characterized by a very high output (ap-proximately 1320 mW/cm2, according to manufacturer’s information) in a rather narrow range of wavelengths around 470 nm, however, the exposure time is just a few seconds. This results in lower energy density, however the peak ab-sorption wavelength is near to that of camphoroquinone.
Although the LED and PAC curing units provided the lowest energy densities (4 J/cm2 and 3.96 J/cm2, respec-tively), the DC values were not statistically different to halo-gen light sources. This finding may be explained by the wavelength peak at approximately 468 nm, emitted by these curing units, which activates camphoroquinone more effi-ciently. The halogen curing units exhibit higher energy den-sity, however, they also present a wide wavelength range of between 380-510 nm, with a wavelength peak at 484 nm16. The halogen lamps generate heat, becoming extremely hot (near to 400 °C), resulting in a 70% loss of output. How-ever, the light intensity decreases to 10% when a cut-off filter is used to obtain the optimal wavelength range required for curing composite resins. Thus, the final ratio of avail-able wavelength range for the polymerization process is only 1% of the total energy output of the halogen lamps16. De-spite these variations in curing units and photo-activation methods, no significant differences in DC values were ob-served, as mentioned before.
The cross-linked nature of the composite resins makes the photo-polymerization of the dimethacrylate monomers a complex process. Different behaviors are exhibited dur-ing the reaction, such as autoacceleration, autodeceleration, termination processes controlled by reaction diffusion, for-mation of structural heterogeneities (microgels) and limit-ing functional groups conversion. Firstly, monomer mol-ecules are incorporated into chains as units containing pen-dent bonds. Further propagation can proceed by addition of the next molecule (growing polymeric chain), by an intramo-lecular attack of the radical site on the pendent double bond (primary cyclization) or by an intermolecular linkage (cross-linking) that leads to network formation. The apparent re-activity of pendent double bonds on the same chain is ini-tially enhanced as compared to the monomeric double bond, due to their larger concentration near the radical site. This fact leads to an extensive primary cyclization reaction, which creates microgels, leading to heterogeneity in the polymer network19,28,29. Cyclization will promote higher local con-version since it does not decrease the mobility of the sys-tem as much as cross-linking. However, cyclization can lead to a reduction in the effective cross-linking density, reduc-ing the mechanical and physical properties19,28. This den-sity reduction occurs due to many of the uncured pendent
double bonds becoming entrapped in the microgel regions, making further reaction inaccessible29. Cyclization can pro-ceed if chain flexibility allows ring formation. On the other hand, a very stiff or long bridge between two unsaturations will prevent intramolecular cross-linking29. Network forma-tion causes the reacforma-tion diffusion mechanism to be more pronounced and set at lower conversions. All these phenom-ena limit final conversion of double bonds to well below 100%.
In addition, network formation highly decreases the mobility of macroradicals from the very beginning of the polymerization, which is the main cause of another phe-nomenon: the onset of autoacceleration (gel effect) in the initial stages of the polymerization. Autoacceleration causes a rapid increase in the polymerization rate despite monomer consumption. At higher conversions, the gel effect appears to stop and the polymerization rate reaches its maximum value, then, the reaction proceeds with a decreasing rate reaching limited conversion due to vitrifiacation. For dimethacrylate monomers, the polymerization rate reaches its maximum between 20 and 40% of conversion29. The decrease in the polymerization rate after its maximum po-lymerization rate may result from several factors, such as a reduction in monomer concentration, difficulties in monomer diffusion through the solidifying medium, reduced mobility of uncured pendant double bonds and decreasing dissociation efficiency of the photo-initiator in the viscous medium29. At higher conversions, however, both propaga-tion and terminapropaga-tion processes become diffusion control-led, leading to a rapid drop in the rate of reaction, the auto-deceleration. Thus, the final conversion of the polymeriza-tion is controlled by the diffusion limitapolymeriza-tions of the reacting medium and not by the amount of uncured monomer or pendant double bonds in the system29,30.
According to Lovell et al.30, the nature of the monomer molecule plays an important role in the final DC values. The viscosity of the system, when BisGMA is homo-po-lymerized, is so high that autoacceleration is immediate, leading to final conversion values lower than 30%. The in-corporation of monomers to reduce the viscosity of the sys-tem will strongly contribute to achieve higher DC values.
Spectroscopy: Comparison of Techniques, Storage Periods and Photo-activation Methods
monomer a greater mobility, since it presents a rigid core due to the aromatic groups. Another group of monomers used in commercial composite resins is the urethane dimethacrylates (UDMA). These monomers have molecu-lar weights simimolecu-lar to that of BisGMA, but are less viscous due to a greater flexibility of the urethane linkage1. The vis-cosity of the UDMA monomer is 23.1 Pas at 20 °C31.
BisGMA, BisEMA and UDMA compose the organic matrix of the Z250 composite resin used in this study. All these monomers present high molecular weights, but dif-ferent mobilities, providing satisfactory DC values. The re-sults found in this study are in agreement with those men-tioned in the literature13,15,18-21. Limited final conversion is a phenomenon inherent of the polymerization process, as mentioned earlier. Although there are great differences among the used photo-activation methods, the irradiance supplied was sufficient to reach the conversion characteris-tics for these dimethacrylate monomer systems.
Photo-polymerization of multifunctional monomers ex-hibits a marked post-curing effect. After irradiation has been interrupted, the photo-induced reactions continue to pro-ceed over a time scale of seconds, minutes or even hours. The extent of the dark reactions depends on the amount of initiating radicals generated by the irradiation step, storage temperature, as well as on the reactivity of the polymerizable function29-30.
Table 2 shows that there was no statistical difference between two periods of storage of samples, 24 h and 20 days (p > 0.05). During the storage time, the specimens were maintained at room temperature and in a dark environment to avoid further photo-activation. Thus, the absence of dif-ferences between the considered storage periods may be explained by atmospheric oxygen, which reduces the ex-tent of post-polymerization at room temperature due to the scavenging of free radicals by diffusing oxygen with the formation of peroxy and hydroperoxy radicals. These radi-cals are much less reactive towards double bonds, thereby reducing the efficiency of initiation and post-polymeriza-tion29.
The results presented in Table 3 reveal that there was a significant difference between the two FTIR analysis tech-niques. The use of the KBr pellet technique led to higher DC values than those found when the thin resin film tech-nique was used (p < 0.05). Two probable explanations for this are: (1) the negative effect of oxygen inhibition on the polymer surface which leads to the scavenging of the free radicals in this region, and (2) the exothermic nature of the polymerization reaction, what possibly caused a localized heating in the composite resin tested via the KBr pellet tech-nique20,29,32,33. The temperature rise during the polymeriza-tion provides greater mobility to the components of reac-tion medium, causing higher conversion rates, as well as
reducing oxygen inhibition due to a decrease in the solubil-ity of oxygen in the polymerizing medium29,30. The execu-tion of the resin film technique is simpler, however it presents DC values of a very thin, probably homogeneous, layer. Conversely, the KBr pellet technique, despite being more difficult, presents DC values of the whole composite incre-ment, which often is non homogeneous with different DC values.
4. Conclusion
Based on the obtained results and on the method used, it can be concluded that:
• Irrespective of the storage period and specimen prepa-ration technique, there were no significant differences among the photo-activation methods;
• No statistical difference was observed in DC values between the storage time periods used;
• The specimens analyzed by means of the KBr pellet technique presented higher DC values than those analyzed by the thin resin films.
References
1. Peutzfeldt, A. Eur J Oral Sci, v. 105, p. 97-116, 1997. 2. Stansbury, J.W.; Dickens, S.H. Polymer, v. 42,
p. 6363-6369, 2001.
3. Feilzer, A.J.; Dooren, L.H.; de Gee, A.J.; Davidson, C.L. Eur J Oral Sci, v. 103, p. 322-326, 1995.
4. Sakaguchi, R.L.; Berge, H.X. J Dent, v. 26, p. 695-700, 1998.
5. Davidson, C.L.; de Gee, A.J. J Dent Res, v. 63, p. 146-148, 1984.
6. Yearn, J.A. Inter Dent J, v.35, p.218–225, 1985. 7. Rueggeberg, F.A.; Caughman, W.F.; Curtis Jr., J.W.;
Davis, H.C. Am J Dent, v. 6, p. 91-95, 1993.
8. Baharav, H.; Abrahan, D.; Cardash, H.S.; Helft, M. J Oral Rehabil, v. 15, p. 167-172, 1988.
9. Rueggeberg, F.A.; Caughman, W.F., Curtis Jr., J.W. Operat Dent, v. 19, p. 26-32, 1994.
10. Koran, P.; Kürschner, R. Am J Dent, v. 11, p. 17-22, 1998.
11. Burgess, J.O.; Goes, M.F.; Walker, R.; Ripps, A.H. Pract Period Aesthc Dent v. 11, p. 125-132, 1999.
12. Obici, A.C.; Sinhoreti, M.A.C.; Goes, M.F.; Consani, S.; Sobrinho, L.C. Operat Dent v. 27, p. 192-198, 2002. 13. Bouschicher, M.R.; Rueggeberg, F.A.; Boyer, D. J
Esthet Dent, v. 12, p. 23-32, 2000.
14. Caldas, D.B.; de Almeida, J.B.; Correr Sobrinho, L.; Sinhoreti, M.A.C.; Consani, S. Operat Dent., v. 28, p. 215-320, 2003.
15. Peutzfeldt, A.; Sahari, A.; Asmussen, E. Dent Mater, v. 16, p. 330-336, 2000.
A. Dentistry in Japan, v. 34, p. 49-53, 1998.
17. Kurachi, C.; Tuboy, A.M.; Magalhães, D.V.; Bognato, V.S. Dent Mater, v. 17, p. 309-315, 2001.
18. Imazato, S.; McCabe, J.F.; Tarumi, H.; Ehara, A.; Ebisu, S. Dent Mater, v. 17, p. 178-183, 2001.
19. Ruyter, I.E.; Svendsen, S.A. Acta Odontol Scand, v. 36, p. 75-82, 1978.
20. Ferracane, J.L.; Greener, E.H. J Dent Res, v. 63, p. 1093-1095, 1984.
21. Guerra, R.M.; Duran, I.; Ortiz, P. J Oral Rehabil, v. 23, p. 632-637, 1996.
22. Chung, H., Greener, E,H. J Oral Rehabil, v. 15, p. 555-560, 1988.
23. Rueggeberg, F.A.; Craig, R.G. J Dent Res, v. 67, p. 932-937, 1988.
24. Silikas, N.; Eliades, G.; Watts, D.C. Dent Mater, v. 16, p. 292-296, 2000.
25. Miyazaki, M.; Oshida, Y; Moore, B.K.; Onose, H. Dent Mater, v. 12, p. 328-332, 1996.
26. Mills, R.W.; Jandt, K.D.; Ashworth, S.H. Brit Dent J, v. 186, p. 388-391, 1999.
27. Nemoto, R. Dent Mater J, v. 16, p. 60-73, 1998. 28. Elliott, J.E.; Lovell, L.G.; Bowman, C.N. Dent Mater,
v. 17, p. 271-279, 2001.
29. Andrzejewska, E. Prog Polymer Sci, v. 26, p. 605-665, 2001.
30. Lovell, L.G.; Newman, S.M.; Bowman, C.N. J Dent Res, v. 78, p. 1469-1476, 1999.
31. Davy, K.W.M.; Kalachandra, S.; Padain, M.S.; Braden, M. Biomaterials, v. 19, p. 2007-2014, 1998.
32. Reinhardt, K.J. Dtsch Zahnartl Z, v. 46, p. 204-208, 1991. (Article in German)