Materials Research, Vol. 10, No. 2, 215-218, 2007 © 2007
*e-mail: [email protected]
Study of the Aluminothermic Reduction of Niobium Pentoxide through
Thermal Analysis Experiments and High Energy Milling Processing
Claudio Parra De Lazzari, Danielle Goya Simões, José Deodoro Trani Capocchi*
Department of Metallurgical and Materials Engineering,
Polytechnic School of the University of São Paulo,
Av. Prof. Mello Moraes 2463, Cidade Universitária, 05508-900 São Paulo - SP, Brazil
Prof. Mello Moraes 2463, Cidade Universitária, 05508-900 São Paulo - SP, Brazil
Received: April 2, 2007; Revised: May 30, 2007
Aluminothermic reduction of niobium pentoxide was studied through thermal analysis techniques such as differential thermal analysis (DTA) and thermogravimetry (TG) as well as through high energy milling processing. Reactants mixtures were composed by powders of Nb2O5 and Al. In the case of DTA-TG experiments, different molar ratios Nb2O5:Al were heated in a dynamic atmosphere of synthetic air under controlled conditions. The high energy milling runs were carried out via SPEX vibratory mill under argon atmosphere and with milling power equal to 7:1 (ratio of mass of balls to mass of mixture) with 10 pct excess of Al over the stoichiometric mass of aluminum necessary. In both kinds of experiments, X ray diffraction was used in order to identify the products of reaction. From DTA-TG experiments, it was possible to determine the experimental value of the enthalpy change (–595.9 kJ.mol-1), which is near to the theoretical one. From the milling experiments, it was possible to verify the possibility of the occurance of aluminothermic reducion of niobium pentoxide via this kind of processing.
Keywords: aluminothermy, niobium pentoxide, thermal analysis, high energy milling
1. Introduction
Metallothermic reactions are very important for many refrac-tory metals producing processes. The heat of reaction and the rate of reaction are essential for the understanding of the metallurgical operations involved. Since the aluminothermic reduction of metal oxides is both highly exothermic and rapid reactions, there are few attempts to study the kinetics of such a process1-3.
The aluminothermic reduction of Cr2O34, Fe
2O35,6, MnO26,7 and V2O57, have been studied using the simultaneous differential thermal analysis (DTA) – thermogravimetry (TG) techniques. In a DTA apparatus the heat losses cannot be accurately predicted, therefore it is impossible to estimate precisely the maximum temperature attainable by aluminothermic reacting mixtures in a DTA set-up. Therefore an excess of aluminium has been used in order to use the excess enthalpy4-7.
In terms of high energy milling, this is a process used for produc-ing powders havproduc-ing a ine microstructural scale and/or as a technique for alloying dificult or normally incompatible materials. The capabil-ity of high energy milling process to produce powders with unique microstructures has been clearly established and this process is also inherently lexible8-10.
In high energy milling, a suitable powder charge (typically, a blend of elemental or preallyoed powders) is placed in a high-energy mill, along with a suitable grinding medium (typically, hardened steel balls). From a macroscopic viewpoint, the resultant powder develops through the repeated cold working and fracture of the powder parti-cles with a inal composition corresponding to the percentages of the respective constituents in the initial charge. This technique has been utilized to producing a wide range of materials including amorphous materials, intermetallic compounds, and solid solution alloys9-12.
In the case of a vibratory mill like SPEX, it is possible to produce small quantities of mechanically alloyed powder in relatively short times. In this system, the ball and powder charges are placed in a small jar which is agitated at a high frequency in a complex cycle which involves motion in three orthogonal directions8-10.
In the present work, aluminothermic reduction of niobium pentoxide was studied through thermal analysis techniques such as differential thermal analysis (DTA) and thermogravimetry (TG) as well as through high energy milling processing. Reactants mixtures were composed by powders of Nb2O5 and Al. In the case of DTA-TG experiments, different molar ratios Nb2O5:Al were heated in a dynamic atmosphere of synthetic air under controlled conditions. The high energy milling runs were carried out via SPEX vibratory mill under argon atmosphere and with milling power equal to 7:1 (ratio of mass of balls to mass of mixture) with 10 pct excess of Al over the stoichiometric mass of aluminum necessary. In both kinds of experiments, X ray diffraction was used in order to identify the products of reaction.
2. Experimental
2.1. Thermal analysis experiments (DTA-TG)
The DTA-TG experiments were carried out in a STA 409 model of NETZSCH-Gerätebau GmbH. The reactant mixtures were composed of powder of Nb2O5 (98.80 wt. (%) purity, average size 24.75 micrometers) and powder of Al (99.70 wt. (%) purity, average size 41.48 micrometers), with different molar ratios of Nb2O5:Al (1:5, 1:7, 1:8, 1:9, 1:10, 1:11, 1:12).
In each run a sample weighing 40 mg was put into alumina cy-lindrical crucible and heated from room temperature up to 1200 °C in a dynamic atmosphere of synthetic air (O2 + N2 = 99.997 vol. (%), 100 mL/min). Alumina powder was used as reference material. The adopted heating rate was 10 °C/min.
X ray diffraction was used in order to identify the products of reduction.
2.2. High energy milling experiments
216 De Lazzari et al. Materials Research
under argon atmosphere (99,999 vol. (%) purity). A tool steel jar and chromium steel balls were used. The milling power ratio was 7:1 (ratio of mass of balls to mass of mixture) and runs were carried out for periods of 45, 75 e 120 minutes. For each milling, the reac-tant mixture was prepared from powders of Nb2O5 (98.80 wt. (%) purity, average size 24.75 micrometers) and Al (99.70 wt. (%) purity, average size 41.48 micrometers), with 10 pct excess of Al over the stoichiometric mass of aluminum necessary for the reduction of the niobium oxide to metallic niobium. The temperature of the jar was monitored by means of type K thermocouple, in connection with a data collector.
X ray diffraction was used in order to identify the products of reduction.
3. Results and Discussion
3.1. Thermal analysis experiments (DTA-TG)
Figure 1 shows typical DTA-TG curves generated. On the DTA curve one can see two peaks as follows: a) the endothermic peak related to the melting of aluminium; and b) the exothermic peak related to the overall enthalpy change of the system. On the other hand, on the TG curve one can see the mass gain related to the oxida-tion of part of the excess of aluminium of the mixture. According to Sarangi, Sarangi, Ray and Misra5 the exothermic DTA peak repre-sent the total heat effect due to the following factors: a) heat of the aluminothermic reaction (exothermic with no gain of mass); b) heat of oxidation of some excess of aluminium (exothermic with gain of mass); and c) dissolution of the reduced metal (niobium) in excess of aluminium and formation of intermetallic compounds (of the Al-Nb system) (exothermic with no gain of mass).
The heats of formation at 298 K of the intermetallic compounds of the Al-Nb system (Nb2Al, Nb3Al and NbAl3) are very small in comparison with the heat of reaction of aluminothermic reduction of Nb2O5. They are equal respectively to13 –29.8 kJ.mol-1, –19.7 kJ.mol-1 and –49.4 kJ.mol-1 while the heat of reduction of Nb
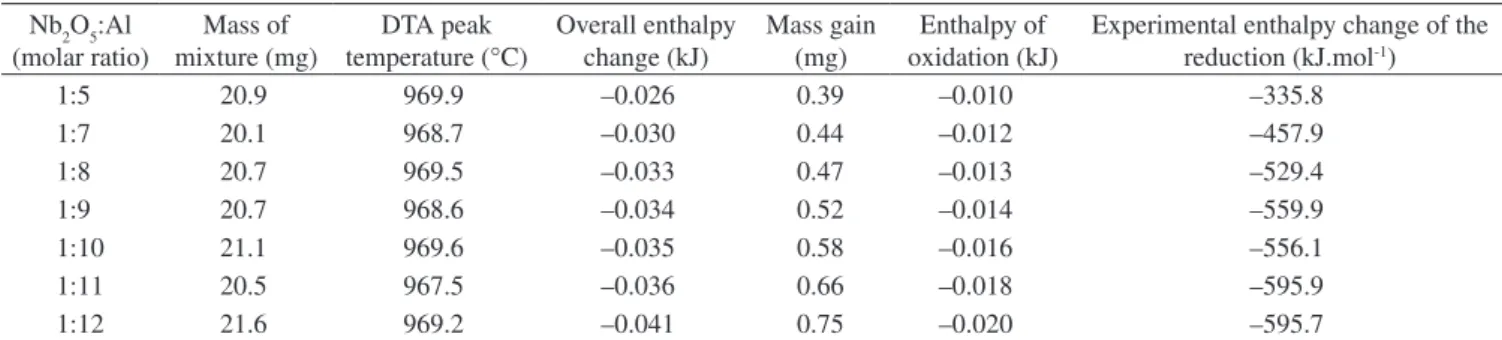
2O5 with Al (Nb2O5(s) + 10/3 Al(s,l) = 2 Nb(s) + 5/3 Al2O3(s)) is –890.0 kJ.mol-1, at 25 °C (298 K)14. Therefore, the experimental heat value of the alu-minothermic reduction of Nb2O5 was obtained by subtracting the heat of oxidation of some excess of aluminium calculated from the gain of mass detected on the TG curve from the overall enthalpy change calculated from the DTA peak. The results of the experiments are summarised in Table 1 which contains: the molar ratio used in each experiment, mass of mixture, the DTA temperature of the exothermic peak, the calculated overall enthalpy change of the system, the mass gain, the enthalpy of oxidation of the aluminium and, inally, the experimentally determined enthalpy change associated to the reduc-tion of Nb2O5 with Al.
Figure 2 shows, for each tested molar ratio Nb2O5:Al, both the theoretical and the experimental values of the enthalpy change of the reduction, at the respective DTA peak temperature. The calculated values of the enthalpy of reduction presented on Figure 2 have been calculated from the sum of the change of enthalpy corresponding to the reduction at 298 K plus variation of the heat capacities of the products of reaction from 298 K up to the corresponding peak temperatures.
It must be noted that for molar ratios Nb2O5:Al equal or greater than 1:11 the experimental value of the enthalpy change is almost constant and very near to the theoretical value (approximately 6% less than the theoretical value).
Figure 3 shows the X ray diffraction pattern of the product reac-tion for the molar ratio Nb2O5:Al=1:11 which indicates the presence of
Table 1. Consolidated results of the experiments.
Nb2O5:Al (molar ratio)
Mass of mixture (mg)
DTA peak temperature (°C)
Overall enthalpy change (kJ)
Mass gain (mg)
Enthalpy of oxidation (kJ)
Experimental enthalpy change of the reduction (kJ.mol-1)
1:5 20.9 969.9 –0.026 0.39 –0.010 –335.8
1:7 20.1 968.7 –0.030 0.44 –0.012 –457.9
1:8 20.7 969.5 –0.033 0.47 –0.013 –529.4
1:9 20.7 968.6 –0.034 0.52 –0.014 –559.9
1:10 21.1 969.6 –0.035 0.58 –0.016 –556.1
1:11 20.5 967.5 –0.036 0.66 –0.018 –595.9
1:12 21.6 969.2 –0.041 0.75 –0.020 –595.7
0
DT
A (uV)
exo
DTA
A
TG
C
B –10
–20
–30
–40
–50
Temperature (°C)
TG (mg)
200 400 600 800 1000 1200
1.0
0.8
0.6
0.4
0.2
0.0
Figure 1. DTA and TG curves for the mixture with molar ratio Nb2O5:Al=1:11.
A (DTA curve): endothermic peak related to the melting of aluminium; B (DTA curve): exothermic peak related to the aluminothermic reduction of Nb2O5 plus the oxidation of part of the aluminium in excess plus the formation of an intermetallic compound of Al-Nb system (NbAl3); and C (TG curve): mass gain related to the oxidation of part of the aluminium in excess.
250 300 350 400 450 500 550 600 650 700
1:5 1:7 1:8 1:9 1:10 1:11 1:12
Molar ratio Nb2O5: Al
E
n
th
al
p
y
c
h
an
g
e (kJ.mol
-1)
Teoretical Experimental
Figure 2. Theoretical and experimental values of the enthalpy change
(kJ.mol-1) of the reduction for each tested molar ratio (Nb
2O5:Al), at the
Vol. 10, No. 2, 2007 Study of the Aluminothermic Reduction of Niobium Pentoxide through Thermal Analysis Experiments and High Energy Milling Processing 217
NbAl3, Al2O3 and unreacted Al and Nb2O5. Each individual phase was identiied using ICDD – International Centre for Diffraction Data.
The presence of the intermetallic compound NbAl3 is due to the fact that there is aluminium in excess over the stoichiometric quantity (3.3 more than the stoichiometric quantity). So, the reduced niobium reacts with the excess of aluminium leading to the formation of NbAl3. Sarangi et al.7 have observed in the case of the reduction of V
2O5 and MnO2 with Al the formation of V-Al and Mn-Al intermetallic compounds, respectively. Cintho et al.8 have observed in the case of the reduction of Cr2O3 with Al the formation of Cr-Al intermetallic compound.
3.2. High energy milling experiments
Figure 4 shows the X ray diffraction pattern of the mixture ho-mogeneized during 1 hour (without milling). Figures 5, 6 and 7 show X ray diffraction patterns of the mixtures milled during 45, 75 and 120 minutes, respectively.
It must be noted in Figure 4 (mixture only homogeneized - not milled) and in Figure 5 (mixture milled for 45 minutes) that the peaks of the diffraction correspond only to the presence of the reactants Nb2O5 and Al. However, in the diffraction pattern related to the
mix-Figure 5. XRD pattern of reaction products, after 45 minutes of milling.
Anode: Cu, Generator tension: 40 kV, Generator current: 40 minutes mA, Kα1 = 1.54060 Å. Phases were identiied according to ICDD – International
Centre for Diffraction Data.
Figure 6. XRD pattern of reaction products, after 75 minutes of
mill-ing. Anode: Cu, Generator tension: 40 kV, Generator current: 40 mA, Kα1 = 1.54060 Å. Phases were identiied according to ICDD – International
Centre for Diffraction Data.
Figure 7. XRD pattern of reaction products, after 120 minutes of
mill-ing. Anode: Cu, Generator tension: 40 kV, Generator current: 40 mA, Kα1 = 1.54060 Å. Phases were identiied according to ICDD – International
Centre for Diffraction Data.
Figure 3. XRD pattern of reduction of Nb2O5 with Al (molar ratio Nb2O5:
Al=1:11). Anode: Cu, Generator tension: 40 kV, Generator current: 40 mA, Kα1 = 1.54060 Å. Phases were identiied according to ICDD – International
Centre for Diffraction Data.
Position (Angle (2Q))
10 20 30 40 50 60 70 80
Counts
0 100 400
Nb2O5 + Al heated via DTA - TG
NbAl3
Al
Al2O3 Nb2O5
* * *** * * * * * * * * * * ** * * * v v v v
v v v v $ $ $ $ $ $ $
Figure 4. XRD pattern of sample homogeneized during 1 hour (without
milling). Anode: Cu, Generator tension: 40 kV, Generator current: 40 mA, Kα1 = 1.54060 Å. Phases were identiied according to ICDD – International
Centre for Diffraction Data.
Position (Angle (2Q))
10 20 30 40 50 60 70 80
Counts 0 100 400 900 1600
Nb2O5 + Al without milling
Nb2O5
Al * + + + + + * * * * ** * * * ** * *** * * * * *** * * *** * *** * *** *
Position (Angle (2Q))
10 20 30 40 50 60 70 80
Counts
0 100 400
Nb2O5 + Al, 45 minutes of milling
Nb2O5
Al * * * * * ** * * * * ** * * * * * ** * * * * * * *** * * + + + + +
Position (Angle (2Q))
10 20 30 40 50 60 70 80
C o u n ts 0 100 400 900 Al Nb Al2O3
* Nb2O5
Nb2O5 + Al, 75 minutes of milling
• • • • • • • • • • • • g g g * * * ** * * * * * * * * ** * * ** * + + + +
Position (Angle (2Q))
10 20 30 40 50 60 70 80
Counts
0 100 400
Al Al2O3
v Nb3Al
+
Nb2O5 + Al, 120 minutes of milling
218 De Lazzari et al. Materials Research
ture milled for 75 minutes, it is possible to notice a reduction in the intensities of peaks related to the presence of Nb2O5 and the appear-ance of peaks related to the presence of Al2O3 and Nb, generated from the aluminothermic reduction of niobium pentoxide. Finally, in the diffraction pattern related of the mixture milled for 120 minutes, it is possible to verify the presence of peaks related to Al2O3, residual Al and intermetallic compound Nb3Al; the last one generated from the reaction between the residual aluminium and the niobium obtained from the aluminothermic reduction.
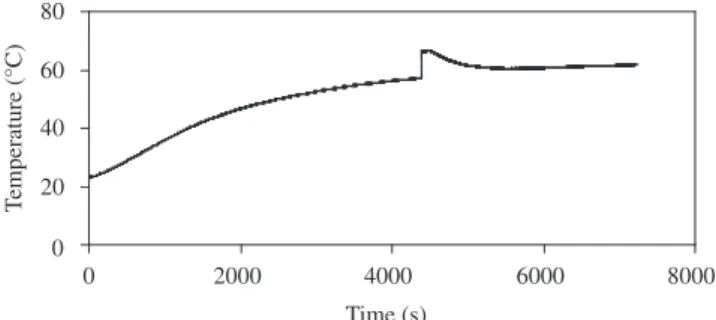
Figure 8 shows the temperature evolution of the jar during the 120 minutes milling run.
From Figure 8, it is possible to verify an abrupt increase of the temperature and the existance of a characteristic milling time related to the beginning of reaction (about 75 minutes).
4. Conclusion
The following conclusions have been obtained from the present study:
• For molar ratios Nb2O5:Al equal or greater than 1:11 the experimental value of the enthalpy change is almost constant (–595.9 kJ.mol-1) and very near to the theoretical value (ap-proximately 6% less than the theoretical value). The analysis of the product of reaction for the molar ratio Nb2O5:Al=1:11 indicates the presence of NbAl3, Al2O3 and unreacted Al and Nb2O5.
• X ray diffraction patterns of the mixtures milled allowed to verify the possibility of the occurance of aluminothermic reduc-tion of niobium pentoxide via high energy milling processing. For 120 minutes milling time, the reaction products were Al2O3 and intermetallic compound Nb3Al, with the presence of some residual Al.
Acknowledgments
The authors gratefully acknowledge the inancial support of Fundação de Amparo à Pesquisa do Estado de São Paulo – FAPESP and of Conselho Nacional de Desenvolvimento Cientíico e Tec-nológico – CNPq.
References
1. Habashi F. Principles of Extractive Metallurgy. New York: Gordon and
Breach; 1986. p. 19.
2. White JH. The Extraction of Metals. New York: Macmillan and Co; 1968.
p. 56.
3. Rosenqvist T. Principles of Extractive Metallurgy. New York: Mc
Graw-Hill; 1974. p. 34-416.
4. Cintho OM, De Lazzari CP, Capocchi JDT. Kinetics of the non-iso-thermal reduction of Cr2O3 with aluminium. ISIJ International. 2004; 44(5):781-784.
5. Sarangi A, Sarangi B, Ray HS, Misra S. Thermoanalytical investigation of the aluminothermic reduction of iron (III) oxide. Journal of Thermal Analysis. 1990; 36(2):513-527.
6. Sarangi B, Sarangi A, Ray HS. Kinetics of aluminothermic reduction of MnO2 and Fe2O3: a thermoanalytical investigation. ISIJ International. 1996; 36(9):1135-1141.
7. Sarangi B, Ray HS, Tripathy KK, Sarangi A. Determination of heats of aluminothermic redox reduction of V2O5 and MnO2. Journal of Thermal Analysis. 1995; 44(2):441-451.
8. Cintho OM, Capocchi JDT. Utilização da moagem de alta energia no processamento de materiais. Boletim Técnico da Escola Politécnica. 2003; 0305:1-27.
9. Koch CC. The synthesis and structure of nanocrystalline materials pro-duced by mechanical attrition: a review. Nanostrutured Materials. 1993;
2(2):109-129.
10. Murthy BS, Ranganathan S. Novel materials synthesis by mechanical alloying. International Materials Review. 1998; 43(3):101-141.
11. Suryanarayana C. Nanocrystalline materials. International Materials Reviews. 1995; 40(2):41-64.
12. Desch PB, Schwarz RB, Nash P. Mechanical alloying to produce L12 phases in the Al-Zr system. Scripta Materialia. 1996; 34(1):37-43. 13. Mahdouk K, Gachon, JC, Bouirden L. Enthalpies of formation of the
Al-Nb intermetallic compounds. Journal of Alloys and Compounds. 1998; 268(2):118-121.
14. Kubaschewski O, Evans EL, Alcock CB. Metallurgical Thermochemistry. Oxford: Pergamon Press; 1974. p. 304-447.
0 20 40 60 80
0 2000 4000 6000 8000
Time (s)
T
emperature (°C)