RESUMO.- [Análise e caracterização das fases do andamento normal dos cavalos através da combinação de fotogrametria e acelerometria como ferramenta para o diagnóstico da claudicação.] Os cavalos com claudicação modificam o comportamento do andamento. Porém, uma leve modificação pode não ser identificada clinicamente. O objetivo desta
pesquisa foi caracterizar as fases do andamento normal
dos cavalos através da combinação de fotogrametria e
acelerometria, para identificar alterações estruturais ou funcionais nos membros. O estudo foi conduzido em 23 cavalos Warmblood machos adultos. A partir da fotogrametria foi possível obter as variáveis cinemáticas das extremidades e a trajetória dos marcadores ao longo do tempo. Por outro lado, os acelerômetros triaxiais foram usados para capturar as componentes ortogonais da aceleração. Determinou-se que apenas 10 cavalos mostraram um padrão de marcha normal, e houve uma correspondência de 43% entre pareceres dos peritos e as técnicas de diagnóstico. De acordo com a classificação das fases da marcha de Stashak, as fases do ciclo da extremidade anterior foram 34/4/8/13/41 enquanto para a extremidade posterior foram 54/11/8/8/19. A amplitude de movimento (ROM) de pescoço, joelho e sesamóide foram
45,52±5,63°, 196,04±19,7° e 209±11,52°, respectivamente. ABSTRACT.- Morales-Acosta L., Ortiz-Prado A., Jacobo-Armendáriz V.H. & González-Carbonell
R.A. 2018. Analysis and characterization of the normal gait phases of walking Warmblood horses as a tool for the diagnosis of lameness.Pesquisa Veterinária Brasileira 38(3):536-543. Unidad de Investigación y Asistencia Técnica en Materiales, Universidad Nacional Autónoma de México, Coyoacán, Distrito Federal, 04510, México. E-mail: [email protected]
Horses with lameness modify gait behavior, but when it is subtle, it may not be possible to identify it clinically. The objective of this research is to characterize the normal gait phases of walking Warmblood horses by combining photogrammetry and accelerometry to monitor lameness to indicate a structural or functional disorder in the extremities. The study was conducted in 23 adult male Warmblood horses. Photogrammetry was used to identify the kinematic variables of the limbs and the markers path over time; triaxial accelerometers were used to capture the orthogonal acceleration components. It was determined that only 10 horses showed a normal gait pattern, there was a 43% correspondence between the expert´s judgment and the diagnostic techniques. According to the Stashak classification of the gait phases, cycle phases to forelimb were 34/4/8/13/41, while for hind limb were 54/11/8/8/19 (% of the stride). The range of motion (ROM) of the neck, knee and fetlock joints was 45.52±5.63°, 196.04±19.7° and 209±11.52° respectively. A combination of experimental methods was used to identify the phases of gait cycle of healthy horses. There was a correspondence in the location of the points of maximum displacement of the limbs with both techniques. More detailed information on the limbs movement was obtained using the accelerometer technology. These methods are applicable to other conditions either outdoors or in the lab.
INDEX TERMS: Gait, horses, Warmblood, lameness, photogrammetry, accelerometry, equine, limb injuries, clinics.
Vet 2506 pvb-4496 LD
Analysis and characterization of the normal gait
phases of walking Warmblood horses as a tool for the
diagnosis of lameness
1Lázaro Morales-Acosta2*, Armando Ortiz-Prado2, Víctor H. Jacobo-Armendáriz2 and Raide A. González-Carbonell3
1 Received on December 9, 2015.
Accepted for publication on May 26, 2017.
2 Unidad de Investigación y Asistencia Técnica en Materiales, Universidad
Nacional Autónoma de México, Coyoacán, Distrito Federal, 04510, México. *Corresponding author: [email protected]
3 Facultad de Electromecánica, Universidad de Camagüey, Camagüey,
Uma combinação dos métodos experimentais foi utilizada para identificar as fases do ciclo de marcha de cavalos saudáveis. Constatou-se correspondência na localização dos pontos de deslocamento máximo do membro com ambas as técnicas. A informação mais detalhada do movimento dos membros foi obtida usando a acelerometria. Estes métodos são aplicáveis em outras condições, quer a campo ou no laboratório. TERMOS DE INDEXAÇÃO: andamento normal, fotogrametria, acelerometria, claudicação, equino, membros, Warmblood, clínica.
INTRODUCTION
The quadrupedal gait of horses presents a wide variety of movement patterns. Also influenced by factors such as breed, habits, motion type, health status (Barrey 1999). In veterinary medicine, a broad gait classification is defined; the most common elements are walk, trot, canter and gallop. Walk and trot show a symmetrical behavior during gait (Halling-Thomsen et al. 2010). Horses with lameness modify gait behavior, but when it is subtle it may not be possible to identify the disorder at a single glance (McCracken et al. 2012). It requires veterinarians with a high degree of experience to identify these injuries (Keegan et al. 2010). Lameness detection methods for horses constitute an interesting field both in research and commercially (Starke et al. 2012).
The analysis of the equine’s locomotion system has been studied by several researchers in different ways. The development of photogrammetry and accelerometry have enabled a more detailed study of motion (Keegan et al. 2004, Abson et al. 2015). The studies have focused primarily on the analysis of the gait symmetry of horses to identify potential injury (Rhodin et al. 2016).
The neck, limbs and trunk are the most studied parts of the horse, because when lameness is present, the neck modifies the range of motion and the acceleration during the stance phase of the injured leg. In this respect, Zsoldos & Licka (2015) characterized the importance of the neck movement and its relationship with injuries. Rhodin et al. (2016) studied the neck movement in regards to the symmetry of the pelvis and head movements of trotting horses. Meanwhile, Starke et al. (2012) used accelerometers in the trunk, pelvis and limb to estimate the hoof contact time.
The horse-rider´s interaction has also been studied and the graphics of rider movement have been consistent with those reported by the horse trunk (Halling-Thomsen et al. 2010, Eckardt et al. 2014, Rhodin et al. 2016). Following this line, Miro et al. (2006) conducted a comparison of the horse’s gait with and without riders, where they found no difference between the two movement conditions.
On the other hand, there are reports of the use of the gait biomechanics as a selected method for competition horses (Sánchez et al. 2013). Other researches are focused on obtaining the horse’s biomechanical behavior to reproduce their movements in the film and entertainment industry (Abson & Palmer 2015).
In the studies mentioned above, photogrammetry and accelerometry were used interchangeably or their combination to characterize the horse’s gait. The objective of this research is to characterize the normal gait phases of walking Warmblood horses by using the combination of photogrammetry and
accelerometry as a tool to monitor lameness to indicate a structural or functional disorder in the extremities.
MATERIALS AND METHODS
The combination of photogrammetry and accelerometry was used as a tool to monitor the gait of horses. Photogrammetry was used to identify kinematic variables of the limbs and the markers path over time, the triaxial accelerometers were used to capture the orthogonal components of acceleration. The procedure of this method is shown in Figure 1.
Horses. The study was conducted in 23 adult males Warmblood horses, mean age of 9.65±3.6 years (range 5-17), mean height of 163±11.3cm (range 161-179cm), mean weight of 530.3±39.5kg (range 468-614). The inclusion criterion was that no abnormalities were observed in the horse´s gait. The equine veterinarians specialized in locomotion conducted the clinical examination. They collected data on the horse´s clinical history, as well as the static and motion observations.
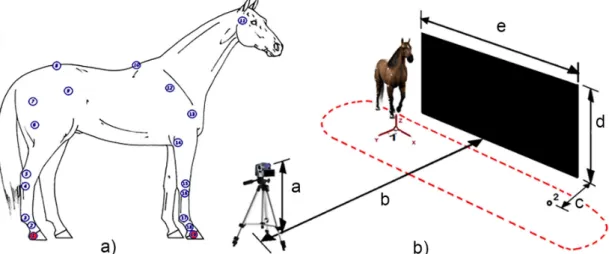
Markers and accelerometers positions. The markers were placed on the right side of the horse´s body (Van Heel et al. 2006) and the identification of interest points to locate the markers (passive and reflective 30mm-diameter markers) was performed by a specialist in equine veterinarian and according to a reported research (Solé et al. 2014), while triaxial accelerometers were placed at the coronary band (lateral aspect of the hoof) of four extremities
(Fig.2a). The accelerometers were enclosed on a 30mm-diameter
cylindrical white box that also served as reflective markers. The characteristics of accelerometers of Zstar3 System Freescale™ Semiconductor were: dynamic range 2±4 to ±8g, frequency response ±5%, noise level 0.0025g 2Hz-25.000Hz, sensibility 64 LSB/g at 2g. 64 LSB/g at 8g in 10 bit mode, temperature range from -40oC to
85oC, current 400μA and voltage 2.4 to 3.6 Volts. The height at the withers and the distance between the markers were measured and registered on each horse.
Data acquisition. Measurements were performed on the sand track of the equestrian sports club of the Presidential Guard Staff of Mexico. A e=14m-length and d=2.2m-height black fabric was placed as the background plane. Two spheres were used as a reference located at a distance c=2m from the background plane. The high-speed camera Stream View-LR portable Gigabit Ethernet (640x480 images at 200-fps with <1% dropped frames) was positioned at a height a=1.1m from the floor and at a distance b=14m from the center of the background plane (Fig.2b).
Walking horses were hand-guided through a circuit of about 20m-length (red dashed line in Fig.2b). Horses were recorded five times as they passed in front of the background plane (from left to right) as well as three of their strides each time. Photogrammetry data were standardized as percentage of total stride (normalized time) in the x-axis and relative to the height at the withers in the y-axis (Back et al. 1994):
100% p c y y h = ×
y = vertical coordinate measure from photogrammetry,
c
h = horse withers height.
data were acquired at real time and were synchronized through the synchronization of the internal clock of measurement equipment.
NI Vision Assistant Software and NI Vision Builder Software (National Instruments Corporation, Austin, TX, USA) were used for the acquisition and conversion of images from the photogrammetry, Mathematica (Wolfram Research, Boston, MA, USA) was used for the data processing and for the graph plotting of the accelerometry and photogrammetry data.
Statistics. Data was saved in CSV format and used as input to a series of scripts written using R (R Foundation for Statistical Computing, Vienna, Austria) for the statistical analysis. The significant level was set at 0.05. Data were tested for normality by using the Shapiro-Wilk test. The range of motion (ROM) of the neck, knee and fetlock joint and difference between fore and hind limbs hoof displacement and fore and hind limbs hoof acceleration were tested by using t test for normally distributed data and Wilcoxon signed rank test for not normally distributed. The intra-class correlation coefficient (ICC) was calculated. The ICC indicated variations in the population sample within and among the participants (Wolak et al. 2012).
RESULTS
Out of the initial group of 23 Warmblood horses that were diagnosed as sound by the equine veterinarians specialized in locomotion, it was determined by the combination of accelerometry and photogrammetry that only 10 horses with a mean age of 9.9±3.9 years (range 5-17), mean height of 166±5.3cm (range 161-179cm), mean weight of 513.29±41.73 kg (range 469.8-614.4) had normal gait as walking hand-guided at an average speed of 1.28±0.125(m/s). The acceleration and photogrammetry data acquired showed good to excellent reliability (ICC=0.6-0.84, p<0.01) (Table 1).
The photogrammetry results for the markers mean trajectory placed in the coronet of the right forelimb and hind limb (points 1 and 19 of Fig.2) are shown in Figure 3a and 3b.
The acceleration resulting from the points 1 and 19 is also shown (Fig.3c and Fig.3d).
According to photogrammetry, the stance and swing phases of the stride in the limbs were appreciated. The same pattern of movement for both the forelimb and hind limb was observed. The approximate cycle duration for the forelimb was about
60/40 (Fig.3a), while the hind limb had a 50/50 behavior
(stance/swing) (Fig.3b). The maximum stride height for the forelimb was 13% of the height at the withers, while the hind limb was 14% of the height at the withers (p<0.05).
The cycle was characterized, from the accelerometry results, by two peaks, which were not observed in photogrammetry
(Fig.3). The first peak refers to the phases of breakover
(lift-heel and toe-pivot). The second peak of the accelerometry coincided with the location of the maximum of photogrammetry. According to the phases of the stride: swing, landing, loading, breakover, and stance (Back & Clayton 2013, Stashak & Hill C. 2013), the cycle steps for the forelimbs were 34/4/8/13/41 (% of total stride), while for hind limb were 54/11/8/8/19 (% of the stride).
The behavior of the range of motion (ROM) of the neck, knee and fetlock joint, measured through the neck angle (points 11-10-12, temple-withers-scapula), the knee angle of Fig.2. Preparation stage of data acquisition. (a) Placement markers points (white points, passive and reflective 30mm-diameter markers) and accelerometers (red points, accelerometers were enclosed on a 30mm-diameter cylindrical white box that also served as reflective markers). (b) Lap for the experimental test, walking horses were hand-guided through a circuit of about 20m-length (red dashed line).
Table 1. Mean and standard deviation for range of motion of the neck, knee joint and fetlock joint, displacement and acceleration of hoofs, and inter-class correlation coefficient
Mean ± SD ICC Neck
ROM (°) 45.52 ± 5.63 0.72
Forelimb
Hoof displacement (% of the height at withers) 10.6 ± 2.0 0.84
Hoof acceleration (g) 1.7 ± 0.97 0.76
ROM (°) 196.04 ± 19.7 0.74
Hind limb
Hoof displacement (% of the height at withers) 10.6 ± 2.0 0.6
Hoof acceleration (g) 1.57 ± 0.8 0.81
Fig.3. Photogrammetry and accelerometer curves of 10 sound horses. (a) Photogrammetry curve of forelimb. (b) Photogrammetry curve of hind limb. (c) Accelerometry curve of forelimb, the cycle was characterized by two peaks, the first peak refers to the phases of breakover (lift-heel and toe-pivot) and the second peak coincided with the maximum stride height (swing phase). (d) Accelerometry curve of hind limb, the cycle was characterized by two peaks too, the first peak refers to the phases of breakover and the second peak coincided with the maximum stride height (swing phase).
Fig.4. Range of motion measured through angles. (a) Segments for measuring the range of motion, the neck angle (points 11-10-12, temple-withers-scapula), the knee angle of the forelimb (14-16-17, radio-knee-third metacarpal) and the fetlock joint angle (2-3-4, proximal phalangeal-sesamoid-third metatarsal). (b) Curve of neck angle. (c) Curve of knee angle. (d) Curve of fetlock joint angle. the forelimb (14-16-17, radio-knee-third metacarpal) and the
fetlock joint angle (2-3-4, proximal phalangeal-sesamoid-third metatarsal) respectively is shown in Figure 4. The ROM of the neck was 45.52±5.63°, the angle presented a sinusoidal behavior at twice the limb frequency (Fig.4b). The ROM of
the knee joint was 196.04±19.7° (Fig.4c) and the behavior of knee angle was similar to the displacement of the forelimb hoof (Fig.3a). The ROM of the fetlock joint was 209±11.52°
(Fig.4d) and the angle had a similar behavior to that of the
limbs trends to be higher than the ROM of the animal’s neck, being the ROM of the forelimb the highest of all (p<0.05).
DISCUSSION
The use of photogrammetry and accelerometry contributed to the identification of the phases of the stride and the range of motion of a selection of joints of sound horses. The landing, loading, stance, breakover and swing phases of fore and hind limb were identified. From the gait behavior, a correspondence in the location of the maximum limb displacement in both techniques was obtained (Fig.3). The cycle was characterized, from the accelerometry results, by two peaks, which were not observed in photogrammetry (Fig.3). The first peak refers to the phases of breakover (lift-heel and toe-pivot) and the second peaks at the maximum of stride height. The detailed information acquired through diagnostic techniques permitted a better identification of lameness, that it wasn´t detected clinically.
According to Keegan et al. (2010), agreement for subjective evaluation of lameness by equine veterinarians is only marginally acceptable. These authors conducted their study with several experienced equine veterinarians that evaluated horse’s lameness and concluded that for horses with mild lameness, their subjective evaluation is not very reliable. Thus, the development of a more objective and reliable method of lameness evaluation to be used in the field is therefore recommended. So the methods to detect horse’s abnormal gait constitute an interesting field for both, research and economy (Starke et al. 2012).
Donnell et al. (2015) compared the diagnosis of lameness detected by specialists with those detected by experimental methods. They found that there was a better matching between diagnosis by specialists and diagnosis based on inertial sensors than when force platforms were used. The horse points selected to locate the inertial sensors are primarily the trunk, pelvis, and limbs. Photogrammetry has also been widely used in the analysis of horses´ gait. Moorman et al. (2013) indicated that horses with unilateral forelimb lameness that was perceptible only at a trot had several kinematic changes in both the lame and non-lame limbs when walking. Thus, Draper et al. (2015) recommended that the evaluation of horses for movement disorders should include the walking horses forwards and backwards. According to Keegan et al. (2004), the use of combined photogrammetry and accelerometry provides a tool for the diagnosis of complex cases of lameness. Unfortunately, when clinical cases are presented, the data from the patient in the sound condition to use as a normal comparison are unavailable (Khumsap et al. 2002). The results of this research contributed to the characterization of the phases of horse’s normal gait of walking Warmblood horses for clinical purposes.
Photogrammetry proved to be a useful tool to describe the movement, but it is important to note that the analyzed data showed a difference in respect to reality. This difference occurs because the image projection of the objects in a single plane suppresses direct correlation between the actual size and the scale in planes parallel to the observer. This process causes a projection error that was taken into account during the calibration of the cameras. Due to the above, the mean
displacement (Fig.3) for the stance phase shows 8% of the
height at withers, representing 13±2cm, while the actual location of markers was at 10±2 cm.
The location of the markers also affects the results. Horses instinctively try to shed the markers. It is recommended to place markers in points where the skin has little movement (Abson & Palmer 2015). The points of interest for veterinarians are the head, the withers, the pelvis and the coronet. Even though 19 points of the horse’s anatomy were analyzed, the behavior of the above markers was emphasized.
To standardize the attitude of the horses, the handler was instructed to guide the horse through the circuit while the veterinarian was observing them to determine when they were performing with a normal gait. Depending on the horse’s temperament, the acclimatization laps were between 5 and 7. Subsequently, five laps were made to record a video and acceleration data. The time spent on letting the horses ready for the test was approximately 22 minutes.
It was defined that the cycle started when forelimb was landing on the soil (0%) and ended when the same limb landed again on the soil (100%). The curves of the hoof displacement of fore and hind limb defined the gait cycle in two main phases, stance and swing. The stance phase of forelimb represented the 60% of the stride and the swing phase the 40%. Miro et al. (2006) studied the stride duration of Andalusian horses walking overground, and the same behavior of phase’s duration was observed. According to Duberstein et al. (2013), a large swing-stance ratio is desirable for good quality movements.
Hodson et al. (2000) studied the kinematic of forelimb in walking horses. They considered the landing-loading phases as early stance phase with 13% of duration, while the stance, breakover and swing phases were 42%, 9% and 32% respectively. In this research, five phases of the stride were identified. The landing-loading phases represented the 12% of the stride, while the stance, breakover and swing phases of the forelimb represented the 41%, 13% and 34% of the stride respectively.
The angle of the knee joint exhibit the same pattern of the displacement of the hoof, when the hoof reached the highest elevation from the ground, the angle of this joint was the highest too. During the stance phase, the angle was 180 degrees approx. The angle range of motion was from 180 to 240 degrees, which indicated a flexion of the knee joint of about 60 degrees. This result was consistent with Miro et al. (2006) and Hodson et al. (2000). The curve of hoof acceleration showed two peaks, the first occurred at the breakover phase and the second peaks at the maximum displacement of the hoof. Thus, the acceleration curve offered more detailed information of the movement of the forelimb.
The stance phase of hind limb represented the 50% of the stride and the swing phase the 50%. However, Miro et al. (2006) obtained that the duration of stance and swing phases were the 60% and 40% of the stride respectively. According to Hodson et al. (2001) the early stance phase was 12% of duration, while the stance, breakover and swing phases were 43%, 10%, and 35%, respectively. In this research, the landing-loading phases represented the 19%, while the stance, breakover and swing phases of the hind limb represented the 54%, 8% and 19% of the stride respectively. Back et al. (1994) stated that stance phase increase with age. The difference in the duration of the phases of the stride was affected by the conditions of the ground.
Chateau et al. 2013). In this study, tests were developed in sandy soil to obtain a behavior as near as possible to reality, because the selected horses were athletes and worked in this type of surface. However, this method is applicable in other conditions either outdoors or in the lab.
The angle of the fetlock joint decreased at the transition between landing-loading phases. According to Hodson et al. (2001), the pastern rotated cranially at the early stance phase and returned at the end of this phase. The joint angle reached its highest value at the stance phase, and then it decreased to the lowest magnitude again at the maximum elevation of the hoof during the swing phase. As was observed in the forelimb, the hind limb curve of hoof acceleration showed two peaks too, the first occurred at the breakover phase (hoof lift and toe pivot) and the second peak at the maximum elevation of the hoof.
In the diagnosis of lameness, it is important to analyze the range of motion of the horse´s neck. According to the results of the present research, the neck angle had a behavior
of sinusoidal oscillation (Fig.4), which was consistent with
the study of Zsoldos & Licka (2015) which characterized the neck and head movement during gait. They stated that the segment between the neck base and the head has an oscillating movement with certain amplitude in horses with a normal gait. According to Keegan et al. (2004), the vertical movement of the head is characterized by a harmonic behavior whose frequency is twice the frequency of the limbs movement. This behavior was also observed in the present investigation, the two peak of the curve of neck movement represented the stance phase of each forelimb. Then, the head and neck constitute the balancing mechanism of the horse (Moore 2010).
The knowledge of the oscillation amplitude contributes to the diagnosis of lesions; increased amplitude indicates forelimb injury. In this research, the oscillation amplitude of neck was 45.52 ± 5.63°. Another observable phenomenon in relation to the movement of the head is that increasing the oscillations amplitude, the angular acceleration of the segment between the neck and head increases to satisfy the condition of the oscillation frequency described above. According to Zsoldos et al. (2010), the ROM of the neck becomes larger during the stance phase of the sound limb; therefore, the movements of the head and neck become faster at the same speed. But, when both limbs are injured, the difference between the amplitude of both peaks of the cycle is not recognizable. A slight asymmetry was observed in the ROM of head, but it does not represent the presence of lameness.
CONCLUSIONS
In this paper, a combination of photogrammetry and accelerometry, as experimental methods, was used to describe the phases of the gait cycle of healthy horses as a tool to monitor the lameness to indicate structural or functional limb injuries. Detailed information acquired through diagnostic techniques permitted a better identification of lameness.
There was a correspondence in the location of the points of maximum displacement of the limbs in both techniques.
With accelerometer technology more detailed information on the limbs movement was obtained, the five phases of the stride (swing, landing, loading, breakover, and stance) were identified for both limbs.
These techniques are applicable to other conditions either outdoors or in the lab.
Acknowledgements.- The authors thank the workers of the equestrian sports club of the Presidential Guard Staff of Mexico for their collaborations in this research and the Veterinary Doctors Jorge Fuentes G. and Felipe de J. Cortes D. for their technical assistance and clinical diagnosis of horse’s lameness. This study was supported by the Universidad Nacional Autónoma de México through the projects PAPIIT IN113710, PAPIIT IA105115 and PAPIME PE102714.
REFERENCES
Abson K. & Palmer I. 2015. Motion capture: capturing interaction between human and animal. Vis. Comput. 31(3):341-353. http://doi.org/10.1007/
s00371-014-0929-2.
Back W. & Clayton H.M. 2013. Equine Locomotion. 2nd ed. Elsevier Ltd. 528p. Back W., Barneveld A., Schamhardt H.C., Bruin G. & Hartman W. 1994. Longitudinal development of the kinematics of 4-, 10-, 18- and 26-month-old Dutch Warmblood horses. Equine Vet. J. (Suppl.17):3-6.
Barrey E. 1999. Methods, applications and limitations of gait analysis in horses. Vet. J. 157(1):7-22. http://dx.doi.org/10.1053/tvjl.1998.0297. PMid:10030124.
Chateau H., Camus M., Holden-Douilly L., Falala S., Ravary B., Vergari C., Lepley J., Denoix J.M., Pourcelot P. & Crevier-Denoix N. 2013. Kinetics of the forelimb in horses circling on different ground surfaces at the trot. Vet. J. 198(Suppl.1):e20-e26. http://dx.doi.org/10.1016/j.tvjl.2013.09.028. PMid:24511634.
Donnell J.R., Frisbie D.D., King M.R., Goodrich L.R. & Haussler K.K. 2015. Comparison of subjective lameness evaluation, force platforms and an inertial-sensor system to identify mild lameness in an equine osteoarthritis model. Vet. J. 206(2):136-142. http://dx.doi.org/10.1016/j.tvjl.2015.08.004. PMid:26361749.
Draper A.C.E., Trumble T.N., Firshman A.M., Baird J.D., Reed S., Mayhew I.G., MacKay R. & Valberg S.J. 2015. Posture and movement characteristics of forward and backward walking in horses with shivering and acquired bilateral stringhalt. Equine Vet. J. 47(2):175-181. http://dx.doi.org/10.1111/ evj.12259. PMid:24612176.
Duberstein K.J., Johnson E.L. & Whitehead A. 2013. Effects of shortening breakover at the toe on gait kinematics at the walk and trot. J. Equine Vet. Sci. 33(11):930-936. http://dx.doi.org/10.1016/j.jevs.2013.01.009.
Eckardt F., Münz A. & Witte K. 2014. Application of a full body inertial measurement system in dressage riding. J. Equine Vet. Sci.
34(11/12):1294-1299. http://dx.doi.org/10.1016/j.jevs.2014.09.009.
Halling-Thomsen M., Tolver-Jensen A., Sørensen H., Lindegaard C. & Haubro-Andersen P. 2010. Symmetry indices based on accelerometric data in trotting horses. J. Biomech. 43(13):2608-2612. http://dx.doi.org/10.1016/j. jbiomech.2010.05.004. PMid:20553684.
Hodson E., Clayton H. & Lanovaz J. 2000. The forelimb in walking horses:1, kinematics and ground reaction forces. Equine Vet. J. 32(4):287-294. http:// dx.doi.org/10.2746/042516400777032237.PMid:10952376.
Hodson, E., Clayton, H. & Lanovaz, J. L. 2001, The hindlimb in walking horses: 1. Kinematics and ground reaction forces. Equine Vet. J. 33(1):38–43. http://dx.doi.org//10.2746/042516401776767485
a sensor-based system of motion analysis for detection and quantification of forelimb and hind limb lameness in horses. Am. J. Vet. Res. 65(5):665-670. http://dx.doi.org/10.2460/ajvr.2004.65.665. PMid:15141889.
Khumsap S., Clayton H.M., Lanovaz J.L. & Bouchey M. 2002. Effect of walking velocity on forelimb kinematics and kinetics. Equine Vet J Suppl. 34(S34, Suppl.34):325-329. http://dx.doi.org/10.1111/j.2042-3306.2002. tb05441.x. PMid:12405709.
McCracken M.J., Kramer J., Keegan K.G., Lopes M., Wilson D.A., Reed S.K., LaCarrubba A. & Rasch M. 2012. Comparison of an inertial sensor system of lameness quantification with subjective lameness evaluation. Equine Vet. J. 44(6):652-656. http://dx.doi.org/10.1111/j.2042-3306.2012.00571.x. PMid:22563674.
Miro F., Vivo J., Cano R., Diz A. & Galisteo A.M. 2006. Walk and trot in the horse at driving: kinematic adaptation of its natural gaits. Anim. Res.
55(6):603-613. http://dx.doi.org/10.1051/animres:2006038.
Moore J. 2010. General biomechanics: the horse as a biological machine. J. Equine Vet. Sci. 30(7):379-383. http://dx.doi.org/10.1016/j.jevs.2010.06.002.
Moorman V.J., Reiser 2nd R.F., Peterson M.L., McIlwraith W. & Kawcak C.E. 2013. Effect of forelimb lameness on hoof kinematics of horses at a walk. Am. J. Vet. Res. 74(9):1192-1197. http://dx.doi.org/10.2460/ajvr.74.9.1192. PMid:23977891.
Rhodin M., Roepstorff L., French A., Keegan K.G., Pfau T. & Egenvall A. 2016. Head and pelvic movement asymmetry during lungeing in horses with symmetrical movement on the straight. Equine Vet. J. 48(3):315-320.
PMid:25808700.
Salo Z., Runciman R.J. & Thomason J.J. 2009. A dynamic model of a horse hoof at first contact. Biosyst. Eng. 103(3):364-373. http://dx.doi.org/10.1016/j. biosystemseng.2009.04.003.
A. & Valera M. 2013. Relationship between conformation traits and gait characteristics in Pura Raza Español horses. Arch. Tierzucht 56(13):137-148. Solé M., Santos R., Molina A., Galisteo A. & Valera M. 2014. Genetic analysis of kinematic traits at the trot in Lusitano horse subpopulations with different types of training. Animal 8(2):192-199. http://dx.doi.org/10.1017/ S1751731113002036. PMid:24230460.
Starke S.D., Witte T.H., May S.A. & Pfau T. 2012. Accuracy and precision of hind limb foot contact timings of horses determined using a pelvis-mounted inertial measurement unit. J. Biomech. 45(8):1522-1528. http://dx.doi. org/10.1016/j.jbiomech.2012.03.014. PMid:22483227.
Stashak T.S. & Hill C. 2013. Practical Guide to Lameness in Horses. 4th ed. Wiley Blackwell. 464p.
Van Heel M.C.V., Van Weeren P.R. & Back W. 2006. Compensation for changes in hoof conformation between shoeing sessions through the adaptation of angular kinematics of the distal segments of the limbs of horses. Am. J. Vet. Res. 67(7):1199-1203. http://dx.doi.org/10.2460/ajvr.67.7.1199. PMid:16817743.
Wolak M.E., Fairbairn D.J. & Paulsen Y.R. 2012. Guidelines for estimating repeatability. Methods Ecol. Evol. 3(1):129-137. http://dx.doi.org/10.1111/ j.2041-210X.2011.00125.x.
Zsoldos R.R. & Licka T.F. 2015. The equine neck and its function during movement and locomotion. Zoology 118(5):364-376. http://dx.doi. org/10.1016/j.zool.2015.03.005. PMid:26163862.