ON
C
O
-A
UTHORSHI
P
A
T
THE
IN
DI
VI
DU
AL
L
EVE
L
229
1Study presented at the VII International Seminar on Quantitative and Qualitative Studies on Science and Technology “Professor Gilberto Sotolongo Aguilar”
at the XIII International Congress of Information - INFO’ 2014. Habana, Cuba.
2KU Leuven, Centre for Research & Development Monitoring, Department of Managerial economics, Strategy and Innovation. Waaistraat 6, 3000, Leuven,
Belgium. E-mail: <[email protected]>.
3Library of the Hungarian Academy of Sciences, Department of Science Policy & Scientometrics. Budapest, Hungary. 4Figures 1-3 of the present paper are reproduced from Zhang and Glänzel (2012) with permission of the publisher.
Received in 6/27/2014 and approved in 9/9/2014.
Analysis of co-authorship patterns at the individual level
1Análise dos padrões de coautoria a nível individual
Wolfgang GLÄNZEL2, 3
Abstract
Publication activity, citation impact and communication patterns, in general, change in the course of a scientist’s career. Mobility and radical changes in a scientist’s research environment or profile are among the most spectacular factors that have effect on individual collaboration patterns. Although bibliometrics at this level should be applied with the utmost care, characteristic patterns of an individual scientist’s research collaboration and changes in these in the course of a career can be well depicted using bibliometric methods. A wide variety of indicators and network tools are chosen to follow up the evolution and to visualise and to quantify collaboration and performance profiles of individual researchers. These methods are, however, designed to supplement expert-opinion based assessment and other qualitative assessments, and should not be used as stand-alone evaluation tools. This study presents part of the results published in an earlier study by Zhang and Glänzel (2012)4 as well as new applications of these methods.
Keywords: Bibliometrics indicators. Bibliometry. Scientific production.
Resumo
Os padrões da atividade de publicação, do impacto da citação e comunicação, em geral, mudam ao longo da carreira de um cientista. A mobilidade e as mudanças radicais no ambiente de pesquisa de um cientista ou no seu perfil estão entre os fatores mais espetaculares que têm efeito sobre os padrões de colaboração individuais. Embora a bibliometria, neste nível, deva ser aplicada com o máximo de cuidado, os padrões característicos da colaboração e as mudanças na pesquisa de um cientista individual no curso de sua carreira podem ser bem representados pelos métodos bibliométricos. Uma grande variedade de indicadores e as ferramentas de rede são utili-zadas para acompanhar a evolução, visualizar e quantificar o perfil de colaboração e desempenho de pesquisadores individuais. Estes métodos são, no entanto, concebidos para complementar a avaliação baseada na opinião do especialista e em outras avaliações qualitativas, e não devem ser usadas como os únicos instrumentos de avaliação. Este estudo apresenta parte dos resultados publicados em um estudo anterior por Zhang e Glänzel, (2012)4 bem como novas aplicações desses métodos.
Palavras-chave: Indicadores bibliométricos. Bibliometria. Produção científica.
Introduction
The evolution from “little scientometrics” to “big scientometrics” (Glänzel & Schoepflin, 1994) is characterised by two cardinal signs (Glänzel & Wouters,
2013): In the last quarter of the 20th century, bibliometrics
W
. G
LÄN
ZE
L
230
perspective shift, new fields of applications and challenges have opened to bibliometrics, although many tools continued to be designed for use in the context of scientific information, information retrieval and librarianship. In other words, these became used in a context for which they were not designed (the Journal Impact Factor). Secondly, due to the dynamics in the evaluation of research, focus has shifted away from macro studies towards meso and micro studies of both actors and topics. More recently, the evaluation of research teams and individual scientists has become a central issue in services based on bibliometric data.
The rapid development of information technology has opened bibliometrics to a broader audience. Passive “consumers” in science policy, research management and the scientific community as well as active users and “semi-professionals” producing bibliometric indicators for various purposes have gained access to the necessary data and tools. Above all, electronic communication and the Web have paved the way for some type of democratisation of bibliometrics resulting in a rather vulgar version of democracy with anarchistic features (Glänzel & Hornbostel, 2011). Thus, bibliometrics has become available to practically any user, notably at the micro level.
While bibliometric macro and meso data still preserve a certain extent of anonymity, micro-level data call a spade a spade. Researchers have thus become more susceptible to the consequences of bibliometric practice since they are increasingly concerned by policy use and misuse of bibliometric methods (Glänzel & Debackere, 2003). Sometimes they even feel they are victims of the evaluation. Bibliometric techniques should therefore always be used in a proper context, notably in combination with “qualitative methods” and special caution is always called for at this level.
Recently Glänzel and Wouters (2013) formulated 10 recommendations for bibliometrics “The dos and don’ts in individual-level bibliometrics”. In particular, Glänzel and Wouters recommended the use of individual level bibliometrics always based on the particular research portfolio of the relevant researcher. The best method to do this may be the design of individual
researchers’ profiles combining bibliometrics with qualitative information about their careers and working contexts.
As regards the quantitative component of research assessment at this level, bibliometrics can be used to zoom in on a scientist’s career. Here the evolution of publication activity, citation impact, mobility and changing collaboration patterns can be monitored. It is not easy to quantify the observations and the purpose is not to build indicators for possible comparison, but to use bibliometric data to visually and numerically depict important aspects of the progress of a scientist’s career. In the following section, I will focus on scientists’ publication activity, their co-authorship patterns and the citation impact at different stages of their career.
Methods
Although bibliometrics at the level of individuals should be applied with the utmost caution, characteristic patterns in a scientist’s career can be well depicted with bibliometric methods. These methods refer to the following topics.
- Communication patterns, in general, publication activity and citation impact, in particular, change in the course of a scientist’s career.
- Mobility, promotion or a change in a scientist’s research environment, usually results in structural changes of collaboration patterns as well.
ON
C
O
-A
UTHORSHI
P
A
T
THE
IN
DI
VI
DU
AL
L
EVE
L
231 career. Some of these examples are taken from the
afore-mentioned study by Zhang and Glänzel, others have been prepared for the present paper. In particular, the following five issues will be analysed.
- Evolution of publication activity and citation impact in the scientist’s life cycle;
- Topicality of highly cited papers;
- Evolution of the number of co-authors in the course of a scientist’s career;
- Partnership ability and role of co-authorship in productivity and citation impact;
- The scientist’s position and role in his/her collaboration network.
Of course, bibliometrics alone cannot answer all questions concerning the performance of individual scientists, but it can already provide a valuable indication that allows deeper analysis with the help of qualitative information about careers and working contexts, as was mentioned in the introduction.
All methods presented in this section will be illustrated by examples. Authors in several research fields appearing in these examples will, however, be treated anonymously.
Bibliometric career analysis of individual scientists
Cronin and Meho (2007) have previously pointed out the close relationship between creativity and age in the field of information science. The easiest way to show this is certainly the application of age pyramids. This idea goes back to demographics, where the population structure, composition and age of the human population is quantitatively described. The population pyramid is actually an elementary tool to reflect the age structure of a given population. In demographics the age distribution in a human population is plotted in a double bar diagram, in particular, male age groups are plotted against the corresponding female groups. Usually about 5-7 paradigmatic shapes are distinguished. These reflect different paradigmatic types of growth characteristics of a given population. Here we focus just on three typical shapes, namely:
- triangle, pagoda and bell shape (three cases of growth patterns with high fertility but different extent of infant mortality);
- beehive shape (stands for stationary structure with low infant mortality);
- “onion” shape (reflects superannuation of the population).
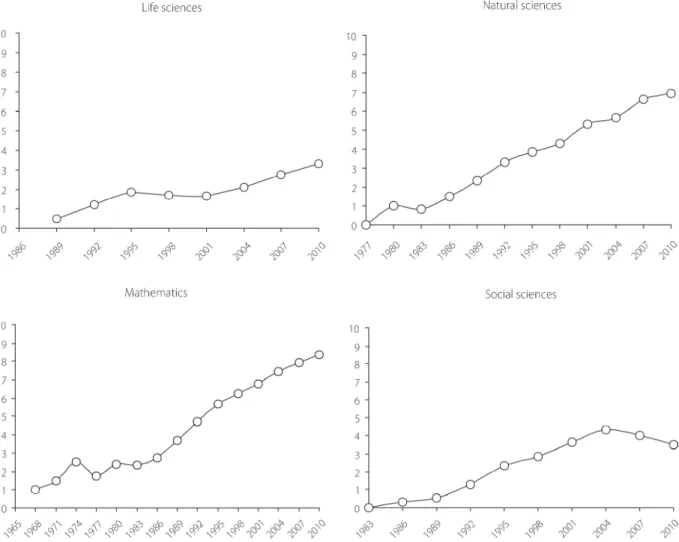
Analogously, “age pyramids” using double bar diagrams of publication activity (at the given time period) and citation impact (based on citations received in that time period to all previously published papers) - instead of juxtaposing gender-related age groups in human population - can be used to reflect important changes in the course of a scientist’s career (Zhang & Glänzel, 2012). The authors have pointed out essential differences between the original demographic and “scientometric” age-pyramid model. While in population, data bars representing male and female groups usually follow the same basic shape, in the bibliometric case the shapes for publications and citations might distinctly differ. For instance, triangle-shaped productivity might be contrasted by an onion-shaped citation impact. In this context I would like to stress that bibliometric age pyramids reflect both subject specific peculiarities and individual “performance” patterns. This is shown using the example of four selected scientists already introduced by Zhang and Glänzel (2012). These scientists stand for four different research areas, particularly, the life sciences, natural sciences, mathematics and the social sciences. Due to subject-specific biases the shape of the age distribution in the natural sciences and in mathematics is expected to be “flatter” in contrast with more skewed distributions in life sciences and social sciences. Moreover, in these general patterns we find interesting individual characteristics in the pyramid shapes of the four authors (Figure 1).
W
. G
LÄN
ZE
L
232
discussed by Zhang and Glänzel. One should bear in mind that citation impact refers to the present and the past, while productivity always reflects the situation of the period under study. Further analysis and interpretation of these shapes might therefore reveal details on the relationship between the impact of recent and former research. This can be deepened by analysing the constitution of an author’s highly cited papers over time. This idea goes back to the h-index sequence proposed by Liang (2006) to measure the dynamics of the h-index in a scientist’s career. This idea has been extended by Zhang and Glänzel (2012) to the mean age of publications of the h-core sequence, where the h-core
sequence is defined analogously to the core for the h-index sequence. The calculation of the mean age sequence of the h-core follows the algorithm proposed by Zhang and Glänzel (2012):
- The h-core is formed by those papers that have received at least h citations, where h denote the actual value of an h-index.
- The h-core sequence: we first calculated the h-index for papers published in the first year of their career, then the first two years, the first three years, and so on until the most recent year is reached.
- The mean age of publications of this h-core sequence is calculated, which expresses whether the Figure 1. Scientometric age pyramids for four scientists according to Zhang and Glänzel (2012).
ON
C
O
-A
UTHORSHI
P
A
T
THE
IN
DI
VI
DU
AL
L
EVE
L
233 more recent or the older publications are predominant
in the respective h-core.
According to the above-mentioned study by Zhang and Glänzel (2012) we can distinguish four paradigmatic patterns with case 1 representing the standard situation. A convex shape stands for “superannuation” of citation impact (mainly old papers are cited), while a concave age curve reflects an increasing number of recent papers entering the h-core.
- The mean age of the h-cores follow a linear function of time. This reflects a steady growth of the age of highly-cited papers.
- A convex shape reflects accelerated growing age of highly-cited papers. In verbal terms, most cited papers have rather been published in earlier stages of the scientist’s career.
- A concave shape reflects decreasing age of highly-cited papers. This is the opposite situation to the previous case, among the most cited papers one finds more recent ones.
- An “indefinite” shape covering all cases not listed above.
The mean age sequences of the h-core for the same four scientists in the “demographic” representation are plotted in Figure 2. The shape for authors #2 might be considered to be in line with the standard (linear curve), while the age sequence of author #4 corresponds to the concave case. The fluctuations in the 1970s (author #3) bear witness to quite dramatic changes in the constitution of the scientist’s h-core. Publication activity, citation impact and their change in time are, however, not independent of collaboration and team work.
W
. G
LÄN
ZE
L
234
Number and role of authors, frequency of co-authorship might strongly affect bibliometric indicators. A logical consequence is therefore the extension of individual-level bibliometrics to the analysis of collaboration patterns. This will be done in the following subsection.
Co-authorship patterns of individual
scientists
In order to quantify the above-mentioned connectedness, Zhang and Glänzel (2012) have analysed “the extent of co-authorship”, which denotes the number of different co-authors of the scientist under study. The objective was to analyse whether the changing size of
cooperation has any influence on the authors’ productivity. A positive relation between collaboration and productivity has been found in early scientometric studies: Beaver and Rosen (1979) concluded that collaboration is associated with higher productivity. This finding has been reconsidered by Braun et al. (2001) and Glänzel (2002), who found that increasing co-operativity goes only to a certain extent with higher publication activity and beyond some subject-specific threshold co-operativity turns into a “negative” effect in terms of productivity. In addition, the generally positive effect of collaboration on citation impact in practically all subject fields and at all levels of aggregation has been shown (Narin & Whitlow, 1990; Moed et al., 1991; Narin et al., 1991). This consequently raises some questions, namely:
ON C O -A UTHORSHI P A T THE IN DI VI DU AL L EVE L 235 how does the co-operativity of individual scientists
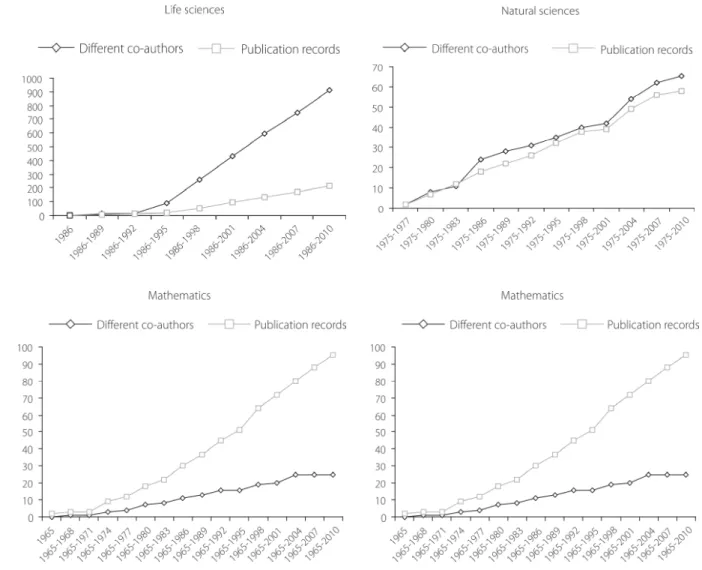
changes with their productivity in the course of their career? and is there any positive or negative effect of intensive, stable or occasional collaboration links on productivity and possibly on citation impact as well? “The extent of co-authorship” can be expressed by the number of different co-authors a scientist has in a given period. Figure 3 shows the cumulative number of (different) co-authors and publications again for the same four scientists as above. Furthermore, in this context subject-specific effects are visible; for instance, co-authorship of the mathematician seems to be limited by the smaller community as compared to the scientist in the life sciences. Thus the scientists in life sciences and natural sciences, in general, had more co-authors than publications, and the cases of mathematics and social sciences show the opposite picture (Zhang & Glänzel, 2012).
More recently, some new indexes have been proposed to quantify effects of co-authorship in the context of productivity and citation impact. The first one was proposed by Hirsch (2010). He proposed a new index called (“non-selfconsistent”) ‘h to characterize the scientific output of a researcher, which takes into account the effect of multiple co-authorship. According to its definition A paper belongs to the ‘h core of a scientist if it has ‘h citations and in addition belongs to the h-core of each of the co-authors of the paper.
Schubert (2012) goes a step further. He defined a Hirsch-type index to characterise “partnership” in scientific publication output: An actor is said to have a partnership ability index , if with of his/her n partners had at least joint actions each, and with the other (n - ) partners had no more than joint actions each.
Similarly to the h-index, which combines publication activity with citation impact, the -index combines two important features: publication activity with the frequency of joint activity. Some basic properties of the index are listed below.
- = 0: The author has only single-authored papers.
- = 1: Three cases are possible.
1. The author has only double-authored papers with the very same co-author each (monogamy).
2. If the author had an arbitrary number of co-authored papers with no co-authors occurring more than once (total promiscuity).
3. If the author had an arbitrary number of double-authored papers with the same co-author and an arbitrary number of co-authored papers with other authors such that no co-author occurs more than once (Rousseau, 2012).
- > 1: In all other cases.
According to Schubert, low values reflect a scanty or inconsistent set of co-authors, while high values reflect a wide and persistent co-authorship network.
After having recalled these new measures, we will use Hirsch-type indices along with egocentric networks to shed some light on collaboration patterns in a scientist’s career. The aim is to supplement bibliometric indicators at this level, in order to show the extent to which the author’s performance is related to his/her own and the colleagues’ activity, position and impact. In order to analyse scientists’ position among their collaborators and co-authors the following set of indicators is used.
- Number of papers and h-index
- Number and share of single authored papers in all papers
- Number and share of single authored papers in the h-core
- Share of h-core co-authors
-index
In order to illustrate the analysis, 13 collaborating authors were chosen as an example. The authors have European affiliation and are active in information science. Their physical age ranges between about 35 to 80 years. Again authors are anonymised and this time denoted by the capital letters A - M, where author “A” is chosen for the egocentric network model. Using the above-mentioned indicators in conjunction with network analysis, among others, the following questions can be answered.
- Do authors preferably work alone, in stable teams, or do they rather prefer occasional collaboration?
W . G LÄN ZE L 236
The question of who is collaborating with whom in scientific research - and are there general rules for co-operation of authors of similar/different academic age and position - has been studied in bibliometrics for a long time. Kretschmer (1994), for instance, has analysed aspects of social stratification in scientific collaboration. She found that extramural collaboration is rather characterised by similarity of the social status whereas intramural collaboration shows significant differences of the social status of the co-authors. She called these effects “Birds of a feather flock together” and “Opposites attract” and observed that both are frequent in an academic career and rather depend on the nature of collaboration. In a more recent study, Hu et al. (2013) attempted to answer the question of whether scientists of young academic age prefer collaborating with older ones and vice versa. They concluded on the basis of their observations that age, in general, does not play a determinant role. Thus there is no general answer and co-authorship links need to be analysed individually indeed. This will be done using the above example. Answering the above questions might help understand the scientist’s own role and position in his/her research environment.
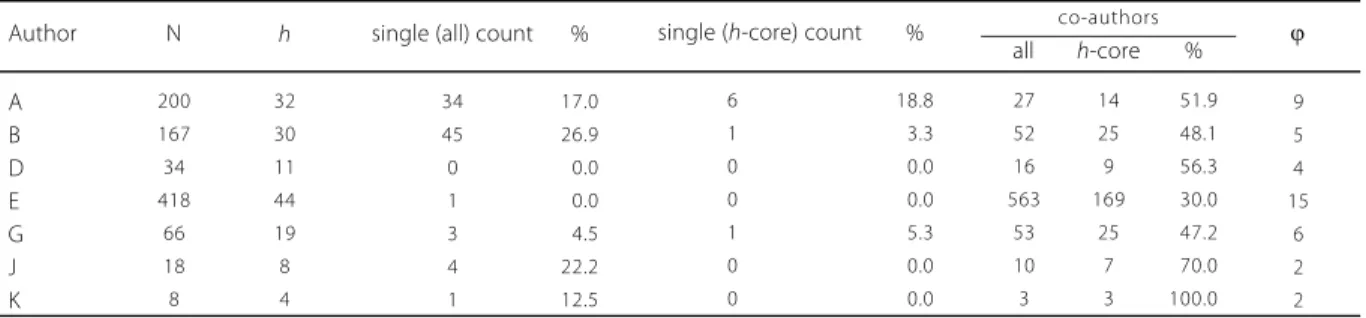
The indicator values for seven of the 13 authors can be found in Table 1. Since all authors are collaborators to a certain extent, one cannot expect serious subject-based biases across their profiles. All characteristics are therefore mainly due to performance, (academic) age and position. Authors “A”, “E” and “B” are clearly the “seniors” among the selected collaborating scientists. The number
and share of co-authors as well as their share in the h-core provide important information about the co-authors’ role in producing research output and in highly cited papers, in particular.
Comparison of the corresponding indicator values of author “E” and “J” allows the conclusion that above all the co-authors of “J” are responsible for “J’s” high-impact papers. Usually about 50% of the co-authors contribute to high-impact papers. This alone does not point to continuous research in stable teams. The remarkably large number of “E-type” co-authors, which even exceeds the number of his papers, might only serve as a counter example. Collaboration with “E” is, however, not merely occasional as his large -value index substantiates. There is another remarkable detail: -values do not necessarily correlate with the number of co-authors. The comparison of “A’s” large -index with those of “B” and “G” shows that a higher index value might be associated with a lower number of co-authors.
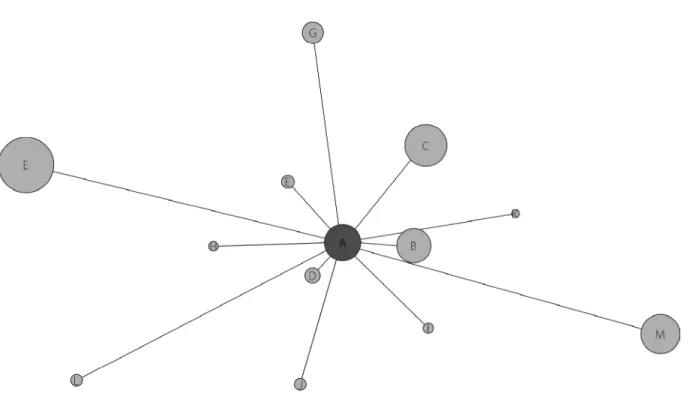
The above observations can be deepened by the analysis of bilateral collaboration links. Figure 4 shows the egocentric network from the viewpoint of author “A”. Here all 13 selected co-authors are displayed. The size of the circles is proportional to the corresponding scientists’ publication output; the thickness of lines corresponds to the strength of co-authorship links. According to publication output, “B” and “M” can therefore be considered ‘peers’ with respect to “A”, while “D”, “F”, “H”, “I”, “J”, “K”, “L” are his “junior” collaborators. By contrast, “E” and “C” can be considered “seniors”. Strong links with “juniors” often point to the role of supervisor, and indeed, “D”, “H”
Table 1. Hirsch-type indicators to characterise co-authorship.
A B D E G J K 200 167 34 418 66 18 8 32 30 11 44 19 8 4 34 45 0 1 3 4 1 17.0 26.9 00.0 00.0 04.5 22.2 12.5
Author N h single (all) count %
6 1 0 0 1 0 0 18.8 03.3 00.0 00.0 05.3 00.0 00.0
single (h-core) count %
27 52 16 563 53 10 3 051.9 048.1 056.3 030.0 047.2 070.0 100.0
all h-core %
14 25 9 169 25 7 3 9 5 4 15 6 2 2 co-authors
ON
C
O
-A
UTHORSHI
P
A
T
THE
IN
DI
VI
DU
AL
L
EVE
L
237
and “K” were PhD students of “A”. The strong link with peer “B”, however, reflects long-time collaboration in a stable team and the weak link with “senior” “D”, finally, reveals occasional co-author relationship.
Both exercises proposed in this subsection, namely the co-authorship-related indicators and the network analysis, provide details that complement the “demographic” indicators described in Section Bibliometric career analysis of individual scientists by shedding light on the scientist’s position in the network of scholarly communication. A dynamic approach to capture the evolution of the scientist’s position is also possible.
Conclusion
Bibliometric indicators and network analysis provide valuable information on the performance of individual scientists. However, this information should be considered supplementary. In individual research assessment, the emphasis should always be laid on ‘qualitative’ methods. In individual-level evaluation, the added value of bibliometrics depends on how and in
which context bibliometrics is applied. The advantage of obtaining scores and numerical values, of repeating the exercise years later using the same methods, and of having the opportunity of monitoring the change in values over time should, of course, not be underestimated. Bibliometric in-depth analysis of the evolution of publication activity and citation impact in the course of a scientist’s career can also help interpret bibliometric standard indicators at this level.
Co-authorship analysis can be used to determine the position of an author in the collaboration network and might provide important information on the scientists’ own contribution to the research output reported in their Curriculum Vitae. In conjunction with the h-core analysis, this reveals details on the extent of the scientist’s real contribution to his/her research output and the citation impact these publications have achieved.
Acknowledgement
The author would like to thank Sarah Heeffer, KU Leuven, for her contribution to collecting, cleaning and processing the underlying bibliographic data.
Figure 4. Egocentric network of an author allowing conclusions on the role of co-authors using Pajek with Kamada-Kawai layout.
W
. G
LÄN
ZE
L
238
References
Beaver, D.D.; Rosen, R. Studies in scientific collaboration: Part II: Scientific co-authorship, research productivity and visibility in the French elite. Scientometrics, v.1, n.2, 133-149, 1979.
Braun, T.; Glänzel, W.; Schubert, A. Publication and co-operation patterns of the authors of neuroscience journals. Scientometrics, v.51 n.3, p.499-510, 2001.
Cronin, B.; Meho, L. Timelines of creativity: A study of intellectual innovators in information science. Journal of the American Society for Information Science and Technology, v.58, n.13, 1948-1959, 2007.
Glänzel, W.; Schoepflin, U. Little scientometrics, big scientometrics - and beyond. Scientometrics, v.30 n.2-3, p.375-386, 1994.
Glänzel, W. Co-authorship patterns and trends in the sciences (1980-1998): A bibliometric study with implications for database indexing and search strategies. Library Trends, v.50, n.3, p.461-473, 2002.
Glänzel, W.; Debackere, K. On the opportunities and limitations in using bibliometric indicators in a policy relevant context. In: Ball, R. (Ed.). Bibliometric analysis in science and research: Applications, benefits and limitations. Zürichi: Publication Forschungszentrum, 2003. p.225-236.
Glänzel, W. et al. A concise review on the role of author self-citations in information science, bibliometrics and science policy. Scientometrics, v.67, n.2, p.263-277, 2006.
Glänzel, W.; Hornbostel, S. History and institutionalisation of scientometrics. Vienna: European Summer School for Scientometrics, 2011.
Glänzel, W.; Wouters, P. The dos and don’ts in individual-level bibliometrics. In: International Conference on Scientometrics and Informetrics, 14., 2013, Vienna. Electronic proceedings… Vienna: ISSI, 2013. v.1. Available from: <http://www.issi 2013.org/Images/ISSI_Proceedings_Volume_I.pdf>. Cited: May, 2014.
Hirsch, J.E. An index to quantify an individual’s scientific research output that takes into account the effect of multiple co-authorship. Scientometrics, v.85, n.3, p.741-754, 2010. Hu, Z. et al. Do new scientists prefer collaborating with old scientists? And vice versa? In: International Conference on Scientometrics and Informetrics, 14., 2013, Vienna. Electronic proceedings… Vienna: ISSI, 2013. v.2. Available from: <http:// www.issi2013.org/Images/ISSI_ Proceedings_Volume_ II.pdf>. Cited: May, 2014.
Kretschmer, H. Co-authorship networks of invisible colleges and institutional communities. Scientometrics, v.30, n.1, p.363-369, 1994.
Liang, L. H-index sequence and h-index matrix: Constructions and applications. Scientometrics, v.69, n.1, p.153-159, 2006.
Moed, H.F. et al. International scientific co-operation and awareness within the European Community: Problems and perspectives. Scientometrics, v.21 n.3, p.291-311, 1991. Narin, F.; Stevens, K.; Whitlow, E.S. Scientific co-operation in Europe and the citation of multinationally authored papers, Scientometrics, v.21, n.3, p.313-323, 1991.
Narin, F.; Whitlow, E.S. Measurement of scientific co-operation and co-authorship in CEC-related areas of science. v. 1-2, Brussels: Commission of the European Communities, 1990.
Rousseau, R. Comments on a Hirsch-type index of co-author partnership ability. Scientometrics, v.91, n.1, p.309-310, 2012.
Schubert, A. A Hirsch-type index of co-author partnership ability. Scientometrics, v.91, n.1, p.303-308, 2012.
Wouters, P. The citation: From culture to infrastructure. In: Blaise, C. & Cassidy, S. (Ed.). Next generation metrics: Harnessing multidimensional indicators of scholarly performance. Cambridge: MIT Press, 2014. p.76-116.