Reticulocyte count: comparison among methods
Contagem de reticulócitos: comparação entre métodos
Karina Augusta Viana1; Olindo Assis Martins Filho2; Luci Maria Sant’Ana Dusse3; Renato Sathler Avelar4; Danielle Marquete Vitelli Avelar5;
Beatriz Carvalho6; Claudia Maria Franco Ribeiro7; Lis Ribeiro do Valle Antonelli8; Andrea Teixeira9; Maria das Graças Carvalho10
First submission on 17/08/14; last submission on 25/08/14; accepted for publication on 07/09/14; published on 20/10/14
1. Master’s degree in Pharmaceutical Sciences from Universidade Federal de Minas Gerais (UFMG); pharmacist at Belo Horizonte City Hall.
2. Post-doctoral degree in Immunology from University of Texas Houston/United States of America (UTH/USA); full researcher at Centro de Pesquisas René Rachou/Fundação Oswaldo Cruz (CPqRR/Fiocruz).
3. Post-doctoral degree in Hematology from the University of Southampton, England; senior associate professor at the Department of Clinical and Toxicological Analysis of Faculdade de Farmácia (FaFar) of UFMG.
4. Post-doctoral degree in Immunology from CPqRR/Fiocruz; professor at Centro Universitário Newton Paiva.
5. Post-doctoral degree in Immunology from CPqRR/Fiocruz; head of the Cytometry Service at Laboratório de Patologia Clínica São Paulo.
6. Master’s degree in Microbiology from UFMG; head of the Hematology Service at Fundação Centro de Hematologia e Hemoterapia de Minas Gerais (Fundação Hemominas). 7. Physician of Laboratório de Patologia Clínica São Paulo; owning partner of Clínica Hematológica.
8. Post-doctoral degree in Immunology from the National Institutes of Health/United States of America (NIH/USA); associate researcher in Public Health at CPqRR/Fiocruz. 9. Post-doctoral degree in Immunology from the Food and Drug Administration/United States of America (FDA/USA); associate researcher in Public Health at CPqRR/Fiocruz. 10. Post-doctoral degree in Hematology from the Maastricht University, in Netherlands; full professor at the Department of Clinical and Toxicological Analysis of FaFar/UFMG.
ABSTRACT
Introduction: The automated counting of reticulocytes has some advantages over the manual method routinely used in clinical laboratories. Technological innovations provide more statistically reliable results, while optimizing the time to perform this test. However, the cost for implementing the automated procedure in laboratory routines still constitutes a barrier to its use in small- and medium-size Brazilian laboratories. Objective: This study evaluated the performance of a new laboratory protocol for reticulocyte counting by low cytometry using acridine orange (FC/AO), compared with the manual method and with another automated one by low cytometry using the commercial kit BD Retic-Count (FC/RC). Conclusion: The results showed that, besides being comparable to the manual method, still considered standard, the evaluated new protocol is economically more advantageous than the automated methods currently available, and its cost is comparable to that of the manual method for laboratories that already have appropriate equipment and infrastructure.
Key words: reticulocyte count methods; low cytometry; acridine orange; BD Retic-Count.
INTRODUCTION
The reticulocyte counting methods at clinical laboratories are currently divided into manual and automated. The manual reticulocyte counting by microscopy became traditional and has been considered the standard method since 1940, for its simplicity and low cost(13, 14). However, it presents some inconvenience and
limitations, such as lack of accuracy, low reproducibility, time spent in the laboratory routine, lack of quality of the used stains, inappropriate blood ilms. The observer’s visual acuity and patience, the technician’s experience to distinguish reticulated cells from other cells with inclusions that also stain with the dye, besides the quality and the resolution power of the microscope are other important factors that affect the accuracy of the manual reticulocyte count(10, 20).
Studies about reticulocyte counting by automated methods have demonstrated satisfactory results, coming to be more frequent and improved(6, 13). The automated count may be performed using
a luorochrome for staining the remnant ribonucleic acid (RNA) present at the reticulocyte. After being stained, the luorescent cells can be enumerated using a low cytometer of general use(2).
Technological innovations have been making reticulocyte count results more and more reproducible and exact for clinical use, when compared with the manual method. Results are statistically more reliable because of the huge amount of counted cells(3, 9, 13, 15). In spite of
the great advances and advantages that reticulocyte count automation may offer, commercial kits for the method are highly expensive, and are not widely used in clinical laboratories that have the technology(1).
The present study compared the results of a laboratory protocol for reticulocyte counting by low cytometry using acridine orange
(FC/AO), which presents low cost for laboratory use(21), with two
other reticulocyte counting methods routinely used in clinical laboratories. One of these methods is the manual (reference); the other, an automated low citometry (FC) method using the commercial kit BD Retic-CountTM (FC/RC).
MATERIAL AND METHODS
This study is part of a project named “Methodological innovations in low cytometry applied to hematology”, approved by the Research Ethics Committee of Universidade Federal de Minas Gerais (UFMG) and the Research Ethics Committee of Fundação Centro de Hematologia e Hemoterapia de Minas Gerais (Fundação Hemominas).
For conduction of the experiments, the following were used: saline solution (SS) (Farmax), BD Retic-CountTM kit (Becton
Dickinson), brilliant cresyl blue (BCB) (Laborclin) dye, phosphate buffered saline (PBS) (0.015M, pH7.2), 5 mg/l AO solution. The AO solution was prepared directly from a concentrated commercial reagent, being kept shielded from light.
The blood samples used in this study came from Fundação Hemominas healthy donors and outpatients with anemia, mainly sickle-cell disease. Venous blood was collected from each patient in a Vacutainer tube containing ethylenediamine tetraacetic acid (EDTA K3), and a small amount (around 1 ml) was set apart and used for the conduction of this study. These aliquots were transferred to a 12 × 75 mm polystyrene tube and processed at a clinical analysis laboratory, where the BD FACSCalibur low cytometer was used during experiments.
A comparison was drawn between the three reticulocyte counting methods (one manual and two automated FC, using AO and the BD Retic-CountTM kit). To this end, 50 blood
samples from healthy donors of Fundação Hemominas (group C), with normal reticulocyte count (reference value [RV]: 0.5%-2%), were analyzed. Anemia outpatients of the same institution, principally those with sickle-cell disease (HbSS), with reticulocytosis, were also included in the study: 50 blood samples with reticulocyte count ranging from 2.1% to 10% (group PI), and 50 samples of patients with count above 10% (group PH) were analyzed. Patients were classiied into these percentage groups, according to their reticulocyte count results obtained by the manual method.
Each sample underwent two manual reticulocyte counts, one count by the FC automated method using a commercial kit, one by the laboratory protocol assessed in this work (FC/AO). The
supravital stain used in the manual method was BCB (Laborclin), and the commercial kit was BD Retic-CountTM (Becton Dickinson).
All protocols of the methods evaluated in this study are described in the topic “Methods used for reticulocyte count”.
These groups were compared in pairs: results of the manual method averages counted in duplicate, and results of the automated methods that used the commercial kit and the evaluated protocol each one counted only once. Thus, it was possible to assess the capacity of the latter to produce results concordant with those obtained by other routine procedures.
METHODS USED FOR RETICULOCYTE COUNT
Reticulocyte count by the manual method
The reticulocyte count by conventional microscopy was performed according to a standard protocol routinely used at the hematology laboratory of Faculdade de Farmácia (FaFar) of UFMG.
To 12 × 75 mm polystyrene tubes, aliquots of 50 µl of total blood collected in EDTA and 50 µl of BCB stain were added to each sample. The mixture was homogenized and incubated during 15 minutes in a water bath, at 37°C, shielded from light. Next, blood ilms were prepared in glass slides for microscopy. The counting was done using a microscope with 100× immersion objective lenses, and the number of reticulocytes was calculated considering the number of these cells in 1,000 assessed erythrocytes. The results were expressed as reticulocyte percentage values.
Reticulocyte count by FC/AO
The laboratory protocol for reticulocyte count by FC/AO was applied as described by Viana et al. (2014)(21). For each sample,
two 12 ×75 mm polystyrene tubes were used. To each of them 1 ml of saline and 5 µl of total blood collected in EDTA were added. To just one of the tubes 10 µl of luorochrome AO 5 mg/l were added. The mixtures were homogenized, left at room temperature and shielded from light during 30 minutes. Immediately after this waiting time, the preparation was obtained in the low cytometer. Firstly, the preparation of the tube without luorochrome (blank) was obtained; then, of the tube containing the sample, to which AO was added to stain the reticulated cell.
Cells were acquired in a BD FACSCaliburTM cytometer; and the
Reticulocyte count by FC/RC
Reticulocyte counting by FC/RC was done according to recommendations by the manufacturer, using the BD FACSCaliburTM
cytometer and the Cell Quest software for data analysis.
For each sample, two 12 × 75 mm polystyrene tubes were used. To one of them (blank) 1 ml PBS and 5 µl of a blood sample collected in EDTA were added. To the other tube, 1 ml Retic-Count reagent and 5 µl of the same sample were added. Preparations were homogenized and left during 30 minutes at room temperature, shielded from light. Immediately after this waiting time, the reading was taken in the low cytometer. Firstly, the reading of the blank was taken, and then, of the tube containing the sample, to which the Retic-Count reagent was added.
Blood cells were acquired in cytometer BD FACSCaliburTM, and
the data were analyzed by Cell Quest Pro software. A total of 50,000 events were analyzed, employing the necessary adjustments.
Strategy for reticulocyte analysis by FC
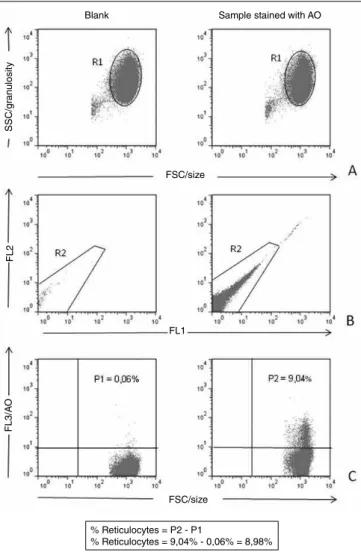
The basic strategy for the analysis of data obtained by FC for the enumeration of reticulocytes using AO (Figure 1) was conducted initially employing dot-plot graphs of forward scatter channel (FSC) (size) versus side scatter channel (SSC) (granulosity) and FL1 versus FL2. The homogeneous population distribution in these graphs allowed the positioning of windows over the regions corresponding to cells of the erythrocytic strains (R1 and R2). With the combination of regions R1 and R2, the gate used for determination of reticulocyte percentage in the sample was established, and graphs of FSC punctual distribution (size) versus AO (FL3) were produced. Hence, quadrants were positioned to determine the percentage of cells stained by AO. The percentage of reticulocytes was obtained by the difference between results of the tube to which luorochrome AO was added and the “blank” of each sample.
The strategy of analysis for samples stained by the BD Retic-CountTM kit reagent, which is a thiazole orange (TO) solution, was
implemented according to the manufacturer.
Statistical data analysis for comparison of the
assessed methods
The obtained data were tabulated and analyzed by Excel program and SPSS v.13.0 statistical software.
For method comparison, linear regression models were adjusted, and the correlation between them was assessed. Dispersion graphs were also produced, and the paired t test was
FIGURE 1 – Strategy for analysis of the reticulocyte enumeration by CF using AO A) selection of the population of interest based on morphological aspects (R1); B) selection of the homogeneous population (R2), excluding possible interfering factors; C) percentage quantification of positive cells in the upper right quadrant for the population of selected cells from the proposed gate (R1 and R2)
FC: flow cytometry; AO: acridine orange; SSC: side scatter channel; FSC: forward scatter channel.
conducted, as recommended by the National Committee for Clinical Laboratory Standards (NCCLS, 2004)(11). However, for a
more reliable analysis, as data were not normally distributed, non-parametric tests were carried out, including the Wilcoxon test and the Spearman’s correlation coeficient.
RESULTS
Comparison between laboratory protocol FC/AO
and two other methods
The comparison between the results obtained by FC and the manual method was made by graphs produced with the Excel program, presenting 95% conidence intervals (CI) for binomial
FSC/size
Blank Sample stained with AO
SSC/g
ran
ulosit
y
FSC/size
FL2
FL1
FL3/A
O
% Reticulocytes = P2 - P1
variables, which represent the standard error of the reference method (Figures 2 and 3). Linear regression analysis and paired t test were also carried out, by means of the statistical program SPSS v.13.0. Linear regression analyses of the assessed methods are summarized in Table 1.
In general, the results presented good correlation between methods, and the correlation obtained between the manual method and the automated method using the BD Retic-CountTM kit (r =
0.959) was close to that observed betweenthe manual method and the automated method using AO (laboratory protocol) (r = 0.955). The comparison between the tested methods by FC and the manual method (reference), according to NCCLS, as well as linear regression lines are
represented in Figures 2 and 3, in which the tested method was FC using the luorochrome AO (new protocol) and FC/RC, respectively.
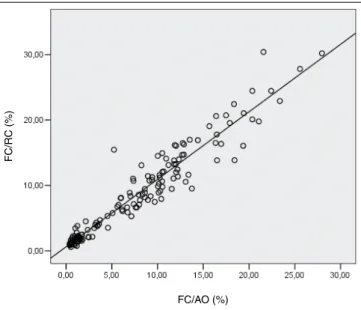
The analysis of correlation between the two automated methods is also represented inFigure 4.
The t test was carried out with the results obtained from all analyzed samples (n = 150). A signiicant difference was observed between the results of the groups: manual × FC/RC, and FC/AO × FC/RC (p < 0), where FC/RC represents the FC automated method using the BD Retic-CountTM kit; and FC/AO, the
laboratory protocol. Between the groups manual × FC/AO, there was no signiicant difference, with p = 0.1.
The data obtained through the use of all the assessed reticulocyte counting methods did not present normal distribution. For this reason, the Wilcoxon test was performed to compare groups, as well as the Spearman’s (r) correlation coeficient (Table 2). The results presented good correlation between methods. The Wilcoxon test also indicated signiicant difference between groups (p < 0), except the manual × FC/AO (p = 0.183).
TABLE 1 – Comparison of reticulocyte count (%) between different methods
Methods Sampling a b r r2
Manual × FC/AO 150 0.524 0.899 0.955 0.912
Manual × FC/RC 150 0.827 0.97 0.959 0.92
FC/AO × FC/RC 150 0.618 1.032 0.961 0.923
Analysis by linear regression (Y = a + bX), in which – a: intercept; b: constant of the line slope; r: correlation coefficient; r2: determination coefficient.
FC/AO: reticulocyte count method by flow cytometry using acridine orange; FC/RC: reticulocyte count method by flow cytometry using kit BD Retic-CountTM.
FIGURE 2 – Reticulocyte count (%) by the manual method and by the new CF protocol using AO (n = 150). Continuous lines: 95% binominal confidence interval; dashed lines: linear regression between the analyzed methods; Y: 0.524 + 0.899X; r2: 0.912; r: 0.955 FC: flow cytometry; AO: acridine orange.
FC/A
O (%)
Manual technique (%)
Manual technique (%)
FC/RC (%)
FIGURE 3 – Reticulocyte count (%) by the manual method and by CF using reagent BD RC (n = 150). Continuous lines: 95% binominal confidence interval; dashed lines: linear regression between the analyzed methods; Y: 0.827 + 0.97X; r2: 0.92; r: 0.959
FC: flow cytometry; RC: Retic-CountTM.
FIGURE 4 – Reticulocyte count (%) by the automated methods by CF using AO and the kit BD RC (n = 150). Y: 0.618 + 1.032X; r2: 0.923; r: 0.961
FC: flow cytometry; RC: Retic-CountTM; AO: acridine orange.
FC/RC (%)
DISCUSSION OF RESULTS
Comparison between the standardized reticulocyte
count protocol (new protocol) and two other
methods
Buttarello et al. (2001)(4) analyzed comparatively ive different
automated methods and veriied that they presented a tendency to overestimate the lower values and underestimate, in less extent, the values for samples with high reticulocyte counts. This observation was conirmed by the linear equation (Y = a + bX), in which the intercept (a) was greater than zero; and the slope (b), smaller than 1. As to the methods tested in this study (Table 1), by linear equation analysis of linear regression (intercept value [a]), both the protocol using AO and the commercial kit showed also a tendency to overestimate the lowest values found in the manual methods (Figures 2 and 3). When the comparison is drawn between the two automated methods, in samples with low reticulocyte count, results using Retic-Count tend to be higher than those obtained using AO. In samples with high reticulocyte counts, the value of the constant of the line slope is very close to 1, what makes the values obtained with Retic-Count more concordant with those obtained by AO (Table 1 and Figure 4).
The results found in this work, when comparing the methods by FC and the manual, agree with the observation by Davis et al. (1990)(8), which reported a reticulocyte count presenting a positive
bias (0.2%-0.8%) for results obtained by FC in sample values within the normal range. According to these authors, this bias is due to the ability of luorescent stains to better distinguish reticulocytes with low levels of RNA from the population with mature erythrocytes. When the count is done by microscopy, using a supravital stain, analysts generally entertain doubts over identifying reticulocytes of group IV, that is, more mature reticulocytes with few residual RNA granules. These authors also reported a positive bias (0.5%) of results obtained with TO compared with those with AO. Besides, they state this bias is not clinically signiicant, resulting from
intrinsic properties of luorochromes, as well as from algorithmic differences of histogram analysis.
The analysis of linear regression in this study permitted to verify the possibility of interchange between methods. Both FC/AO and FC/RC reticulocyte counts presented good correlation between them and with the manual method (see r value in Table 1 and Figures 2, 3, and 4).
The analysis of reticulocyte count by FC/AO and the manual method presented a 0.955 correlation coeficient (Table 1), quite satisfactory and compatible with the results obtained for other automated methods evaluated in the literature(16, 18, 23), when
compared with the manual count. In relation to the manual method, the present study observed a higher correlation coeficient when the Retic-Count reagent (r = 0.959) (Table 1) was used, instead of the laboratory protocol, FC/AO. The encountered value was close to that reported by Carter et al. (1989)(5), whose study presented r = 0.98,
considering the manual method versus the count in the FACS 420 cytometer, using TO. Peng et al. (2001)(12), using the Retic-Count
reagent and Elite ESP low cytometer (Beckman Coulter), on their turn, obtained a little lower r value (r = 0.962).
In general, the method using the TO dye presents good correlation with other automated methods. The present study, when comparing the protocol FC/AO with FC/RC for reticulocyte count, found r = 0.961 (Table 1 and Figure 4). Davis et al.(1990)(8)
obtained r = 0.95 (Y = -0.5 + 0.98X) when comparing the methods
using AO and TO. Briggs et al. (2001)(3) compared two other
automated methods, the ABX Pentra 120 Retic Blood, using TO dye, and the Sysmex XE2100, using auramine O. The correlation observed between the two methods for reticulocyte count was 0.95 (Y = 0.807 + 0.832X). Rudensky (1997)(17) assessed the Coulter
STKS analyzer and the new methylene blue stain in FC using Retic-Count, having obtained r = 0.848 (Y = 1.393 + 0.742X).
Once the obtained data were not normal, the Wilcoxon test was performed to evaluate the difference between the groups (Table 2). This test did not show statistical difference between results obtained with the manual method and that using AO (new protocol) (p = 0.183). However, between the manual method and FC/RC, and between FC/RC and FC/AO, there was difference between groups. The Spearman’s correlation coeficient was also calculated, being the highest coeficient observed between the manual method and the commercial kit, conirming the results found by the linear regression method. The results of the non-parametric test in this study, using the commercial kit, agree with those found by Villamor et al. (1996)(22), in which there was signiicant difference between
the methods assessed by the authors, among them, the Retic-Count and the manual. At the same time, the cited data were also analyzed using the t test, as recommended by NCCLS, with coinciding results.
The presented work did not permit inferences about the methods comparability in cases of reticulocytopenia, as the samples used in
TABLE 2 –Comparison of results obtained by different reticulocyte count methods
Manual method FC/AO FC/RC
Median 7.885 7.613 8.474
Low 0.35 0.4 0.58
High 28.25 27.97 30.41
IQ 10.8 10.452 11.053
p* - 0.183(1) 0(1)(2)
Spearman’s correlation coeficient (r)
- 0.949(1) 0.966(1)
0.956 (2)
RESUMO
Introdução: A contagem automatizada de reticulócitos apresenta vantagens em relação ao método manual, rotineiramente utilizado em laboratórios clínicos. Inovações tecnológicas permitem resultados estatisticamente mais confiáveis, além de otimizarem o tempo para realização desse exame. No entanto, o custo para aplicação do procedimento automatizado em rotinas laboratoriais ainda constitui uma barreira para sua implementação em laboratórios brasileiros de pequeno e médio porte. Objetivo: O presente estudo avaliou o desempenho de um protocolo laboratorial para contagem de reticulócitos por citometria de fluxo utilizando acridine orange (CF/AO), comparando-o com o método manual e o automatizado por citometria de fluxo utilizando o kit comercial BD Retic-Count (CF/RC). Conclusão: Os resultados mostraram que, além de ser comparável com o método manual, ainda considerado padrão, o protocolo avaliado é economicamente mais vantajoso do que os métodos automatizados atualmente disponíveis, sendo o seu custo comparável com o do método manual para laboratórios que já apresentam aparelhagem e infraestrutura adequadas.
Unitermos: métodos de contagem de reticulócitos; citometria de fluxo; acridine orange; BD Retic-Count. this study displayed reticulocyte counts that did not encompass
values lower than those considered reference, which, according to Dacie and Lewis (1984)(7), range from 0.2% to 2%. Therefore,
one may just afirm that the laboratory protocol, FC/AO, has acceptable comparability with other reticulocyte count protocols routinely used, as to prognosis and diagnosis of diseases involving reticulocytosis.
Although presenting advantages over the manual method, the automated method for reticulocyte counting is still not practicable by many clinical laboratories because the used reagent is imported, what raises its cost. As a result, the manual reticulocyte count is extensively used and accepted, once it presents better cost-effectiveness for most clinical laboratories(1).
A cost analysis between the different reticulocyte count methods was conducted taking into consideration just the price of reagents, of the kit and their import tariff, with just one determination: using the imported reagent, there would be an approximate cost of $ 4.45 (R$ 8.28), considering the present currency. This result is similar to that demonstrated by Simionatto (2009)(19), who used
another type of imported reagent in his study. Then, according to the author, the cost of one determination with the used reagent would be an average of R$ 9.50. Ali et al. (2010)(1) calculated
the cost per test of $ 0.11 for the manual method in contrast with $ 0.45 for the automated method Gen S, and $ 1.09 using the STKS analyzer. This data show considerable difference between the costs of automated and the manual methods.
The present work used a very small amount of the concentrated commercial stain (10 mg/ml) to prepare the solution used in the proposed FC reticulocyte count protocol, in which the AO concentration is 5 mg/l. Thus, there is a great yield of the acquired commercial reagent, what makes its use economically favorable, with an extremely reduced cost for one determination, in what regards just the stain, which would be around $ 0.00022 (R$ 0.00042). This cost is comparable with that of the manual method reagent. After comparison shopping, we veriied that using
around 50 µl of the ACB reagent for a determination of reticulocyte count, the cost of the spent reagent would be around R$ 0.015.
Therefore, the performance of the FC automated method using protocols like this, besides being economically more accessible to laboratories that possess the equipment, also presents good correlation and concordance with other standard methods available in the market. Consequently, the proposed protocol may represent an automated method with closer adherence by clinical laboratories, replacing the manual and automated methods currently used. In relation to the substitution of the manual method, widely used in most laboratories, there would be increased precision of results and time optimization of analysts work, avoiding several exhaustive counts per day, and allowing more time for them to dedicate themselves to other tasks. On the other hand, in relation to those laboratories that use the commercial kit, its replacement by the proposed protocol would reduce the test cost, as they would economize on acquired reagents, the main factor of high cost for the performance of the method.
CONCLUSION
The study allowed inferences about reticulocyte count using a laboratory protocol, which refers to an automated method by FC using AO:
• the laboratory protocol is easily and rapidly performed, and its cost is extremely reduced, what are favorable aspects to its employment in clinical laboratories;
• it is adequate for blood samples with reticulocytosis or with a normal number of reticulocytes;
REFERENCES
1. ALI, A. F. et al. Is manual reticulocyte count a reliable option for under resourced countries? J Pak Med Assoc, v. 60, n. 11, p. 892-6, 2010. 2. BAIN, B. J. Células sanguíneas: um guia prático. 3. ed. Porto Alegre: Artmed, 2004. 437 p.
3. BRIGGS, C. et al. Comparison of the automated reticulocyte counts and immature reticulocyte fraction measurements obtained with the ABX Pentra 120 Retic Blood Analyzer and the Sysmex XE-120 Automated Hematology Analyzer. Lab Hematol, v. 7, p. 75-80, 2001.
4. BUTTARELLO, M. et al. Flow cytometric reticulocyte counting. Parallel evaluation of ive fully automated analyzers: an NCCLS-ICSH approach. Am J Clin Pathol, v. 115, n. 1, p. 100-11, 2001.
5. CARTER, J. M. et al. Counting reticulocytes by low cytometry: use of thiazole orange. Clin Lab Haemat, v. 11, n. 13, p. 267-71, 1989. 6. D’ONOFRIO, G.; ZINI, G. Clinical applications of new reticulocytes parameters. Haematologica, v. 82, n. 1, p. 134-7, 2002.
7. DACIE, J.; LEWIS, S. Practical haematology. 6. ed. London: Churchill Livingstone, 1984. 453p.
8. DAVIS, B. H.; BIGELOW, N. C. Clinical low cytometric reticulocyte analysis. Pathobiology, v. 58, n. 2, p. 99-106, 1990.
9. FAILACE, R. Hemograma: manual de interpretação. 5. ed. Porto Alegre: Artmed, 2009. 424p.
10. LEWIS, S. M. et al. Hematologia prática de Dacie e Lewis. 9. ed.
Porto Alegre: Artmed, 2006. 571p.
11. NCCLS. Methods for reticulocyte counting (automated blood cell counters, low cytometry, and supravital dyes): approved guideline – second edition. NCCLS document H44-A2. v. 24, n. 8, 2004. 35p. 12. PENG, L. et al. Automated reticulocyte counting using the Sysmex RAM-1. Clin Lab Haem, v. 23, n. 2, p. 97-102, 2001.
13. PIVA, E. et al. Automated reticulocyte counting: state of the art and clinical applications in the evaluation of erythropoiesis. Clin Chem Lab Med, v. 48, n. 10, p. 1369-80, 2010.
14. RILEY, R. S. et al. Reticulocyte enumeration: past & present. Lab Med, v. 10, n. 32, p. 599-608, 2001.
15. RODAK, B. F. Hematology: clinical principles and applications. 2. ed. Indiana: W.B. Saunders Company, 2002. 835p.
16. ROWAN, R. M. Reference method, quality control and automation of reticulocyte count. Pure & Appl Chem, v. 63, n. 8, p. 1141-5, 1991. 17. RUDENSKY, B. Comparison of a semi-automated new Coulter methylene blue method with luorescence low cytometry in reticulocyte counting. Scand J Clin Lab Invest, v. 57, n. 4, p. 291-6, 1997.
18. SELIGMAN, P. A. et al. Automated analysis of reticulocytes using luorescent staining with both acridine orange and immunoluorescence technique. Am J Hematol, v. 14, n. 1, p. 57-66, 1983.
19. SIMIONATTO, M. Estudo comparativo de métodos de contagem de reticulócitos para controle de qualidade. 2009. 116f. Dissertação (mestrado) − Faculdade de Ciências Farmacêuticas, UFPR, Curitiba, 2009.
20. SIMIONATTO, M. et al. Analysis of manual reticulocyte counts in the clinical laboratories of Ponta-Grossa and Campos Gerais, PR, Brazil. Rev Bras Hematol Hemoter, v. 31, n. 5, p. 315-20, 2009.
21. VIANA, K. et al. Flow cytometry reticulocyte counting using acridine orange: validation of a new protocol. J Bras Patol Med Lab, v. 50, n. 3, p. 189-99, 2014.
22. VILLAMOR, N. et al. Interference of blood leucocytes in the measurements of immature red cells (reticulocytes) by two different (semi-) automated low-cytometry technologies. Clin Lab Haematol, v. 18, n. 2, p. 89-94, 1996.
23. WEARNE, A. et al. Automated enumeration of reticulocytes using acridine orange. Pathology, v. 17, n. 1, p. 75-7, 1985.
MAILING ADDRESS
Karina Augusta Viana