Homocysteine: validation and comparison of
two methods using samples from patients with
pulmonary hypertension
Homocisteína: validação e comparação entre dois métodos utilizando
amostras de pacientes com hipertensão pulmonar
Tatiana Maria Costa de Campos Barbosa1; Maria das Graças Carvalho2; Josianne Nicácio Silveira3; Júnia Garib Rios4; Flávia Komatsuzaki5; Lara Carvalho Godói6; Guilherme Hideki Yoshizane Costa7
First submission on 03/08/14; last submission on 13/11/14; accepted for publication on 13/11/14; published on 20/12/14
1. MSc in Pharmaceutical Sciences by Universidade Federal de Minas Gerais (UFMG); student at the Department of Clinical and Toxicological Analysis of the School of Pharmacy-UFMG.
2. Postdoctoral in Hemostasis by Maastricht University, The Netherlands; full professor at the Department of Clinical and Toxicological Analysis of the School of Pharmacy-UFMG. 3. PhD in Analytical Chemistry by UFMG; professor at the Department of Clinical and Toxicological Analysis of the School of Pharmacy-UFMG.
4. MSc in Clinical Medicine by Santa Casa de Belo Horizonte; pulmonolgist at the Medical Specialist Center of Santa Casa de Belo Horizonte.
5. MSc in Statistics by UFMG; responsible for the statistical analysis of the projects of the Department of Clinical and Toxicological Analysis of the School of Pharmacy-UFMG. 6. PhD in Pharmaceutical Sciences by UFMG; research and development coordinator of Labtest Diagnóstica S.A. group.
7. Pharmacist by Universidade Federal de Ouro Preto; junior researcher of Labtest Diagnóstica S.A. group.
ABStrACt
Introduction and objective: The determination of homocysteine plasma levels has been reported as a risk marker of interest in severe diseases involving endothelial injury and associated with the development or progression of atherosclerotic lesions and thrombus formation. The aims of this study were to validate method for quantiication of plasma homocysteine by high performance liquid chromatography (HPLC) with luorimetric detection, and to compare the results obtained from patients with pulmonary hypertension by HPLC with those obtained by spectrophotometric enzymatic cycling (S-Ec) method. Materials and methods: The validation parameters, such as linearity, matrix effect, precision, accuracy, detection and quantitation limits, and robustness of the method were evaluated aiming to demonstrate that it is suitable for the intended use. The data obtained in the quantiication of homocysteine using the validated method (HPLC) and the spectrophotometric enzymatic cycling (S-Ec) method, were compared. Results: The method was precise, accurate, and robust; it also had good recovery and showed no matrix effect. The linearity covered a range of 5.0-85.0 µmol/l and the limits of detection and quantiication were 1.0 µmol/l and 3.4 µmol/l, respectively. The results obtained for homocysteine determination by HPLC and S-Ec methods were comparable. Conclusion: The validated HPLC method showed good performance for quantiication of plasma homocysteine levels, while S-Ec method provided results for homocysteine comparable with those obtained by the validated method; therefore, this methodology is a potential alternative of automated method for clinical laboratories.
Key words: homocysteine; high performance liquid chromatography; spectrophotometric enzymatic cycling method.
introDuCtion
Homocysteine is a sulfur amino acid formed during the metabolism of methionine from diet or endogenous proteins
degradation(10, 18, 22). Published research hypothesized that increased
plasma homocysteine levels favors the occurrence of diseases, such as acute myocardial infarction, thrombosis, and atherosclerosis
disease(11, 12, 16, 17). Hyperhomocysteinemia can be inherited and/or
acquired. The main genetic disorders are due to mutations in the
methylenetetrahydrofolate reductase or cystathionine ß-synthase enzymes, while the acquired causes include of vitamins B6 and B12 or folate deiciencies, advanced age, chronic kidney disease, and
use of antifolate(24). It is believed that hyperhomocysteinemia may
cause changes on vascular endothelium, mainly mediated by the toxic effect of oxidized forms of this amino acid(2). The evaluation
of plasma homocysteine levels has been reported as a biomarker for endothelial dysfunction, linking its increase to severe diseases with endothelial injury, such as pulmonary hypertension (PH)(3),
which is characterized by pulmonary arterial hypertension, and may relect in dysfunction and right ventricular heart failure(4).
Some studies involving the evaluation of plasma homocysteine levels in patients with pulmonary hypertension, associated or not with other diseases, are described in the literature(3, 19, 25). However,
the knowledge from other parts of the world are not always relection of local conditions, since genetic and epidemiological variables can affect the manifestation of PH.
Homocysteine determination can be performed by many analytical techniques. Among them, high-performance liquid chromatography (HPLC) highlights, considered by many authors as a reference technique for the determination of this amino acid(7, 9, 14, 23). The sensitivity and speciicity attributed to HPLC
technique contribute to consider it the gold standard, however, due to the need for technical expertise on the operation of the equipment,
its use is limited in the laboratory routine(8, 25). Other techniques,
such as chemiluminescence, spectrophotometric enzymatic cycling (S-Ec), and immunoassay can also be used to determine plasma homocysteine levels, and represent an alternative for the clinical laboratory, with the beneits of being partially or fully automated(9, 15).
It is noteworthy to highlight the S-Ec, an automated technique which, through system ampliication by a enzyme-catalyzed reaction, allows to quantify homocysteine quickly and with quality.
To ensure that a new analytical method can produce reliable results on the sample, the laboratory should ensure by validation that the performance characteristics of the method meet the requirements for the intended analytical operations(1, 21). There
are technical, legal, and commercial reasons justifying the implementation of validation, the available validation manuals suggest guidelines to follow, open to interpretation. In Brazil, the National Health Surveillance Agency (Agência Nacional de Vigilância Sanitária [ANVISA]) and the National Institute of Metrology, Quality, and Technology (Instituto Nacional de Metrologia, Qualidade e Tecnologia [INMETRO]) provide the guidelines on how to conduct validation by the Resolution RDC 27 from 17 May, 2012 and the DOC-CGCRE-008 from July, 2011(5, 13).
Some parameters for method validation are evaluated, including linearity, range or linear range, selectivity (matrix effect), accuracy, precision, detection limit, quantiication limit, and robustness(13).
The investigation of the matrix effect on the quantiication of compounds is an important parameter to be evaluated in the development and validation of bioanalytical methods, if this is not ensured, linearity, trend, and accuracy will be seriously damage(6, 13).
The objectives of this study were to validate the plasma HPLC method for quantiication of homocysteine, including parameters such as linearity, matrix effect, detection limit, quantiication limit,
precision, accuracy and robustness of the method, and then, to compare the homocysteine results obtained by HPLC from sample of patients with PH with those obtained by S-Ec method (Labtest kit).
MAtEriALS AnD MEthoDS
Standards, chemicals, and controls
The standards and chemicals used in validated HPLC method were acquired from Sigma Aldrich™ (St Louis, USA), and include
DL-Homocysteine 95% pure; cystamine dihydrochloride (internal standard); tris (2-carboxyethyl) phosphine hydrochloride ([TCEP], reducing agent); 7-luorobenzo-2,1,3-oxadiazole-4-sulfonic acid ([SBDF], derivatizing agent) 98% pure, and phosphate buffered saline system (PBS), pH 7.4. Regarding the controls, we used Liquichek™ Homocysteine Control, level 1 (7.3-12.1 µmol/l) and
level 2 (22.6-33.8 µmol/l), lot 34900, Biorad™, (Irvine, USA), as
internal control, in addition to Interlaboratory Program CR-A 2011 (Cardiac Risk), number 7206871-01, identiication Kit 23958451, College of American Pathology (CAP) (Northield, USA).
Reagents
The reagents used were from Merck™ (Darmstadt, Germany), J.T. Baker™ (Mexico), and Vetec™ (Duque de Caxias, Brazil),
including glacial acetic acid (HPLC grade); trichloroacetic acid ([TCA], analytical grade); boric acid (analytical grade); ethylenediaminetetraacetic acid ([EDTA], analytical grade); sodium acetate trihydrate (analytical grade); sodium hydroxide ([NaOH], analytical grade), and methanol (HPLC grade). We used deionized water from Millipore™ puriication system (Millipore, Bedford, MA,
USA), with resistivity of 18.2 megaohms.cm. The reagents used in the comparative study were: Calibra Homocysteine, Qualitrol Homocysteine, and the Homocysteine Kit provided by Labtest Diagnóstica S.A.
Determination of plasma homocisteine by HPLC
We used the HP - model 1100 - HPLC system by Agilent Technologies (Santa Clara, USA), equipped with isocratic pump, thermostat, automatic injector, luorometric detector, model 1200; the system was controlled by ChemStation software.
The solutions were prepared as follows:
b) homocysteine aqueous intermediate standard solutions (concentrations: 50.0; 100.0; 150.0; 200.0; 250.0; 300.0; 350.0; 400.0; 450.0; 500.0; 650.0; 750.0; 800.0; 850.0; 1050.0, and 1250.0 µmol/l) were prepared from the homocysteine storage standard solution. The homocysteine standard solutions were prepared in water and matrix (concentrations: 5.0; 10.0; 15.0; 20.0; 25.0; 30.0; 35.0; 40.0; 45.0; 50.0; 65.0; 75.0; 80.0; 85.0; 105.0, and 125.0 µmol/l), from the respective intermediary standard solutions. Cysteine aqueous intermediary standard solution 20,0 µmol/l was prepared from cysteine storage standard solution and cysteine standard solutions 10,0 µmol/l aqueous, from the cysteine
intermediate standard solution;
c) other solutions used in the methodology include sodium hydroxide 0.39 mol/l and 5.0 mol/l solutions; borate EDTA buffer solution , pH 9.5 (3.86 g of boric acid; 0.74 g of EDTA for 500.0 ml of solution); TCEP 25.0 g/l solution; SBDF 1,0 g/l solution; PBS solution prepared according to manufacturer’s orientation; and TCA-EDTA solution (5.0 g of TCA, 0.0186 g of EDTA for 50.0 ml
solution);
d) plasma pool: homogenized, aliquoted, and stored at -20ºC
until the moment of use.
Preparation of mobile phase and cromatographic
conditions
The mobile phase consisted of acetate buffer (6.80 g of sodium acetate and 2.9 ml of acetic acid for 1.0 l of solution), pH 5.5 adjusted with NaOH 5.0 mol/l, low 1.1 ml/min; Techsphere chromatographic column C18 (15 cm × 4.6 mm; 5 μm) by Sun SRI™ (Welwyn Garden, USA); injection volume of 50 µl;
luorimetric detector: λex= 385 nm and λem= 515 nm. The total chromatographic run time was 9 minutes.
Method of analysis
The proposed method was described by Pfeiffer et al.
(1999)(20) with some modiications, and initially consisted of
reduction thiol groups by TCEP in the protein precipitation and then, derivatization of homocysteine by SBDF.
We added to eppendorf 50 µl of plasma or homocysteine standard solution, 40 µl of standard solution of IS, 25 µl of PBS, and 40 µl of TCEP. The wating time for thiol groups’ reduction reaction was 30 minutes. After 30 minutes, 90 µl of precipitanting agent TCA-EDTA was added, the solution was shaken for 30 sec and centrifuged at 13.000 g for 10 min at 24ºC. The supernatant was removed and 50 µl transferred to an amber tube, to which was
added 40 µl of NaOH 0.39 mol/l, 125 µl of borate EDTA buffer and 50 µl of SBDF. The solution was homogenized and incubated for 60 min in water bath at 60ºC. An aliquot of 50 µl of this solution was injected into the chromatograph.
Stability of derivatized sample
The concentrations 5.0; 25.0; 65.0, and 105.0 µmol/l were prepared in independent sextuplicates. The samples were submitted to the analysis method previously described, with injection in the preparation day (Group 1) and reinjection after 24 hours (Group 2).
Data were processed comparing the relative areas obtained in Groups 1 and 2. Mann Whitney test was performed by the Statistical Package for the Social Sciences Software 12.0 (SPSS 12.0).
Method validation
The validation parameters described below were evaluated, and statistical tools were applied with the aid of SPSS 12.0 and Minitab 16.0 softwares.
Linearity
The concentrations 5.0; 25.0; 45.0; 65.0; 85.0; 105.0 e 125.0 µmol/l were prepared in independent quintuplicates, in water and matrix, and processed as described at Method of analysis topic. The
outliers’ veriication was performed by Boxplot; tnhe normality was veriied by the Shapiro Wilk test; and linear regression was veriied by analysis of variance (ANOVA).
Matrix effect
For the study of matrix effect, we used the same curves proposed for linearity. The range considered linear and the one used for matrix effext analysis was 5.0 to 85.0 µmol/l of homocisteine. The analytical curves were built, the residues were calculated, and the variances of the curves in matrix and aqueous curves were evaluated by Levene’s test and t-test aiming to verify the matrix interference.
Precision
precision), and on three consecutive days (inter-assay precision). The intra-assay and inter-assay precision were expressed by the coeficient of variation.
Another way to evaluate the partial inter-assay precision was varying analysts (two) in two days using the samples of studied patients. In this regard, ten samples were prepared in duplicate on each day of analysis. Standard solutions of use, calibration curves, and controls were prepared for each analyst, separately. For statistical analysis of inter-assay precision, initially we performed the calculation of differences on concentration of each duplicate of analyzed sample, and for each analyst separately. Using the differences we could verify the normality of results by Anderson-Darling test, and then, t-test to verify the equality of differences
between analysts.
Accurac
The concentrations 10.0; 15.0; 30.0; 40.0, and 75.0 µmol/l were prepared in independent quintuplicates and processed as described in topic Method of Analysis. The accuracy of the method was veriied by the means of apparent recoveries obtained by adding samples at each concentration level. The recovery rates were calculated according to DOC-CGCRE-008(13).
Accuracy was also veriied by the assertiveness in the Interlaboratorial Program of College of American Pathology (CAP), CR-A 2011 (Cardiac Risk), which contains three levels of different concentrations. Samples were processed in duplicate on
the same day.
Accuracy was also evaluated on each day of experiment by Bio-Rad internal controls (two concentration levels). The results were evaluated taking into account the range of concentration informed for each level in the reported issued by manufacturer.
Limit of detection and quantification
To evaluate the method limits of detection (LD) and quantiication (LQ), 10 independent replicates were prepared from white plasma pool. The solutions were processed as
described in the topic Method of Analysis. The limits of detection and quantiication were calculated according to DOC-CGCRE-008(13).
Robustness
Small variations in method were proposed in order to evaluate the robustness. This study assessed seven analytical parameters:
addition of methanol in the mobile phase, concentrations of SBDF, TCEP, and TCA-EDTA, number of revolutions, centrifugation time, and water bath temperature. Nominal values and variations are shown in Table 1.
tABLE 1 – Analytical parameters in the nominal condition and
in the variations proposed in the robustness test
Parameters Nominal Variation
A Methanol in mobile phase 0% 1%
B SBDF 1 g/l 0.9 g/l
C Rotation 13.000 g 14.000 g
D Water bath temperature 60ºC 65ºC
E TCA-EDTA 100 g/l + 1 mmol/l 110 g/l + 1.1 mmol/l
F TCEP 25 g/l 20 g/l
G Rotation time 10 minutes 7 minutes
SBDF: 7-fluorobenzo-2,1,3-oxadiazole-4-sulfonic acid; TCA-EDTA: trichloroacetic acid- ethylenediaminetetraacetic acid; TCEP: tris (2-carboxyethyl) phosphine hydrochloride.
The experiment was conducted in accordance with Youden’s
test(13), in which the seven seleted analytical parameters
(A, B, C, D, E, F, and G) were placed in eight tests arranged by the combinatorial analysis and randomly evaluated. From these eight tests, four were performed with each parameter at its nominal value and four with the variations. We compared the mean of the four values corresponding to nominal parameters with the average of the four values corresponding to variations, in order to determine the inluence of variation of each parameter in the inal result.
Data were statistically evaluated and organized in Group 1 − the four values of each parameter at its nominal value, and Group 0 − the four values of each parameter at its variation. The normality was veriied using the Shapiro WilK test. Then, F-test
and t-test were performed.
Sampling and blood colection
Patients were aged between 19-80 years, of both sexes, and diagnosed with PH by the responsible pulmonolgist at speciic outpatient Medical Specialties Center of Pulmonology, Santa Casa de Belo Horizonte. We collected 5 ml of blood in EDTA of each patient fasting for 12 hours. Then we proceeded to samples centrifugation to obtain plasma, which was aliquoted and storaged at -80ºC, until the analysis.
Comparative analysis of the results obtained by
HPLC and S-Ec methods
A comparative study between the validated HPLC methodology and by S-Ec was conductd, using Labtest Diagnóstica SA kit. The analyzes of this kit were processed at Research Laboratory of Labtest Diagnóstica using the biochemical analyzer able to read on 300 nm to 800 nm wavelengths, Labmax 560, Nishinomiya-shi, Japan.
We analyzed 68 samples of the patients above mentioned, on different days, by different operators, different techniques, and in duplicate. The statistical analyzes used for the comparison between the two methods were Anderson-Darling test, Mann-Whitney test, and Bland Altman plot performed by Minitab 16.0 and Medcalc programs.
rESuLtS AnD DiSCuSSion
In this study, the stability of derivatized sample was evaluated by comparing the medians of Group 1 (relative area 0.69 ± 1.69) and Group 2 (relative area 0.65 ± 1.73) using Mann-Whitney
test. The p value = 0.377 showed no difference between the data obtained in Groups 1 and 2 (signiicance level of the test is α =
0.05), which means that the derivatized sample is stable for up to 24 hours. The stability of the derivatized sample for 24 hours enabled the examination of a greater number of samples per experiment, and reinjection was performed when necessary.
Method validation
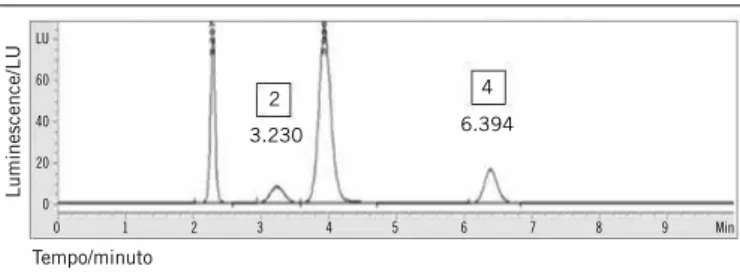
The chromatographic proile obtained after the analytical parameters were optimized for the quantiication of plasma homocysteine by HPLC is shown in Figure 1. We observed that the optimum conditions were suitable to obtain a good separation of homocysteine and IS (cystamine), even in the presence of two interfering. The total runing time was 10 minutes, low 1.1 ml/min. The linearity was studied in seven levels, prepared in independent quintuplicates in the matrix (plasma pool) and
in deionized water in equally spaced range of 5 to 125 µmol/l. Points ranging from 105 µmol/l to 125 µmol/l were not normally distributed in aqueous curves and in matrix, therefore they were excluded from the analysis. The interval 5 to 85 was submitted
to outliers analysis, and one outlier was removed from curve in matrix (corresponding to the concentration 45 µmol/l), and another one in aqueous curve (corresponding to the concentration 85 µmol/l), obtaining the equation of a line and the coeficient of determination (y = 0.03048x + 0.008827; r2 = 0.99904) for
the aqueous curve, and (y = 0.03002 + 0.02387; r2 = 0.99835)
for the curve in matrix. Then, the Shapiro Wilk test showed that residues followed a normal distribution (p = 0.460 for the curve
in matrix, and p = 0.107 for the aqueous curve; test signiicance
is α = 0.05). The signiicant regression (p < 0.001) and the
intercept (β0) different from zero indicated that the range from 5 to 85 µmol/l of homocysteine was linear.
The matrix effect was evaluated on the linear range, indicating that the method did not present it (p < 0.001 for Levene test and
t-test).
The choice of concentrations for accuracy and precision of the method covered normal values of homocysteine and hiperhomocysteinemia, and ive different concentrations over the linear range of the method were proposed.
The intra and inter-assay precision (partial reproducibility) of method were expressed by the coeicient of variation values shown
in Table 2.
figurE 1 − Homocysteine chromatogram determined from analysis of plasma homocysteine of studied patients
(2) homocysteine analytical study; (4) cystenine analytical study.
0 1 2 3 4 5 6 7 8 9 Min
Luminescence/LU
Tempo/minuto
2
3.230 6.394
4
LU
60
40
20
0
tABLE 2 − Evaluation of the precision of homocysteine by HPLC method
Homocysteine concentration (µmol/l)
Coeficient of variation Intra (%) Inter (%)
10.0 4.3 7.1
15.0 4.6 8.0
30.0 5.5 7.9
40.0 4.0 5.8
75.0 2.9 6.2
Relative standard deviation intra-assay (n = 5) and inter-assay (n = 3 days; n = 5 replicates).
HPLC: high-performance liquid chromatography.
In inter-assy precision, evaluated by two different analysts, the normality of data was conirmed by Anderson-Darling
test (p > 0.05). There was equality in means of the differences obtained from the same analyst, and between analysts 1 and 2 by
t-test (p > 0.05).
by CAP interlaboratorial program and the results obtained by Bio-Rad internal control were satisfactory and contributed to strengthen conidence in the validated method.
The detection and quantiication limits of HPLC method were foram 1.0 µmol/land 3.4 µmol/l, respectively.
Regarding robustness, the proposed variations had strategic objectives, in which the addition of methanol to the mobile phase was carried out to reduce the running time of analysis without overlaping the analytical signals. The decreases in SBDF and TCEP concentrations were proposed to reduce the cost of analysis, because among the reagents used these are the most expensive. The increase in precipitant agent (TCA-EDTA) concentration was performed in order to obtain a cleaner supernatant. The increase of rotation and decrease of rotation time were proposed aiming to decrease sample preparation time. Eventually, bath temperature was tested in order to evaluate a potential change in homocysteine derivatization procedure.
Youden test was used and the statistical conirmation by F-test and t-test showed that the inluence of variations was not
signiicant (p > 0.05 for each parameter evaluated). The validated method was considered robust due to the small variation proposed.
Comparative analysis
The comparative analysis of the results from plasma homocysteine levels was performed using both techniques: Mann-Whitney test and by Bland & Altman plot (Figure 2).
The Mann-Whitney test showed that data are comparable, and no difference was found between results (p > 0.05). The Bland
& Altman plot showed that mean (µ = -0.817) is close to zero, suggesting that the techniques are consistent with each other. The
dispersion of differences between data is not biased, and much of it is distributed around the mean. Therefore, S-Ec may be an option in the homocysteine analysis in clinical laboratories, since it demands
less laboratorial expertise.
Some studies evaluating the techniques for the determination of homocysteine are described in the literature. For example, Gascón
et al. (2010)(9) evaluated the automated chemiluminescence
technique, and La’ulu et al. (2008)(15) evaluated six automated
methods. In both studies, the results were comparable with those obtained by HPLC, and presented good correlation between them.
figurE 2 − Bland-Altman plot to evaluate the results determined by HPLC and S-Ec X-axis represents the concentration means obtained in the replicates of both techniques, and Y-axis represents the concentration difference obtained between HPLC and S-Ec results. HPLC: high-performance liquid chromatography; S-Ec: spectrophotometric enzymatic cycling; SD: standard deviation represented by the dashed line; Mean: mean represented by the solid line.
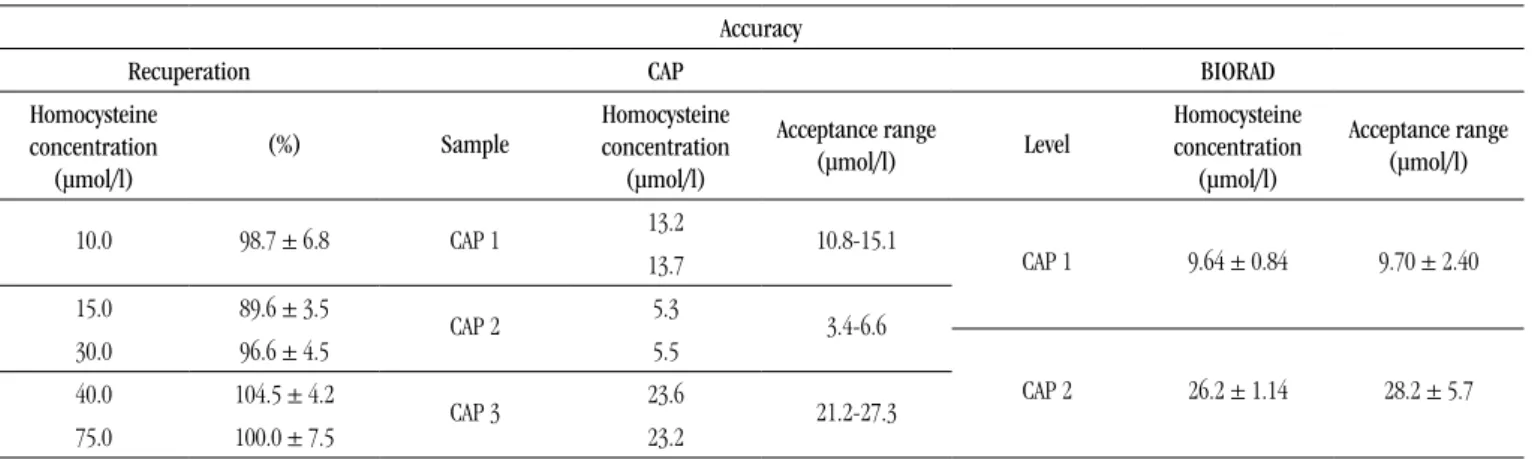
tABLE 3 − Evaluation of the accuracy of homocysteine by HPLC method, evaluated through method recovery,
by CAP interlaboratory programme analysis and Biorad internal control Accuracy
Recuperation CAP BIORAD
Homocysteine
concentration
(µmol/l)
(%) Sample
Homocysteine
concentration
(µmol/l)
Acceptance range
(µmol/l) Level
Homocysteine
concentration
(µmol/l)
Acceptance range
(µmol/l)
10.0 98.7 ± 6.8 CAP 1 13.2 10.8-15.1
CAP 1 9.64 ± 0.84 9.70 ± 2.40 13.7
15.0 89.6 ± 3.5
CAP 2 5.3 3.4-6.6
30.0 96.6 ± 4.5 5.5
CAP 2 26.2 ± 1.14 28.2 ± 5.7 40.0 104.5 ± 4.2
CAP 3 23.6 21.2-27.3
75.0 100.0 ± 7.5 23.2
CAP 1, 2, and 3: three concentration levels sent by the provider; BIORAD: level 1 (normal) and level 2 (pathological). HPLC: high-performance liquid chromatography; CAP: College of American Pathology.
x 8
6
4
2
0
-2
-4
-6
-8
-10
HPLC-S-Ec
5 10 15 20 25 30 35 40
HPLC and S-Ec mean
rESuMo
Introdução e objetivo: A determinação dos níveis plasmáticos de homocisteína tem sido relatada como um marcador de risco de interesse em doenças graves que cursam com lesões endoteliais, estando associada ao desenvolvimento ou à progressão de lesões ateroscleróticas e formação de trombos. Os objetivos do presente estudo compreenderam validar o método de dosagem de homocisteína plasmática por cromatografia líquida de alta eficiência (CLAE) com detecção fluorimétrica, analisar amostras de pacientes com hipertensão pulmonar e comparar os resultados obtidos por CLAE com aqueles obtidos com a metodologia espectrofotométrica enzimática cíclica (E-Ec). Materiais e métodos: Os parâmetros de validação linearidade, efeito de matriz, precisão, exatidão, limites de detecção e quantificação, além de robustez do método foram avaliados visando demonstrar que este está apropriado para o uso pretendido. Os dados obtidos na quantificação de homocisteína pelo método validado (CLAE) e pela metodologia espectrofotométrica enzimática cíclica (kit da Labtest) foram comparados. Resultados: O método mostrou-se preciso, exato, robusto, com boa recuperação e não apresentou efeito de matriz. A linearidade abrangeu a faixa de 5 a 85 µmol/l, e os limites de detecção e quantificação foram 1 µmol/l e 3,4 µmol/l, respectivamente. Quanto à comparação dos resultados da determinação de homocisteína por CLAE e por
E-Ec, eles foram comparáveis. Conclusão: O método validado por CLAE apresentou desempenho adequado para mensuração dos
níveis plasmáticos de homocisteína, enquanto o uso da metodologia E-Ec forneceu resultados para homocisteína comparáveis com aqueles obtidos pelo método validado, sendo esta metodologia uma opção de método automatizado para laboratórios clínicos.
Unitermos: homocisteína; cromatografia líquida de alta eficiência; metodologia espectrofotométrica enzimática cíclica.
We can assume that S-Ec use represents an option to the laboratory due to its easy performing, quick analysis, and reliability of result.
To choose the method to be adopted in a laboratory, it is important to know and analyze the advantages and disadvantages of each method. Although HPLC is considered the gold standard for the determination of homocysteine, we highlight that the sample preparation in totally manual and involves several steps. The enzymatic cycling method, in turn, requires a photometer able to read at 340 nm and requires no sample preparation. The reaction consists in the reduction of homocysteine followed by enzyme-catalyzed steps that promote the oxidation of nicotinamide adenine dinucleotide reduced form (NADH) in nicotinamide adenine dinucleotide (NAD) and consequent reduction of optical activity at 340 nm. The cyclic reaction allows the response ampliication in the system. The time spent on sample preparation for validated HPLC method for quantiication of homocysteine is about 2 hours, while in S-Ec methodology the total release time is 10 minutes. This factor is critical to the laboratory since the streamlined execution contributes to decrease the release time of the result to the patient, and also enable to process a greater number of samples per day. The validated HPLC method presents a greater work range and analytical sensitivity (linearity up to 85.0 µmol/l and limit of detection 1.0 µmol/l) when compared to S-Ec (linearity 50.0 µmol/l and limit of detection 1.74 µmol/l). The kit manufacturer mentions the possibility of making dilutions of the samples that giving values above 50 µmol/l, as an alternative to release higher homocysteine results.
To date, there are no commercial kits for homocysteine by HPLC, therefore the method validation, as well as the preparation of all reagents are required in any laboratoriy that choose this
method. This factor may contribute to increasing the varyiation of results. Chromatography is a separation technique of similar substances, is sensitive and requires the sample to be introduced into chromatograph as “cleanest” as possible (extraction of the compounds of interest), in order to preserve its components.
It is dificult to evaluate HPLC regarding the cost/beneit ratio, since this will depend on each laboratory facilities, as well as the team qualiications of it, required demand, purchasing power, etc. Chromatography equipment is costly, restricted to speciic analyzes, not very easy handling, and requires trained staff. On the other hand, S-Ec methodology uses an automated analyzer that can also
be used in many other analyses of other analytes in the laboratory;
it is easy handling, which encourages more assimilation of the operating staff. The laboratory opportunity to obtain the equipment by lending, make the implementation and acquisition of this
method easier.
It is expected that the considerations throughout this study can contribute to bring advances in issues concerning the determination of this amino acid in clinical laboratories.
ConCLuSion
The study allows us to validate HPLC method for quantiication of plasma homocysteine, showing satisfactory robustness, and suitables precision, accuracy, and sensitivity.
MAiLing ADDrESS
Tatiana Maria Costa de Campos Barbosa
Avenida Presidente Antonio Carlos; Campus Pampulha; CEP: 31270-901; Belo Horizonte-MG, Brazil; e-mail: [email protected].
rEfErEnCES
1. ABNT. Associação Brasileira de Normas Técnicas. NBR ISO/IEC 17025. Requisitos gerais para a competência de laboratórios de ensaio e calibração. Rio de Janeiro: ISO, 2005. 31p.
2. AMORIM, F. G. et al. Bioquímica clínica da aterosclerose provocada por hiper-homocisteinemia. Revista Eletrônica de Farmácia, v. 8, n. 1,
p. 36-59, 2011.
3. ARROLIGA, A. C. et al. Association between hyperhomocysteinemia and primary pulmonary hypertension. Respiratory Medicine, v. 97, p. 825-34, 2003.
4. BICHARA, V. M.; VENTURA, H. O.; PERRONE, S. V. Hipertensión pulmonar: la mirada del especialista. Insuficiencia Cardiaca, v. 6, n. 2,
p. 65-79, 2011.
5. BRASIL. Ministério da Saúde. Agência Nacional de Vigilância Sanitária. Resolução RE. RDC 27, de 17 de maio de 2012. Requisitos mínimos para a validação de métodos bioanalíticos empregados em estudos com ins de registro e pós-registro de medicamentos. Diário Oicial da União, Brasília, 22 maio, 2003.
6. CASSIANO, N. et al. Validação em métodos cromatográicos para análises de pequenas moléculas em matrizes biológicas. Química Nova, v. 32, n. 4, p. 1021-30, 2009.
7. CHICHIZOLA, C. et al. El valor diagnóstico de La homocisteina. Revista Argent Endocrinol Metab, v. 40, n. 1, p. 32-42, 2003.
8. DUBSKÁ, L.; HYÁNEK, J. Stanovení homocysteinu v biologickém materiálu. Klin Biochem Metab, v. 17, n. 38, p. 93-5, 2009.
9. GASCÓN, M. T. et al. Avaliação do método de quimioluminescência na análise de homocisteína plasmática e sua comparação com o método de HPLC em amostras de crianças. Einstein, v. 8, p. 187-91, 2010.
10. GRAVINA-TADDEI, C. F. et al. Hiper-homocisteinemia como fator de risco para doença Aterosclerótica Coronariana em Idosos. Arq Bras Cardiol, v. 85, n. 3, p. 166-73, 2005.
11. GUIMARÃES, A. C. Hiper-homocisteinemia como fator de risco para doença aterosclerótica coronariana em idosos. Arq Bras Cardiol, v. 85, n. 2, p. 83-4, 2006.
12. HARBOE-GONÇALVES, L.; VAZ, L. S.; BUZZI, M. Associação entre níveis plasmáticos de homocisteína e acidente vascular cerebral isquêmico.
Arquivo Neuropsiquiátrico, v. 61, n. 1, p. 97-103, 2005.
13. INMETRO. Instituto Nacional de Metrologia, Normalização e Qualidade Industrial. DOQ-CGCRE-008. Orientação sobre validação de métodos analíticos. Rio de Janeiro: INMETRO, 2011. 20p.
14. KAPRAL, A. et al. Homocysteinemia and ovariectomy-initial experience with funcitional monitoring. Ceska Gynekol, v. 67, n. 6, p. 328-32, 2002. 15. LA’ULU, S. L. et al. Performance characteristics of six homcysteine assays. Am J Clin Pathol, v. 130, p. 969-75, 2008.
16. MALINOW, M. R. Plasma homocyst(e)ine and arterial occlusive diseases: a mini-review. Clin Chem, v. 40, n. 1, p. 173-6, 1995.
17. MCCULLY, K. S. Vascular pathology of homocysteinemia: implications for the pathogenesis of arteriosclerosis. Am J Pathol, v. 56, n. 1, p. 111-28,
1969.
18. NETO, A. C. et al. Nível plasmático de homocisteína: marcador de gravidade em pacientes sépticos? Rev Bras Ter Intensiva, v. 22, p. 327-32,
2010.
19. OZEROL, I. H. et al. Plasma endothelin-1, homocysteine and serum
nitric oxide values in Patients with left-to-right shunt. Indian Heart J, v. 56, p. 653-7, 2004.
20. PFEIFFER, C. M.; HUFF, L. D.; GUNTER, W. Rapid and accurate HPLC assay for plasma total homocysteine and cysteine in a clinical laboratory setting. Clinical Chemistry, v. 45, p. 290-2, 1999.
21. RIBANI, M. et al. Validação em métodos cromatográicos e
eletroforéticos. Química Nova, v. 27, n. 5, p. 771-80, 2004.
22. SACHDEV, P. Homocisteína e transtornos psiquiátricos. Rev Bras Psiquiatr, v. 26, n. 1, p. 50-6, 2004.
23. STAUFFENBERG, M. T. et al. Hyperhomocysteinemia measured by immunoassay a valid measure of coronary artery atherosclerosis. Arch Pathol Lab Med, v. 28, p. 1263-8, 2004.
24. ZAGO, A. M.; FALCÃO, P. R.; PASQUINI, R. Hematologia fundamentos e prática. São Paulo: Atheneu, 2004.