An
in vitro
comparison of nickel and
chromium release from brackets
Abstract: This study aimed at comparing amounts of nickel (Ni) and chromium (Cr) released from brackets from different manufacturers in simulated oral environments. 280 brackets were equally divided into 7 groups according to manufacturer. 6 groups of brackets were stainless steel, and 1 group of brackets was made of a cobalt-chromium alloy with low Ni content (0.5%). International standard ISO 10271/2001 was ap-plied to provide test methods. Each bracket was immersed in 0.5 ml of synthetic saliva (SS) or artiicial plaque luid (PF) over a period of 28
days at 37°C. Solutions were replaced every 7 days, and were analyzed
by spectrometry. The Kruskal-Wallis test was applied. Amounts of Ni
re-lease in SS (µg L−1 per week) varied between groups from “bellow
detec-tion limits” to 694, and from 49 to 5,948.5 in PF. The group of brackets made of cobalt-chromium alloy, with the least nickel content, did not release the least amounts of Ni. Amounts of Cr detected in SS and in PF
(µg L−1 per week) were from 1 to 10.4 and from 50.5 to 8,225,
respec-tively. It was therefore concluded that brackets from different manufac-turers present different corrosion behavior. Further studies are necessary to determine clinical implications of the indings.
Descriptors: Orthodontic brackets; Nickel; Chromium; Saliva, artiicial.
Ana Cristina Soares Santos Haddad(a)
Andre Tortamano(b)
Alexandre Luís de Souza(c)
Pedro Vitoriano de Oliveira(d)
(a) PhD Student; (b)Assistant Professor
– Department of Orthodontics, School of Dentistry, University of São Paulo, São Paulo, SP, Brazil.
(c) PhD Student; (d)Associate Professor
– Lab of Emission and Atomic Absorption Spectrometry, Institute of Chemistry, University of São Paulo, São Paulo, SP, Brazil.
Corresponding author:
Ana C. S. S. Haddad
Departamento de Ortodontia, Faculdade de Odontologia, Universidade de São Paulo Av. Prof. Lineu Prestes, 2227
São Paulo - SP - Brazil CEP: 05508-000
E-mail: [email protected]
Introduction
The corrosion process of metallic brackets has been linked to the deterioration of their mechanical
properties and to adverse biological effects.1-8 Since
none of these aspects are desirable in orthodontic practice, comparing amounts of metal release from commercially available brackets is necessary to de-termine their resistance to corrosion in the oral en-vironment.
The American Iron and Steel Institute (AISI) types 316L or 304 austenitic stainless steel alloys
are currently used for bracket manufacturing.9,10
These steel alloys typically contain approximate-ly 8% nickel (Ni) and 18% chromium (Cr) with a small amount of manganese and silicon, and a low
carbon content (less than 0.1%).9,10 AISI type 316L
also contains 2 to 3% molybdenum.9,10 Besides that,
bracket manufacturing includes different processes with or without welding. Therefore, some brackets may be a layered complex of alloys differing in com-position and mechanical state as various parts may
be welded or brazed together.10
As a group, the cobalt-base alloys may be gener-ally divided in three categories described as wear-resistant, corrosion-resistant and heat-resistant
ma-terials.11 Cobalt-base wear-resistant alloys contain
the least Ni content (3% max), 25 to 30% Cr, 0.25 to 3.3% carbon, and also manganese, silicon,
mo-lybdenum, tungsten, iron and sodium.11 This alloy is
used in bracket manufacturing. However, although the cobalt-base wear-resistant alloys (with low Ni content) exhibit some resistance to aqueous
corro-sion, it is limited.11 To satisfy the industrial need
for alloys that exhibit higher resistance to aqueous corrosion, it was necessary to increase Ni content (9 to 35%), and decrease carbon content (0.8% max)
in the cobalt-base corrosion-resistant alloys.11 The
third category of cobalt-base alloys, the
high-tem-perature alloys, is used in industry.11
This study aimed at comparing amounts of Ni and Cr released from various bracket models from different manufacturers in simulated oral environ-ments over a period of 28 days.
Material and Methods
The sample comprised 280 orthodontic brackets
of upper premolars from the MBT™ prescription.12
The brackets were equally divided into 7 groups from different models and manufacturers as
fol-lows: Kirium Line™ Abzil™ (São José do Rio Preto,
SP, Brazil – code: 288-133), Mini Master Series™
American Orthodontics™ (Sheboygan, WI, USA
– code: 390-0027), Discovery™ Dentaurum™
(Isprin-gen, Baden-Württemberg, Germany – code:
790-118-00), Full Size™ Unitek™ (Monrovia, CA, USA
– code: 119-936), Morelli M.B.T.™ Morelli™
(Soro-caba, SP, Brazil – code: 10-35-007), NuEdge™ TP
Orthodontics™ (LaPorte, IN, USA – code: 293-205),
and Victory™ Unitek™ (Monrovia, CA, USA – code:
017-890). The different brackets studied were la-beled A to G respectively according to the model/ manufacturer. The brackets were made of stainless steel (approximately 8% Ni and 18% Cr), except for the F brackets which were of cobalt-chromium
al-loy with low Ni content (0.5% Ni).9,11 The brackets
were tested in an “as-received” state, and complied with the requirement of “no visible signs of change or deterioration”. The base of the brackets was not covered with resin, thus eliminating the possibility of extraneous sources of Ni and Cr.
Brackets from each manufacturer were divided into four groups of 10 specimens. An initial corro-sion test was carried out on 10 brackets from each manufacturer immersed in synthetic saliva, and 10 brackets from each manufacturer immersed in ar-tiicial plaque luid. An identical corrosion test was performed on the other 20 brackets immersed in the same solutions 30 days later.
International standard ISO 10271/2001, “Den-tal me“Den-tallic materials – corrosion test methods”, was
applied to provide test methods.13
Ni and Cr release from brackets, comprising the sample, was quantiied by means of a static immer-sion test. The studied brackets had no contact with metallic materials during the test and each bracket was placed in a separate polypropylene tube
(Axi-gen, Union City, CA, USA) containing 0.5 ml of
synthetic saliva or artiicial plaque luid. The simu-lated saliva medium was synthesized on the basis of
the formula of Leung and Darvell.14 The inal pH
was 6.7 ± 1. Artiicial plaque luid was prepared by
dissolving 10.0 ± 0.1 g 90% (m m−1) C
5.85 ± 0.005 g NaCl in approximately 300 ml of
wa-ter, and then by adjusting volume to 1,000 ± 10 ml
with distilled water. The inal pH was 2.3 ± 1. The
container was closed to prevent evaporation of the
solution, and the sample tubes were stored at 37°
C for 28 days. Every 7 days ± 1 h brackets were
re-moved from each tube, and placed in other tubes with fresh immersion solution. Furthermore, 3 tubes containing the solution prepared at each ex-perimental period, but with no brackets, were used as controls, and were stored exactly as the sample tubes were.
The solutions inside each tube at each experi-mental period were analyzed by spectrometry to determine Ni and Cr content. All synthetic saliva samples and artiicial plaque luid samples from controls and from C and G brackets were analyzed by simultaneous graphite furnace atomic absorp-tion spectrometry (SIMAAS), model SIMAA 6000
(Perkin Elmer Life and Analytical Sciences™,
Shel-ton, CT, USA), equipped with longitudinal Zee-man-effect background correction, Echelle optical arrangement, and solid-state detector. All solutions were fed into the graphite tube by means of an AS-72 autosampler (Perkin Elmer Life and Analytical
Sciences™). Argon 99.996% (v v−1) (White Martins™,
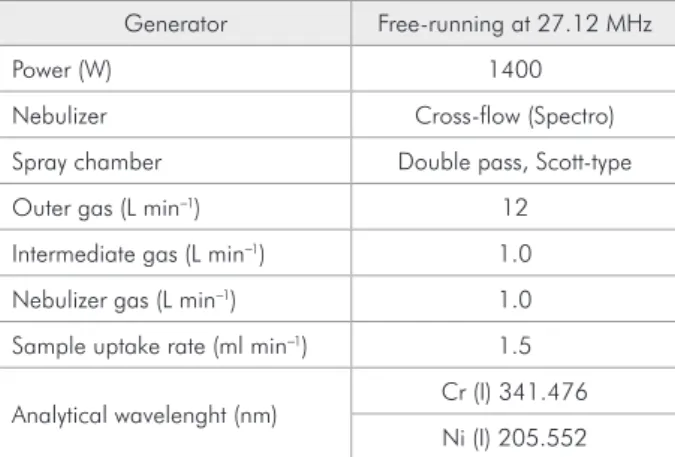
São Paulo, SP, Brazil) was used as the purge gas. The instrumental setting-up conditions are shown in Table 1. Artiicial plaque luid samples from A, B, D, E, and F brackets presented high concentra-tions of Ni and Cr. In this case, determination of Ni and Cr was not possible by SIMAAS, since several dilutions would have been necessary, decreasing ac-curacy. Therefore, levels of Ni and Cr were deter-mined by inductively coupled plasma optical emis-sion spectrometry (ICP OES), model Spectro Ciros
CCD (Spectro Analytical Instruments GmbH &
Co., Kleve, Germany). The instrumental
setting-up conditions are shown in Table 2. The detection limits of SIMAAS and ICP OES were calculated based on calibration curves. For SIMAAS, the
de-tection limits for the synthetic saliva samples (µg
L−1) were 2.78 for Ni and 0.27 for Cr; for the
ar-tiicial plaque luid samples (µg L−1), the detection
limits were 2.77 for Ni and 0.85 for Cr. For ICP
OES, the detection limits were the same (0.4 µg L−1)
for both elements.
The Ni and Cr released values from 7 different groups of brackets immersed in 2 different solutions over a period of 28 days were analyzed using the Kruskal-Wallis test and the non-parametric multiple comparison test. Tests were performed with a 5%
Element Cr Ni
Wavelength 232.0 nm 357.0 nm
Band pass 0.7 nm 0.7 nm
Lamp type* HCL HCL
Lamp current 25 mA 25 mA
Calibration range 2.5 to 20 µg L−1 0.1 to 0.8 µg L−1
Signal measurements Peak area (AA-BG) Standard and sample volume 10 µl
Standard and sample replicates 3 Heating program for SIMAAS
Step T (°C) Ramp (s) Hold (s) Ar (mL min−1)
Dry I 110 10 15 250
Dry II 130 1 10 250
Pyrolysis 1,300 10 20 250
Atomization** 2,400 0 5 0
Cleaning 2,500 1 3 250
*HCL: Hollow Cathode Lamp; **Read time.
level of signiicance. Values below the detection lim-its were subject to statistical analysis, even if inac-curate, having been estimated by the apparatus. In the tables, however, these values are referred to as
“below detection limits” (<DL).
Results
The mean weekly values for Ni and Cr release (µg
L−1) from the studied brackets immersed in synthetic
saliva and artiicial plaque luid over the experimen-tal time and the data from the control group are pre-sented in Table 3. Since the Kruskal-Wallis test was applied, median values were considered instead of mean values. The amount of Ni released in synthetic
saliva (µg L−1 per week) varied between groups from
<DL (below detection limits) (C brackets) to 694 (A
brackets); in artiicial plaque luid, it varied from 49 (C brackets) to 5,948.5 (E brackets). The group of brackets made of cobalt-chromium alloy (F), with the least nickel content (0.5%), did not release the least amounts of Ni. Amounts of Cr detected in
syn-thetic saliva and in artiicial plaque luid (µg L−1 per
week) were from 1 (D brackets) to 10.4 (F brackets) and from 50.5 (G brackets) to 8,225 (D brackets), respectively.
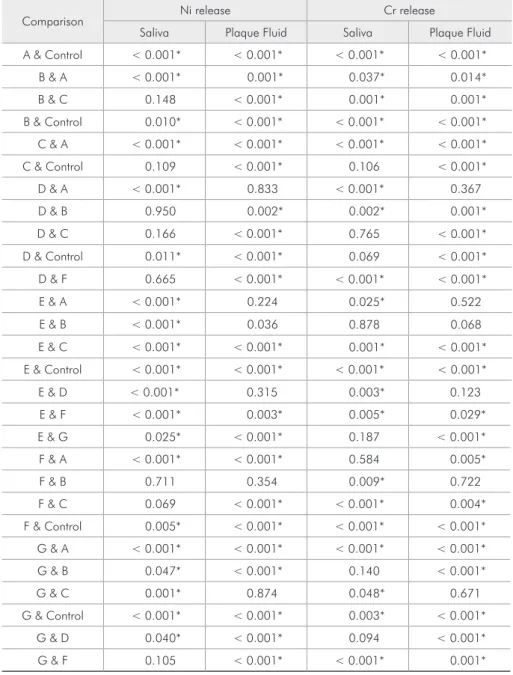
The P values obtained from the non-parametric multiple comparison test for Ni and Cr release in
Table 2 - ICP operating conditions.
Generator Free-running at 27.12 MHz
Power (W) 1400
Nebulizer Cross-flow (Spectro) Spray chamber Double pass, Scott-type Outer gas (L min−1) 12
Intermediate gas (L min−1) 1.0
Nebulizer gas (L min−1) 1.0
Sample uptake rate (ml min−1) 1.5
Analytical wavelenght (nm) Cr (I) 341.476 Ni (I) 205.552
(I): Atomic emission line.
Table 3 - Mean weekly values of Ni and Cr release (µg L-1) for different groups of brackets immersed in synthetic saliva and artificial plaque fluid.
Brackets Solution Ni release Cr release
Mean SD Median N Mean SD* Median N
A S 597.76 289.49 694.00 80 13.39 11.55 10.00 80 PF 6,118.95 3,942.51 5,033.50 80 6,733.90 2,134.24 6,395.50 80
B S 10.39 11.11 6.55 80 5.73 4.57 4.20 80 PF 1,731.08 982.91 1,566.00 80 3,590.30 2,516.70 3,286.00 80
C S 6.93 9.42 <DL 80 1.60 1.42 1.05 80 PF 237.83 446.83 49.00 80 102.60 79.58 74.00 80
D S 13.07 15.96 6.60 80 2.27 3.09 1.00 80 PF 6,999.11 6,334.58 4,035.00 80 13,727.13 11,691.77 8,225.00 80
E S 54.28 46.62 35.85 80 6.84 8.26 3.90 80 PF 5,960.30 4,390.25 5,948.50 80 6,867.76 4,607.71 7,381.50 80
F S 14.17 15.08 8.95 80 13.17 7.43 10.40 80 PF 1,570.48 1,221.76 1,514.50 80 2,472.35 1,958.00 2,314.50 80
G S 25.26 25.83 17.10 80 4.36 5.12 1.75 80 PF 197.64 374.94 76.00 80 114.55 207.22 50.50 80
Control S <DL - <DL 24 0.23 0.33 0.05 24 PF <DL - <DL 24 0.68 0.72 0.40 24
*SD: Standard deviation; S: Synthetic Saliva; PF: Artificial Plaque Fluid; <DL: Bellow detection limits (2.78 µg L−1 for Ni and 0.27 µg L−1 for Cr in synthetic
Comparison Ni release Cr release
Saliva Plaque Fluid Saliva Plaque Fluid A & Control < 0.001* < 0.001* < 0.001* < 0.001*
B & A < 0.001* 0.001* 0.037* 0.014* B & C 0.148 < 0.001* 0.001* 0.001* B & Control 0.010* < 0.001* < 0.001* < 0.001* C & A < 0.001* < 0.001* < 0.001* < 0.001* C & Control 0.109 < 0.001* 0.106 < 0.001* D & A < 0.001* 0.833 < 0.001* 0.367 D & B 0.950 0.002* 0.002* 0.001* D & C 0.166 < 0.001* 0.765 < 0.001* D & Control 0.011* < 0.001* 0.069 < 0.001* D & F 0.665 < 0.001* < 0.001* < 0.001* E & A < 0.001* 0.224 0.025* 0.522 E & B < 0.001* 0.036 0.878 0.068 E & C < 0.001* < 0.001* 0.001* < 0.001* E & Control < 0.001* < 0.001* < 0.001* < 0.001* E & D < 0.001* 0.315 0.003* 0.123 E & F < 0.001* 0.003* 0.005* 0.029* E & G 0.025* < 0.001* 0.187 < 0.001* F & A < 0.001* < 0.001* 0.584 0.005* F & B 0.711 0.354 0.009* 0.722 F & C 0.069 < 0.001* < 0.001* 0.004* F & Control 0.005* < 0.001* < 0.001* < 0.001* G & A < 0.001* < 0.001* < 0.001* < 0.001* G & B 0.047* < 0.001* 0.140 < 0.001* G & C 0.001* 0.874 0.048* 0.671 G & Control < 0.001* < 0.001* 0.003* < 0.001*
G & D 0.040* < 0.001* 0.094 < 0.001* G & F 0.105 < 0.001* < 0.001* 0.001*
*Statistically significant difference at P < 0.05.
Table 4 - P values obtained from nonparametric multiple comparisons of controls and studied brackets for Ni and Cr
release (µg L−1) in synthetic saliva
and artificial plaque fluid.
synthetic saliva and artiicial plaque luid among the different studied brackets and controls are displayed in Table 4.
Graphs 1 to 4 present median values of Ni and
Cr release (µg L−1) in synthetic saliva and artiicial
plaque luid detected at each week over the experi-mental time. These graphs do not show a trend toward decrease or increase in metal release from week 1 to week 4 in general.
Artiicial plaque luid samples from the ex-perimental groups presented signiicantly higher
rates of Ni and Cr than synthetic saliva samples (p < 0.001*). The control group did not present dif-ference between artiicial plaque luid and synthetic saliva samples (p = 0.950 for Ni and 0.585 for Cr).
Discussion
ac-Graph 1 - Median values of Ni
concentration (µg L−1) detected in
synthetic saliva for controls and studied brackets.
Median
Control Groups of brackets
0
A B C D E F G
100 200 300 400 500 600 700 800 7 days 14 days 21 days 28 days 1 .0 0 0 .4 5 0 .0 0 0 .1 0 4 1 1 .2 5 6 2 2 .8 5 5 5 0 .5 0 7 2 2 .5 0 8 .4 5 3 .1 0 1 3 .7 5 9 .8 5 7 .0 5 0 .9 0 1 .4 0 2 .7 0 2 0 .2 0 1 .8 5 2 3 .3 5 2 .4
5 51
.1 5 2 9 .1 5 7 5 .1 5 1 8 .6 0 2 5 .6 5 6 .0 5 1 2 .8 5 0 .4
5 23.7
0 8 .6 0 1 8 .4 0 1 0 .2 0
Graph 2 - Median values of Ni
concentration (µg L−1) detected in
artificial plaque fluid for controls and studied brackets.
Median
Control Groups of brackets
0
A B C D E F G
2,000 4,000 6,000 8,000 10,000 12,000 7 days 14 days 21 days 28 days 8 0 .0 0 2 5 .0 0 2 4 .0 0 1 0 7 5 7 .5 0 1 1 3 4 7 .5 0 0 .9 5 0 .0 0 0 .0 0 0 .0 0 9 6 2 4 .5 0 4 4 1 4 .0 0 4 2 1 4 .5 0 4 1 8 3 .0 0 2 2 6 1 .0 0 2 5 8 5 .5 0 1 4 9 8 .5 0 1 0 1 4 .0 0 2 8 0 .0 0 4 1 6 4 .5 0 3 2 0 7 .0 0 3 2 3 7 .5 0 8 0 4 1 .0 0 3 3 0 4 .0 0 4 6 8 .5 0 2 6 8 4 .0 0 1 9 7 0 .0 0 1 2 0 2 .5 0 8 6 2 .0 0 1 8 7 .0 0 8 7 .0 0 3 3 .0 0 2 1 .5 0
Graph 4 - Median values of Cr
concentration (µg L−1) detected in
artificial plaque fluid for controls and studied brackets.
Median
Control Groups of brackets
0
A B C D E F G
5,000 10,000 15,000 20,000 25,000 7 days 14 days 21 days 28 days 1 5 1 .5 0 1 0 2 .0 0 4 5 .0 0 4 0 .5 0 2 1 5 9 8 .5 0 5 4 9 .0 0 1 7 1 .0 0 6 1 .5 0 3 2 .5 0 2 3 .0 0 0 .6 0 0 .5 0 0 .2 5 0 .6 0 5 7 0 4 .5 0 7 3 8 7 .0 0 7 1 9 4 .0 0 6 0 2 7 .5 0 2 2 2 0 .0 0 6 6 8 5 .5 0 3 3 0 7 .5 0 2 1 4 8 .5 0 8 2 3 4 .0 0 6 3 5 2 .0 0 6 4 3 8 .5
0 952
7 .5 0 1 0 2 7 4 .5 0 6 0 9 0 .0 0 4 1 5 4 .5 0 2 9 2 8 .0 0 1 7 5 5 .5 0 1 1 0 5 .0 0
Graph 3 - Median values of Cr
concentration (µg L−1) detected in
synthetic saliva for controls and studied brackets.
Median
Control Groups of brackets
0
A B C D E F G
5 10 15 20 25 7 days 14 days 21 days 28 days 0 .2 5 0 .3 0 0 .0 0 0 .0 0 1 9 .6 0 1 0 .8 0 9 .3 5 3 .8 0 6 .0 5 2 .5 5 1 0 .3 5 3 .1 0 2 .5 0 0 .5 0 1 .1 0 1 .0
5 2.10
cording to the studied metal (Ni or Cr) or the im-mersion medium.
Results exhibited high standard deviation and variance values, which seems to be a sample
char-acteristic, also found by Barrett et al.15 (1993) and
Eliades et al.16 (2004). However, it was possible to
ind statistical differences between the groups since the amounts of Ni and Cr release were quite differ-ent. The sample size was determined in compliance
with ISO 10271/2001.13 Additionally, this study
used a sample size even larger than the sample size
used by other in vitro studies that measured metal
release.15-18
A direct comparison between the values obtained in this study and those obtained in other studies cannot be made since different methodologies were
applied or different variables were tested. Barrett et
al.15 (1993), Hwang et al.19 (2001) and Shin et al.20
(2003) have tested complete orthodontic appliances immersed in different synthetic saliva formulas.
Staf-folani et al.18 (1999) tested orthodontic appliances
immersed in organic and inorganic acids. Eliades et
al.16 (2004), Huang et al.21 (2001) and Huang et al.22
(2004) observed smaller values of metal release than this study. However, these studies all used different immersion solutions, and did not include solutions replaced weekly, which may have caused a satura-tion of the immersion medium, decreasing Ni and
Cr release. Platt et al.9 (1997) tested different alloys,
fragments of 2205 and 316L stainless steel, but not
orthodontic brackets. Kuhta et al.23 (2009) tested
metal ion release from simulated orthodontic ap-pliances with different types of archwires, and ob-served that the type of archwire can also inluence the release of ions.
The A brackets presented the highest amounts of Ni release in artiicial saliva, and the C brack-ets presented the least. The F brackbrack-ets, made of Co-Cr wear-resistant alloy with the least Ni content
(0.5%),11 did not release the least amounts of Ni.
This corrosion behavior of the F brackets can be ex-plained by the characteristics exhibited by the Co-Cr wear-resistant alloy with low nickel content (3% max.) in aqueous medium. According to the Key to
Metals Database,11 even though this alloy possesses
some resistance to aqueous corrosion, it is limited by grain boundary carbide precipitation, as well as by the lack of vital alloying elements in the matrix, after formation of the carbides, and by chemical seg-regation in the microstructure. These characteristics are important and clinically relevant.
Comparing Victory™ and Full Size™ from
Uni-tek™, it was evident that different models from the
same manufacturer may exhibit different rates of Ni and Cr release.
Graphs 1 to 4 did not present a trend toward increasing or decreasing rates of Ni and Cr release over the experimental period. Deining a pattern of Ni and Cr release over time was not an objec-tive of this study as it would be necessary to conduct
a long term study for that. Wataha, Lockwood24
(1998), which evaluated metal release from alloys in cell culture over 10 months, detected metal release
during the whole experiment. Barrett et al.15 (1993)
observed a decrease in Ni release over 28 days, and a variation in Cr release during the study. Grimsdot-tir et al.17 (1992) performed immersion tests for 14
days, and Sfondrini et al.25 (2009) performed them
for 120 hours, although ISO 10271/200113
deter-mines a minimum observation period of 28 days. Our results showed that the artiicial plaque luid caused a signiicantly higher rate of Ni and Cr re-lease than artiicial saliva. This inding agrees with
the indings of other studies.18,21-23 It also reinforces
the necessity of appropriate oral hygiene to mini-mize corrosion rates.
Further in vivo studies are necessary to
deter-mine the clinical implications of the indings of this study.
Conclusion
References
1. Grimsdottir MR, Hensten-Pettersen A, Kullmann A. Cy-totoxic effect of orthodontic appliances. Eur J Orthod. 1992;14(1):47-53.
2. Bumgardner JD, Lucas LC. Cellular response to metallic ions released from nickel-chromium dental alloys. J Dent Res. 1995;74(8):1521-7.
3. Sakai T, Takeda S, Nakamura M. The effects of particulate metals on cell viability of osteoblast-like cells in vitro. Dent Mater J. 2002;21(2):133-46.
4. Kerosuo H, Kullaa A, Kerosuo E, Kanerva L, Hensten-Pet-tersen A. Nickel allergy in adolescents in relation to orthodon-tic treatment and piercing of ears. Am J Orthod Dentofacial Orthop. 1996;109(2):148-54.
5. Janson GRP, Dainesi EA, Consolaro A, Woodside DG, Frei-tas MR. Nickel hypersensitivity reaction before, during, and after orthodontic therapy. Am J Orthod Dentofacial Orthop. 1998;113(6):655-60.
6. Marigo M, Nouer DF, Genelhu MC, Malaquias LC, Pizziolo VR, Costa AS et al. Evaluation of immunologic profile in pa-tients with nickel sensitivity due to use of fixed orthodontic ap-pliances. Am J Orthod Dentofacial Orthop. 2003;124(1):46-52.
7. Faccioni F, Franceschetti P, Cerpelloni M, Fracasso ME. In vivo study on metal release from fixed orthodontic appli-ances and DNA damage in oral mucosa cells. Am J Orthod Dentofacial Orthop. 2003;124(6):687-93.
8. International Agency for Research on Cancer. Chromium, nickel and welding. Lyon: International Agency for Research on Cancer; 1990. 667 p.
9. Platt JA, Guzman A, Zuccari A, Thornburg DW, Rhodes BF, Oshida Y et al. Corrosion behavior of 2205 duplex stainless steel. Am J Orthod Dentofacial Orthop. 1997;112(1):69-79. 10. Maijer R, Smith DC. Biodegradation of the orthodontic
brack-et system. Am J Orthod Dentofacial Orthop. 1986;90(3):195-8.
11. Key to Metals: nonferrous [database on the Internet]. Cobalt and cobalt alloys [cited 2008 Abr 19]. Available from: http:// www.key-to-nonferrous.com/Print.aspx?id=CheckArticle &LN =EN&NM= 54Print.aspx?id=CheckArticle&LN =E
N&NM= 54.
12. McLaughlin RP, Bennett JC, Trevisi HJ. Systemized or-thodontic treatment mechanics. Edinburgh: Mosby; 2001.
13. International Standard Organization. ISO 10271: Dental metallic materials: corrosion test methods. Genebra: ISO; 2001.
14. Leung VWH, Darvell BW. Calcium phosphate system in sa-liva-like media. J Chem Soc Faraday Trans. 1991;87(11):1759-64.
15. Barrett RD, Bishara SE, Quinn JK. Biodegradation of orthodontic appliances. Part I. Biodegradation of nickel and chromium in vitro. Am J Orthod Dentofacial Orthop. 1993;103(1):8-14.
16. Eliades T, Pratsinis H, Kletsas D, Eliades G, Makou M. Char-acterization and cytotoxicity of ions released from stainless steel and nickel-titanium orthodontic alloys. Am J Orthod Dentofacial Orthop. 2004;125(1):24-9.
17. Grimsdottir MR, Gjerdet NR, Hensten-Pettersen A. Composi-tion and in vitro corrosion of orthodontic appliances. Am J Orthod Dentofacial Orthop. 1992;101(6):525-32.
18. Staffolani N, Damiani F, Lilli C, Guerra M, Staffolani NJ, Belcastro S et al. Ion release from orthodontic appliances. J Dent. 1999;27(6):449-54.
19. Hwang CJ, Shin JS, Cha JY. Metal release from simulated fixed orthodontic appliances. Am J Orthod Dentofacial Or-thop. 2001;120(4):383-91.
20. Shin JS, Oh KT, Hwang CJ. In vitro surface corrosion of stainless steel and NiTi orthodontic appliances. Aust Orthod J. 2003;19(1):13-8.
21. Huang TH, Yen CC, Kao CT. Comparison of ion release from new and recycled orthodontic brackets. Am J Orthod Dentofacial Orthop. 2001;120(1):68-75.
22. Huang TH, Ding SJ, Yan M, Kao CT. Metal ion release from new and recycled stainless steel brackets. Eur J Orthod. 2004;26(2):171-7.
23. Kuhta M, Pavlin D, Slaj M, Varga S, Lapter-Varga M, Slaj M. Type of archwire and level of acidity: effects on the release of metal ions from orthodontic appliances. Angle Orthod. 2009;79(1):102-10.
24. Wataha JC, Lockwood PE. Release of elements from dental casting alloys into cell-culture medium over 10 months. Dent Mater. 1998;14(2):158-63.