Gender disparities in health and healthcare:
results from the
Portuguese National Health
Interview Survey
Disparidades de gênero na saúde e nos cuidados
de saúde: resultados para Portugal com base no
Inquérito Nacional de Saúde
1 Escola Nacional de Saúde Pública, Universidade Nova de Lisboa, Lisboa, Portugal. 2 Instituto Superior de Ciências Sociais e Políticas, Universidade Técnica de Lisboa, Lisboa, Portugal.
Correspondence J. Perelman
Escola Nacional de Saúde Pública, Universidade Nova de Lisboa.
Avenida Padre Cruz, Lisboa 1600-560, Portugal. [email protected]
Julian Perelman 1
Ana Fernandes 2
Céu Mateus 1
Abstract
Although women experience poorer health condi-tions during their lives, they live longer than men. The main explanations for this paradox suggest that women’s excess of ill-health is limited to mi-nor illnesses and their different attitudes toward health. The authors test these assumptions by in-vestigating disparities between men and women in health and healthcare in Portugal. Data are used from the Portuguese National Health Inter-view Survey 2005/2006 (N = 33,662). Multivariate regressions showed that women were more likely to report worse self-rated health, more days with disability, higher prevalence of hypertension, chronic pain, cancer, anxiety and depression, and more medical consultations. Heart disease was significantly more prevalent among men, possi-bly explaining part of the paradox. Women’s more frequent use of medical consultations may reflect their heightened awareness of health problems, which may protect them against early death. Gender differences in socioeconomic status ex-plain part of the differences in health, but fail to provide a complete understanding.
Gender Identity; Health Status Disparities; Health-care Disparities; Socioeconomic Factors
Introduction
Recent reviews and studies on gender and health consistently point to a well-known and still un-explained paradox: although women experience poorer health conditions during their lives, on average they live longer than men 1,2,3,4. The main explanation suggests that women’s excess of ill-health is limited to minor physical morbidity 5, while men’s illnesses are less frequent but more serious, explaining the higher male mortality rate at all ages 2,6,7. However, some authors report that women are also more likely to be affected by chronic conditions 3,8 and severe disability 9,10, so the evidence remains ambiguous and the ques-tion unsolved.
Different attitudes toward health are an al-ternative explanation for the paradox. If women were more aware of their health status, leading to greater use of health care services, they would also be better protected against severe diseases that influence the probability of death 2. Several studies have shown that women use primary care consultations more frequently 6,11,12, while men have higher hospitalization rate and longer aver-age length of hospital stay, possibly reflecting a delay in their use of healthcare services 6. These results may also confirm that men experience more severe health conditions.
severe health conditions. We test the hypothesis that women’s poorer health is limited to milder conditions. We also investigate gender differenc-es in healthcare use, allowing us to disentangle the possible role of different health-related at-titudes on basis of gender. Finally, we investigate the causes of gender differences in health. To do so, we analyze the role of socioeconomic factors in the intermediate relationship between gender and health. Indeed, it is often argued that wom-en’s higher morbidity is related to their lower so-cioeconomic status, justifying the use of the gen-der concept. Among others, Annandale 13 (p. 148) posits that “if men and women were in the same role positions, there would be little or no difference in their health status”. Still, other authors indicate that in each social category, women report higher rates of ill health than men 14. Our study also con-tributes to this ongoing debate.
Methods
The Portuguese National Health Interview Survey
The data are from the Fourth National Health Interview Survey (INS), which was conducted in 2005 and 2006 in all regions of Continental Por-tugal. A sample of 19,581 private households was selected using a multi-stage random probability design, resulting in a nationally-representative sample of the non-institutionalized population in Portugal. The information was gathered by trained interviewers during face-to-face inter-views with a household representative, includ-ing questions about health, lifestyle, healthcare use, and social and demographic conditions. The subjective health question was always answered by the individual her/himself. Quality control was conducted by re-administration of the same questionnaire to 10% of the initial sample (for more information on the INS, see the reference of the Instituto Nacional de Saúde Ricardo Jorge 15). Our analysis focuses on persons aged 18 or older, representing 33,662 individuals (47.6% men and 52.4% women).
Health status
We used three types of indicators 16: subjective health (self-rated health and sick/unwell), func-tional health (restricted-activity days and bed days), and medical health (limiting chronic con-dition and chronic diseases).
Self-rated or subjective health relates to the individual’s personal sense of well-being. It was measured with two questions: “Overall, how do
you rate your state of health?” (on a 5-point scale from “very bad” to “very good”) and “Have you felt sick or unwell in the last two weeks?” (“yes” or “no”). Self-rated health is a widely used health indicator that has been shown to be associated with early mortality 17.
Functional health was measured by the prev-alence of self-reported short-term limitations during the previous two weeks, using the ber of days of restricted activities and the num-ber of bed days (note that this indicator does not necessarily refer to inpatient days, but to days of complete immobilization, regardless of the set-ting). These variables measure whether the per-sons had to restrict their usual activities due to illness or injury.
Medical health was measured by chronic con-ditions. We measured the prevalence of the eight chronic diseases surveyed in the INS, which all represent a reduction in quality of life (asthma, diabetes, hypertension, chronic pain, rheumatic disease and osteoporosis, cancer, anxiety and de-pression, and cardiac disease). These indicators have been widely used to measure health ineq-uity in Portugal 18.
Healthcare use
The first indicator was the total number of phy-sician consultations. The second indicator dis-tinguished between consultations with general practitioners and specialists. Since the INS only specifies the type of the most recent consultation, we defined the probability of having consulted with a general practitioner or specialist based on the immediately preceding consultation.
Socioeconomic status
Edu-cational groups were constructed based on the International Standard Classification of Educa-tion (ISCED-97) 21.
Second, employment status indicated wheth-er the pwheth-erson was currently part of the labor force. Among those not in the active labor force, we distinguished the unemployed, housewives, retired persons, and those out of the labor force for other reasons (mainly disabled and students). Employment status is one of the most important variables associated with health in both men and women 19.
Third, we used an indicator for income. Re-spondents were asked to tick one of ten income categories that was the best proxy for their house-hold’s disposable income in the previous month. To calculate individual income, we applied the rule used in the most recent studies on income-related health inequity, using the “OECD-modi-fied” equivalence scale 22. Based on this scale, we assigned a weight of 1 to the first adult, 0.5 to the second adult and each subsequent person aged 14 and over, and 0.3 to anyone under 14.
Fourth, we included a variable for health in-surance status. The Portuguese National Health Service (SNS) provides universal coverage. Pri-vate insurers provide supplementary coverage to around 10% of the population and are financed through individual risk-adjusted contributions. Access to private insurance is an important indi-cator of socioeconomic status, due to its strong association with economic resources. Addition-ally, private and public occupational or profes-sional insurance schemes provide coverage for around 16% of the population, allowing access to some private providers at low co-payment rates; this coverage also correlated with social status (for more details on the Portuguese health care system, see Barros et al. 23).
Fifth, marital status was used because hav-ing a partner acts as a source of social support that can buffer against adverse health effects 10. Finally, we included an indicator for occupa-tion, whose influence on health has been widely demonstrated and tends to vary with gender 24. Occupational groups were based on the Inter-national Standard Classification of Occupations (ISCO-2008; http://www.ilo.org/public/english/ bureau/stat/isco/index.htm, accessed on 05/ Sep/2012), although we were limited to four cat-egories instead of five due to the classes used in the National Health Interview Survey.
Analysis
A descriptive analysis was performed first to compare health status, healthcare use, and so-cioeconomic status between men and women.
Student t confidence intervals were calculated for quantitative measures and chi-square was used to test for statistically significant differences in categorical variables.
Three analyses were performed using differ-ent modeling techniques.
We measured the association between gen-der and health status, controlling for age. Multi-variate logistic regression was performed for bi-nary dependent variables: self-rated health and each of the eight chronic diseases. The number of disability days and bed days were both mod-eled using count data regressions, given the non-negative integer-value nature of the data. A nega-tive binomial model was used to account for data over-dispersion related to the relevant propor-tion of zeros.
We measured the association between gender and medical visits, general practitioner consul-tations, and specialist consultations. Given the non-negative integer-value nature of the data, we used count data regressions to model the number of visits, controlling for age and all health condi-tion variables, added one by one. For disability and bed days, a negative binomial model was found to be more accurate. We kept only those health condition variables that significantly af-fected healthcare use. We modeled the probabili-ties of a general practitioner consultation and a specialist consultation using multivariate logistic regression, using the same procedure as for ad-justment variables.
We estimated the effect of the inclusion of so-cioeconomic status indicators (as independent variables) on the association between gender, health, and healthcare use. One separate regres-sion was performed for each socioeconomic status indicator included as risk-adjustor; then, a regression was performed including all socio-economic status indicators. We compared the coefficients obtained for gender before and after adjusting for socioeconomic status.
Results
Descriptive analysis
were much more likely to have consulted with both general practitioners and specialists.
Table 2 shows socioeconomic characteristics. There were proportionally more women than men with no schooling. Differences were reduced by construction when we considered the highest educational attainment in the household. Men were more likely to be employed, but only small differences were observed in unemployment rates. Men had higher mean income and were more likely to have private insurance and occupy job positions.
Multivariate analysis
Table 3 shows the results from multivariate regres-sions on health status. Controlling for age but for none of factors related to socioeconomic status, women were more likely to have poorer health status according to all indicators except bed days (which showed no significant difference) and car-diac disease (more prevalent among men). Men and women showed large differences for the two self-rated health indicators, where women were twice as likely to report illness or “bad” or “very bad” health. There was also a strong association Table 1
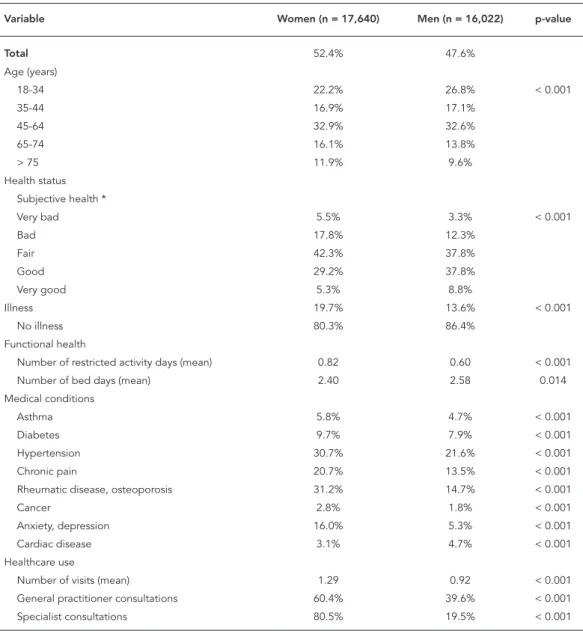
Health status and healthcare use by gender (N = 33,662), Portuguese National Health Interview Survey.
Variable Women (n = 17,640) Men (n = 16,022) p-value
Total 52.4% 47.6%
Age (years)
18-34 22.2% 26.8% < 0.001
35-44 16.9% 17.1%
45-64 32.9% 32.6%
65-74 16.1% 13.8%
> 75 11.9% 9.6%
Health status Subjective health *
Very bad 5.5% 3.3% < 0.001
Bad 17.8% 12.3%
Fair 42.3% 37.8%
Good 29.2% 37.8%
Very good 5.3% 8.8%
Illness 19.7% 13.6% < 0.001
No illness 80.3% 86.4%
Functional health
Number of restricted activity days (mean) 0.82 0.60 < 0.001 Number of bed days (mean) 2.40 2.58 0.014 Medical conditions
Asthma 5.8% 4.7% < 0.001
Diabetes 9.7% 7.9% < 0.001
Hypertension 30.7% 21.6% < 0.001
Chronic pain 20.7% 13.5% < 0.001
Rheumatic disease, osteoporosis 31.2% 14.7% < 0.001
Cancer 2.8% 1.8% < 0.001
Anxiety, depression 16.0% 5.3% < 0.001
Cardiac disease 3.1% 4.7% < 0.001
Healthcare use
Number of visits (mean) 1.29 0.92 < 0.001 General practitioner consultations 60.4% 39.6% < 0.001 Specialist consultations 80.5% 19.5% < 0.001
Table 2
Socioeconomic characteristics by gender (N = 33,662).
Variable Women (n = 17,640) Men (n = 16,022) p-value
Total 52.4% 47.6%
“Individual” schooling
None 19.5% 11.6% < 0.001
Primary 35.0% 37.5%
Junior high 22.3% 29.2%
Secondary & post-secondary 11.7% 12.7%
University 11.4% 9.0%
“Dominant” schooling
None 9.4% 5.7% < 0.001
Primary 24.7% 23.8%
Junior high 26.9% 30.7%
Secondary & post-secondary 19.7% 20.8%
University 19.3% 18.9%
Employment status
Housewife 20.1% 0.1% < 0.001
Unemployed 4.4% 4.6%
Retired 23.1% 24.9%
Employed 44.6% 61.8%
Others out of labor force 7.9% 8.5%
Income (mean) 601.84 628.27 < 0.001
Insurance
Private insurance 6.8% 8.4% < 0.001
Subsystems 16.7% 15.0%
National health service 78.6% 78.2% Marital status *
Married or living with partner 64.0% 70.4% < 0.001
Divorced, separated 4.3% 2.4%
Widowed 14.9% 3.4%
Single 16.9% 23.8%
Occupation
Managerial, professional 11.5% 12.7% < 0.001 Technical, sales, administrative 35.3% 23.5%
Manual 28.3% 52.6%
None 22.9% 11.1%
* Categories divorced/separated and widowed did not include people with this status who were living with a partner.
with self-reported anxiety and depression (OR = 3.375), hypertension (OR = 1.558), chronic pain (OR = 1.593), and cancer (OR = 1.418).
The inclusion of socioeconomic variables generally reduced the odds ratios. In particular, the association with gender lost significance for diabetes, while the number of bed days became significantly higher among men. Nonetheless, for other health measures, estimates did not vary greatly in magnitude or statistical significance. Socioeconomic adjustment increased the gender gap for chronic pain and rheumatic disease, that
is, these diseases were more likely to affect wom-en from higher socioeconomic brackets. Finally, individual education contributed the most to reducing gender inequality in subjective health; however, as for chronic conditions, although no clear pattern emerged, employment status and occupation contributed more to explaining gen-der inequalities.
Table 3
Association between gender and health status according to age-adjusted odds ratios.
SES adjustor Health status indicator
SAH1 SAH2 Disability days * Bed days *
No SES 2.111
(1.968-2.263)
1.507 (1.417-1.604)
1.267 (1.164-1.379)
0.901 (0.797-1.018) “Individual” schooling 1.991
(1.854-2.137)
1.496 (1.405-1.593)
1.275 (1.171-1.389)
0.908 (0.804-1.026) “Dominant” schooling 2.074
(1.932-2.226)
1.504 (1.413-1.601)
1.274
(1.171-1.387)
0.912
(0.807-1.030) Employment status 2.031
(1.884-2.189)
1.508 (1.412-1.610)
1.334 (1.221-1.458)
0.881 (0.777-0.999)
Income 2.056
(1.915-2.207)
1.506 (1.414-1.603)
1.265 (1.162-1.378)
0.903 (0.799-1.022)
Insurance 2.080
(1.939-2.232)
1.508 (1.417-1.604)
1.274 (1.171-1.387)
0.899 (0.795-1.016) Marital status 2.096
(1.950-2.254)
1.495 (1.403-1.593)
1.287 (1.179-1.404)
0.907 (0.799-1.030)
Occupation 2.194
(2.031-2.371)
1.557 (1.456-1.666)
1.403 (1.280-1.538)
0.856 (0.749-0.978)
All SES 2.077
(1.912-2.256)
1.514 (1.412-1.625)
1.453 (1.319-1.601)
0.868 (0.756-0.997)
Asthma Diabetes Hypertension Chronic pain
No SES 1.209
(1.097-1.332)
1.144 (1.058-1.238)
1.558 (1.475-1.646)
1.593 (1.501-1.690) “Individual” schooling 1.173
(1.064-1.294)
1.128 (1.041-1.221)
1.560 (1.476-1.648)
1.571 (1.480-1.669) “Dominant” schooling 1.202
(1.091-1.325)
1.147 (1.060-1.241)
1.561 (1.478-1.649)
1.581 (1.489-1.678) Employment status 1.193
(1.077-1.321)
1.087 (0.999-1.183)
1.533 (1.446-1.625)
1.608 (1.510-1.713)
Income 1.199
(1.087-1.322)
1.137 (1.050-1.231)
1.546 (1.463-1.633)
1.584 (1.491-1.683)
Insurance 1.210
(1.098-1.333)
1.134 (1.048-1.227)
1.557 (1.474-1.644)
1.594 (1.502-1.692) Marital status 1.170
(1.059-1.292)
1.121 (1.033-1.216)
1.540 (1.456-1.630)
1.591 (1.496-1.691)
Occupation 1.191
(1.072-1.323)
1.094 (1.003-1.194)
1.562 (1.471-1.659)
1.667 (1.562-1.780)
All SES 1.128
(1.011-1.258)
1.049 (0.958-1.150)
1.516 (1.423-1.614)
1.645 (1.537-1.761)
Table 3 (continued)
Rheumatic disease, osteoporosis
Cancer Anxiety, depression Cardiac disease
No SES 2.767
(2.608-2.936)
1.418 (1.224-1.643)
3.375 (3.113-3.658)
0.540 (0.481-0.607) “Individual” schooling 2.745
(2.585-2.914)
1.476 (1.272-1.712)
3.515 (3.241-3.812)
0.537 (0.477-0.603) “Dominant” schooling 2.763
(2.604-2.932)
1.448 (1.249-1.678)
3.427 (3.161-3.715)
0.546 (0.486-0.614) Employment status 2.764
(2.596-2.994)
1.361 (1.164-1.591)
3.329 (3.062-3.620)
0.549 (0.485-0.622)
Income 2.719
(2.561-2.887)
1.404 (1.210-1.628)
3.382 (3.117-3.669)
0.544 (0.484-0.611)
Insurance 2.759
(2.600-2.928)
1.418 (1.223-1.643)
3.375 (3.114-3.659)
0.537 (0.478-0.603) Marital status 2.778
(2.613-2.953)
1.441 (1.238-1.678)
3.227 (3.019-3.556)
0.535 (0.473-0.604)
Occupation 2.848
(2.669-3.040)
1.370 (1.167-1.608)
3.235 (2.968-3.526)
0.566 (0.498-0.643)
All SES 2.813
(2.628-3.011)
1.366 (1.157-1.613)
3.104 (2.841-3.392)
0.550 (0.480-0.630)
SAH: self-rated health; SES: socioeconomic status. * Values correspond to age-adjusted incident rate ratios.
Table 4
Association between gender and healthcare use according to age- and health condition-adjusted incident rate ratios.
SES adjustor Healthcare use indicator
Number of visits General practitioner visits * Specialist visits *
No SES 1.117
(1.069-1.168)
1.161 (1.090-1.237)
1.133 (1.048-1.225) “Individual” schooling 1.126
(1.077-1.177)
1.157 (1.086-1.233)
1.159 (1.070-1.256) “Dominant” schooling 1.120
(1.071-1.171)
1.152 (1.081-1.227)
1.153 (1.065-1.248) Employment status 1.165
(1.113-1.221)
1.191 (1.115-1.273)
1.190 (1.097-1.291)
Income 1.119
(1.070-1.169)
1.157 (1.085-1.232)
1.143 (1.056-1.238) Insurance 1.124
(1.075-1.175)
1.163 (1.092-1.239)
1.141 (1.055-1.235) Marital status 1.125
(1.076-1.177)
1.159 (1.087-1.236)
1.159 (1.071-1.255) Occupation 1.151
(1.099-1.206)
1.210 (1.130-1.295)
1.094 (1.006-1.191)
All SES 1.162
(1.108-1.219)
1.203 (1.121-1.292)
1.144 (1.047-1.249)
SES: socioeconomic status.
to consult general practitioners and specialists, and inequalities between women and men creased when socioeconomic factors were in-cluded in the analysis. In other words, women’s use of healthcare was underestimated due to their higher degree of social deprivation as com-pared to men. Employment status and occupa-tion were the main factors in the increase in inci-dent rate ratios and odds ratios for consultations with general practitioners. Regarding specialist consultations, employment and marital status contributed more substantially to increase odds ratios.
Discussion
This study focused on gender differences in health and healthcare in Portugal using data from the INS. Controlling for age and socioeconomic sta-tus, our research showed that women were more likely to report poorer subjective health, more days lost to disability, and higher prevalence of several chronic conditions, except cardiac dis-ease (more prevalent among men) and diabetes (no significant differences). Men experienced sig-nificantly more bed days. Finally, women showed significantly greater use of healthcare services.
The difference between men and women in self-rated health was consistent with some stud-ies in the literature 3,5,6, while contradicting oth-ers 8,10,25. Compared to earlier studies, gender disparity was high, even when adjusted for so-cioeconomic status.
Women suffered more from partially restrict-ed activity (number of disability days), confirm-ing earlier results 6. By contrast, men were more affected by complete restrictions. Nevertheless, we cannot argue that women’s illnesses were more frequent while being less severe 5,10,26. We observed a higher prevalence of milder chronic conditions among women, such as asthma and chronic pain, but also hypertension, cancer, anx-iety, and depression. Note that diabetes was more prevalent among women, but this difference can be explained by women’s disadvantaged social status. The only exception was for cardiac dis-ease, significantly more prevalent among men. Women’s health status was thus worse in some cases – undoubtedly self-rated health and milder chronic conditions – but was also higher among men for most severe conditions, rejecting the as-sumption of a “male disadvantage” associated with chronic diseases. The exception of cardiac disease, significantly more prevalent among men, was noticeable. In Portugal, ischemic heart disease is the second cause of death (following cerebrovascular disease) 27. Hence, the higher
prevalence of cardiac disease in men may par-tially explain men’s lower life expectancy/better health paradox, as suggested by empirical evi-dence from the United States over a 14-year pe-riod 2.
Socioeconomic status reduced the magnitude of gender differences, which however remained large and significant. Individual education, oc-cupation, and employment are the variables with the greatest influence on gender-based health patterns. Women are commonly found to be disadvantaged in access to economic resources and high social status 25, which are strong de-terminants of good health. The persistence of gender differences after controlling for social de-terminants may have different interpretations. The “social role” hypothesis postulates that the experience of a given social position (work load, stress, and self-esteem) differs between men and women, with different consequences for health 14. In Portugal, despite the high rate of women’s full-time employment, gender inequal-ity persists in the distribution of domestic tasks, women suffer from lower recognition at work (through lower pay and less access to leader-ship positions), and single mothers receive little formal support 28. According to the “differential vulnerability hypothesis”, women and men react differently to structural factors, and women are more affected by social determinants, life events, chronic stressors, and psychological resources 3. Interestingly, recent studies report that the health effects of childhood socioeconomic status are worse for women 29,30; that is, girls and boys are affected differently by adverse socioeconomic circumstances, for example, through childhood disadvantage contributing to gender discrimina-tion later in life.
In this study, women’s significantly higher use of healthcare services corroborated earlier results 6,9. Women’s higher health care use was observed even among individuals with similar morbidity, and socioeconomic differences be-tween men and women were not the main cause of the observed discrepancies. Women’s greater use of healthcare was also observed for specialist visits, thereby confirming that women’s excess of ill health was not restricted to milder conditions. These findings may help explain why women die later, even if they are ill more frequently. Women may actually be more aware of their health needs and make greater use of preventive healthcare, with positive effects on early diagnosis and life expectancy.
their overall health status and a given number of chronic conditions, lacking more detailed infor-mation on diseases and treatments. Inforinfor-mation was only requested on the most recent medical visits, assuming that the specialty involved in the most recent consultation was the same as in previous ones. Some socioeconomic factors can be criticized as excessively biased and un-reliable; in particular, income is known to be af-fected by high non-response rates and bias due to differences between current and permanent amounts 20, which led us to use a wider range of socioeconomic variables. Despite their weak-nesses, national health interview surveys have been used in many countries and provided valu-able results.
Our results clearly confirmed the excess of ill-health among Portuguese women for a large number of health conditions, including the most
severe ones (except cardiac disease). Hence the paradox is still why men show shorter life expec-tancy despite their better health, even if cardiac disease represents a crucial factor. Longitudinal studies should help provide a better understand-ing of how and when health conditions differ between men and women and the relationship with premature death. In Portugal, as elsewhere, women use health services more, possibly re-flecting their poorer health, but also perhaps their better knowledge and awareness of health problems, which may protect them against early death. Gender differences in socioeconomic sta-tus explain part of the differences in health, but fail to provide a complete understanding. Fur-ther research should include more specific socio-economic and psychosocial determinants that could help elucidate the causal pathway between gender and health.
Resumo
Embora tenham pior saúde ao longo da vida, as mu-lheres vivem mais anos do que os homens. As princi-pais explicações para este paradoxo são que as mulhe-res sofrem mais de doenças menomulhe-res, e adotam atitudes diferentes em relação à saúde. Testamos essas hipóteses pela investigação de disparidades entre homens e mu-lheres na saúde e nos cuidados de saúde em Portugal. Os dados usados são do Inquérito Nacional de Saúde 2005/2006 (N = 33.662). Regressões multivariadas mos-tram que as mulheres declaram pior estado de saúde autoavaliado, maior número de dias de incapacidade, maior prevalência de hipertensão, dor crônica, cancro, ansiedade e depressão, e maior utilização de consultas. A doença cardíaca é significativamente mais preva-lente nos homens, o que pode explicar em parte o pa-radoxo. A maior utilização de consultas nas mulheres pode refletir a sua maior consciência relacionada com a saúde, que talvez seja protetora contra a morte pre-coce. Diferenças de gênero no estatuto socioeconômico explicam parte das diferenças em saúde, mas não per-mitem uma compreensão completa das diferenças.
Identidade de Gênero; Disparidades nos Níveis de Saú-de; Disparidades em Assistência à SaúSaú-de; Fatores So-cioeconômicos
Contributors
J. Perelman participated in the study design, conducted the data analysis, and drafted the manuscript. A. Fer-nandes participated in the study design and revised the manuscript. C. Mateus participated in the study design, data collection, and interpretation of the results and performed a systematic revision of all versions of the draft.
Acknowledgments
References
1. Read JG, Gorman BK. Gender and health inequal-ity. Annu Rev Sociol 2010; 36:371-86.
2. Case A, Paxson CH. Sex differences in mortality and morbidity. Demography 2005; 42:189-214. 3. Denton M, Prus S, Walters V. Gender differences
in health: a Canadian study of the psychosocial, structural and behavioural determinants of health. Soc Sci Med 2004; 58:2585-600.
4. Idler EL. Discussion: gender differences in self-rated health, in mortality, and in the relationship between the two. Gerontologist 2003; 43:372-5. 5. Macintyre S, Hunt K, Sweeting H. Gender
differ-ences in health: are things really as simple as they seem? Soc Sci Med 1996; 42:617-24.
6. Verbrugge LM. Sex differentials in health. Public Health Rep 1982; 97:417-37.
7. Verbrugge LM. Gender and health: an update on hypothesis and evidence. J Health Soc Behav 1985; 26:156-82.
8. McDonough P, Walters V. Gender and health: re-assessing patterns and explanations. Soc Sci Med 2001; 52:547-59.
9. Wingard DL. The sex differential in morbidity, mortality, and lifestyle. Annu Rev Public Health 1984; 5:433-58.
10. Arber S, Cooper H. Gender differences in health in later life: the new paradox? Soc Sci Med 1999; 48:61-76.
11. Cleary PD, Mechanic D, Greenley JR. Sex differenc-es in medical care utilization: an empirical invdifferenc-esti- investi-gation. J Health Soc Behav 1982; 23:106-19. 12. Bertakis KD, Azari R, Helms LJ, Callahan EJ,
Rob-bins JA. Gender differences in the utilization of health care services. J Fam Pract 2000; 49:147-52. 13. Annandale E. The sociology of health and
medi-cine: a critical introduction. Cambridge: Polity Press; 1998.
14. Popay J, Bartley M, Owen C. Gender inequalities in health: social position, affective disorders and minor physical morbidity. Soc Sci Med 1993; 36: 21-32.
15. Instituto Nacional de Saúde Ricardo Jorge. Inqué-rito Nacional de Saúde 2005/2006. Lisboa: Institu-to Nacional de Saúde Ricardo Jorge; 2008. 16. Blaxter M. A comparison of measures of
inequal-ity in morbidinequal-ity. In: Fox J, editor. Health inequalinequal-ity in European countries. London: Aldershot Gower Publishing Co.; 1989. p. 199-230.
17. Idler EL, Benyamini Y. Self-rated health and mor-tality: a review of twenty-seven community stud-ies. J Health Soc Behav 1997; 38:21-37.
18. Lopes S. Equity in the delivery of health care in Por-tugal: evidence from the 1998/99 national health interview survey [Masters Thesis]. York: University of York; 2004.
19. Arber S. Comparing inequalities in women’s and men’s health: Britain in the 1990s. Soc Sci Med 1997; 44:773-87.
20. Krieger N, Williams DR, Moss NE. Measuring so-cial class in US public health research: concepts, methodologies and guidelines. Annu Rev Public Health 1997; 18:341-78.
21. United Nations Educational Scientific and Cultural Organization. ISCED 97 – International Standard Classification of Education. Montreal: United Na-tions Educational Scientific and Cultural Organi-zation; 2006.
22. van Doorslaer E, Koolman X. Explaining the differ-ences in income-related health inequalities across European countries. Health Econ 2004; 13:609-28. 23. Barros PP, Machado SR, Simões JA. Portugal. Health
system review. Health Syst Transit 2011; 13:1-156. 24. Aldabe B, Anderson R, Lyly-Yrjanainen M,
Parent-Thirion A, Vermeylen G, Kelleher CC, et al. Contri-bution of material, occupational, and psychoso-cial factors in the explanation of sopsychoso-cial inequalities in health in 28 countries in Europe. J Epidemiol Community Health 2011; 65:1123-31.
25. Charles M. A world of difference: international trends in women’s economic status. Annu Rev So-ciol 2011; 37:355-71.
26. Lahelma E, Martikainen P, Rahkonen O, Silven-toinen K. Gender differences in ill health in Fin-land: patterns, magnitude and change. Soc Sci Med 1999; 48:7-19.
27. Direcção-Geral da Saúde. Elementos estatísticos: informação geral – saúde/2008. Lisboa: Direcção-Geral da Saúde; 2008.
28. Torres A. Women, gender, and work: the Portu-guese case in the context of the European Union. Int J Sociol 2008; 38:36-56.
29. Strand BH, Murray ET, Guralnik J, Hardy R, Kuh D. Childhood social class and adult adiposity and blood-pressure trajectories 36-53 years: gender-specific results from a British birth cohort. J Epide-miol Community Health 2012; 66:512-8.
30. Maty SC, Lynch JW, Raghunathan TE, Kaplan GA. Childhood socioeconomic position, gender, adult body mass index, and incidence of type 2 diabe-tes mellitus over 34 years in the Alameda County Study. Am J Public Health 2008; 98:1486-94.
Submitted on 29/Mar/2012