w w w . r b h h . o r g
Revista
Brasileira
de
Hematologia
e
Hemoterapia
Brazilian
Journal
of
Hematology
and
Hemotherapy
Original
article
Evaluation
of
criteria
of
manual
blood
smear
review
following
automated
complete
blood
counts
in
a
large
university
hospital
Samuel
Ricardo
Comar
∗,
Mariester
Malvezzi,
Ricardo
Pasquini
UniversidadeFederaldoParaná(UFPR),Curitiba,PR,Brazil
a
r
t
i
c
l
e
i
n
f
o
Articlehistory:
Received24March2017 Accepted20June2017 Availableonline31July2017
Keywords:
Manualbloodsmearreview Completebloodcounts Criteriaformanualbloodsmear review
Positivesmearfindings
a
b
s
t
r
a
c
t
Background:Thereisgreatinterestinreducingthenumberofautomatedcompleteblood countsrequiringmanualblood smearreviewswithoutsacrificingthequalityofpatient care.Thisstudywasaimedatevaluatingandestablishingappropriatescreeningcriteria formanualbloodsmearreviewstoimprovetheperformanceinahematologylaboratory.
Method:Atotalof1977consecutivesamplesfromthedailyworkloadwereusedtoevaluate foursetsofscreeningcriteriaformanualbloodsmearreviewstoidentifysampleswith positivesmearfindings.Threesetsofscreeningcriteriawerearbitrarilyproposedinthis study:Group1(narrowranges),Group2(intermediateranges),andGroup3(widelimits)and oneset(Group4)wasadaptedfromtheInternationalSocietyforLaboratoryHematology.All sampleswererunonSysmexhematologyanalyzersandwereinvestigatedusingmanual bloodsmearreviews.Diagnosticaccuracyandagreementwereperformedforeachsetof screeningcriteria,includinganinvestigationofmicroscopicreviewrateandefficiency.
Results:ThemicroscopicreviewratesforGroups1,2,3and4were73.85%,54.52%,46.33%and 46.38%,respectively;thefalse-negativerateswere0.50%,1.97%,2.73%and3.95%, respec-tively.TheefficiencyandnegativepredictivevaluesofGroup3were73.04%and4.91%, respectively.
Conclusions:Group3hadthebestrelationshipbetweensafety(false-negativerate:≤3%)and efficiencytoestimatethelimitsofautomationinperformingcompletebloodcounts.This studystrengthenstheimportanceofestablishingscreeningcriteriaformanualbloodsmear reviews,whichaccountforthedifferentcontextsinwhichhematologicaldeterminations areperformed.Eachlaboratoryshouldoptimizethescreeningcriteriaformanualblood smearreviewsinordertomaximizetheirefficiencyandsafety.
©2017Associac¸ ˜aoBrasileiradeHematologia,HemoterapiaeTerapiaCelular.Published byElsevierEditoraLtda.ThisisanopenaccessarticleundertheCCBY-NC-NDlicense (http://creativecommons.org/licenses/by-nc-nd/4.0/).
∗ Correspondingauthorat:LaboratóriodeHematologia,UnidadedeLaboratóriodeAnálisesClínicas,HospitaldeClínicas,Universidade FederaldoParaná(UFPR),RuaPadreCamargo,280–AltodaGlória,80060-240Curitiba,PR,Brazil.
E-mailaddress:[email protected](S.R.Comar).
http://dx.doi.org/10.1016/j.bjhh.2017.06.007
Introduction
Amanualbloodsmearreview(MBSR)isdefinedasthe thor-ough and careful microscopic analysis of a well-prepared and stained smear of peripheralblood, with the objective ofseekingmorphologicalchangesrelevanttothediagnosis and monitoring of patients. It isalso considered a tool of internalqualitycontrolfortheevaluationofparameters pro-videdbyhematologyanalyzers.TheprocessofMBSRisamong the most time-consuming in hematology laboratories, and requireshightechnicalcompetencetominimizeerrors inher-enttothesubjectivityofMBSR,includingmanualdifferential leukocytecounts(MDLC).1–6
Over the last few years, the performance and abilities ofautomatic hematology analyzers haveimproved consid-erably.Althoughtheystillcannotidentifyallmorphological abnormalitiesthatmay occurinperipheralblood,theycan reliablydecreasetheMBSRwithoutsacrificingquality.7–12The
establishmentofscreeningcriteria (SC)forMBSR iscritical and is based on the determinationof screening limits for themajorhematologicalparametersandoccurrenceof sus-pectflags.Themorphologicalchangesandcell percentages relevant for the diagnosis and monitoring of patients are definedaspositivesmearfindings(PSF). TheSCare formu-latedsuchthatMBSRoccursonlywhenneededforconfirming theparametervalues,ortoproviderelevantclinical informa-tionrepresentedbythePSFinadditiontothatgeneratedby hematologyanalyzers.13–18
ThemainfactorsinfluencingtheestablishmentofSCfor MBSR can vary between institutions and include features suchas, thetypeofpopulation served,typeofhematology analyzeremployed,training and experienceofthe medical team,volumeofwork,numberofprofessionalsinthe labora-tory,medicalspecialtiesinvolved,complexityoftheservices offered, financialconsiderations, and regulatorypolicies of institutions.1,4,19AlthoughmanySCforMBSRhavebeen
pro-posed,theyarenotcompletelyapplicabletoalllaboratories. Ourpreviousworkdemonstrated thatSCforMBSRadapted from the International Society for Laboratory Hematology (ISLH)16 were not adequate or safe for use in the Clinical
hematologylaboratoryofHospitaldeClínicasattheFederal UniversityofParaná(HC-UFPR).20Thus,asanimprovementin
searchingfortheidealSCforMBSRwithbroaderapplication inhematologylaboratories,theobjectiveofthisstudywasto proposeandevaluatenewSCforMBSR,whichserveasamodel foradjustmentsandconsiderpeculiaritiesintheprofileofthe populationsserved,maintainingsafetyandefficacy.
Methods
Studysite
Theinvestigationwasconductedinthehematology labora-toryofHC-UFPR,ageneralClassIVhospitalandthelargest providerof governmenthealthcareservices inthe State of Paraná,southernBrazil,with627beds(574inoperation). Mod-eratelyto highlycomplex procedures are carried out in59 departmentsincludingahematologicmalignancyunit,bone
marrowtransplantunit,emergencydepartmentandintensive careunits. Approximately30,000outpatientsare seeneach month.
Samples,patientsandhematologyanalyzers
Thestudy design wasapprovedby thelocal Ethics Review BoardrecognizedbytheNationalResearchEthicsCommittee (CONEP).Wholebloodsampleswerecollectedin ethylenedi-aminetetraaceticacid(EDTA)-K2(1.8mg/mL)andresultswere obtainedfromthelaboratoryroutinely,onsevenconsecutive days inthemonths ofNovemberand December (springin thesouthernhemisphere)aftertheirreleaseintothe hospi-tal information system. Altogether1977 (1100 females and 867males)consecutivesamplesmeetingthelocalspecimen acceptance criteria were obtained from 1615 patients (946 females and 669males), with anaverageage of39.7±22.7 years(range:1dayto96years).Withinthesesamples,1320 (66.76%)wereoutpatientsand657(33.24%)werebeing admit-tedorwerehospitalized.Fourhundredandtensampleswere from thehematologyunit,232from theemergency depart-ment,154fromtheintensivecareunit(ICU),94fromtheadult ICU,45 from theneurologyunit,37 fromthe bonemarrow transplantunit, 27from thepediatricand neonatalICU,27 from the infectious diseases unit, 21 from the liver trans-plantationunit,andtwofromtherenaltransplantationunit, amongothers.Threehundredandtwenty-ninesampleswere from childrenaged≤12yearsand36were newbornbabies. Furthermore,1573sampleswere analyzedinaSysmex XE-2100D and 404 ina SysmexXT-2000i hematology analyzer (bothfromSysmexCorporation,Kobe,Japan),within3hafter collection. The resultsofall 1977samplesprovidedby the hematologyanalyzersandMBSRwererecordedina spread-sheet.Ofthe1615patients,1412performedasinglecomplete bloodcount(CBC)duringthesamplecollectionperiodwhile 203underwentmorethanoneCBC(117patientsunderwent two,30patientsunderwentthree;40patientsunderwentfour; 15patientsunderwentfiveandonepatientunderwentsix). Both internalandexternalquality controlprocedureswere followedtomonitorperformanceofthehematologyanalyzers aswellasreliabilityoftheresults.Theadjustmentsand set-tingsontheanalyzerswereperformedbythemanufacturer’s scientificandtechnicalsupportstaff.
Manualbloodsmearreview
For each sample, ablood smearwas preparedand stained using the Sysmex SP-1000i automatic slide maker-stainer (Sysmex Corporation,Kobe,Japan).Samplesthatcontained a low volume of whole blood were prepared manually by thewedge-spreadfilmtechnique,usingtheMay-Grünwald& Giemsastains.MBSRandMDLCwereperformedinallsamples inaccordancewiththerecommendations ofBarnesetal.16
regardingthestepbystepvalidationofcriteriaforMBSRs.In mostcases,100leukocytes werecountedineach smearby oneofsixindependentobserverswithextensiveexperience (10–30years)inMBSR.Acountof100or200cellspersample onasingleslideforonlyoneofeachobserverwas consid-eredasuitablereferencemethodtocomparethefindings.16,21
andgradingthemorphologicalchangesaswellasdescription ofspecificcelltypesobservedbymicroscopysuchas,atypical lymphocytes,bandneutrophilsandimmaturegranulocytes.22
Studydesign
First,newPSFwerelocallydesignedandestablished(Table1) tomeettheconsensusofthehematologylaboratoryat HC-UFPR in terms of morphological changes relevant to the diagnosisand follow-upofpatients. Consequently,to iden-tify samples with these PSF, four sets of SC as shown in
Table2wereevaluated:Group1(narrowcut-offlimits),Group2 (intermediarycut-offlimits),Group3(widecut-offlimits)and cut-offlimitsadaptedfromtheISLH(Group4).Inthefirstthree setsofSCestablishedinthisstudy,theselectionoflimitsfor eachhematologicalparameterwasperformedarbitrarilyand empirically.TheSCadaptedfromtheISLHbyComaretal.20
werealsoevaluatedinordertoassesstheirperformancein identifyingsampleswithnewPSF.Theperformance indica-torsforthesetsofSCwere:(i)rateofmicroscopicreviewslower than50%.ThiswasbasedonthestudybyNovisetal.23onlocal
limitationsofthehospitallaboratoryinformationsystemwith respecttotheimplementationofdeltacheckrulesthat recog-nizediscrepanciesamongtheresultsofthecurrentanalysis andpreviousresultsofapre-establishedperiodoftime,also theamountofworkandthenumberofprofessionalsavailable toperformthesmearreviews;(ii)althoughBarnesetal.16
rec-ommend<5%falsenegativeresultsasthesafetythresholdfor patients,arateof≤3%wasdefined,asrecommendedbyCui etal.24Thisstudywasnotperformedblinded,astheobservers
hadaccesstothevaluesofbloodparametersanddescription ofsuspectflagsintheequipmentreports.Nevertheless,the observershadnopriorknowledgeofthecut-offlimitsineach setofSCandthenewPSFproposedinthisstudy.
Sampleclassification
Thesampleswereclassifiedbyapplyingtherulesofeachset ofSCandcomparingthemwiththefindingsoftheperipheral bloodsmearreview.Asamplewasclassifiedastruepositive (TP)ifitwasselectedtoreviewbycertainSC(Table2)andthe microscopicanalysisproducedsomePSF(Table1).Asample wasclassifiedasfalsepositive(FP)ifitwasselectedtoreview bySCwithnoPSFinmicroscopy.Asamplewasclassifiedas falsenegative(FN)ifitwasnotselectedtoreviewbyanySCand containedsomePSFbymicroscopicanalysis.Finally,asample wasclassifiedastruenegative(TN)ifitwasnotselectedto reviewbyanySCandtheMBSRdidnotshowanyPSF.9,16
Measuresofdiagnosticaccuracyandagreement
Sensitivity,specificity,negativepredictivevalue,positive pre-dictivevalue,efficiencyandconfidenceintervalsforeachset ofSCwereobtainedwiththeCálculosEstatísticossoftwarefor Windowsv.1.8.25 Thesewerecalculatedusingthefollowing
equations:
Sensitivity (%)=
TPTP+FN
×100;
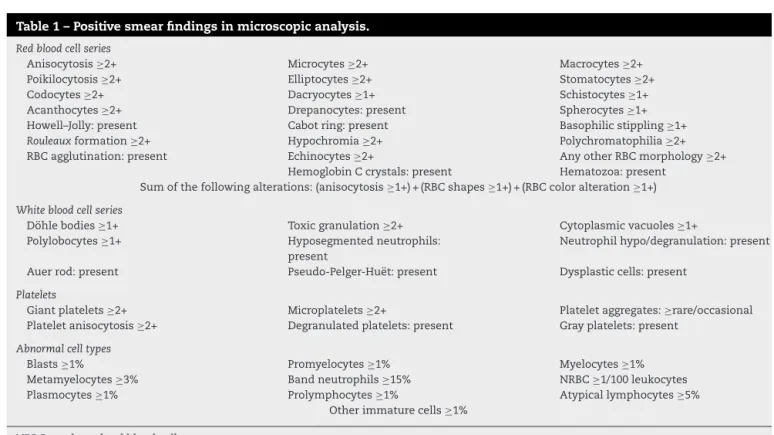
Table1–Positivesmearfindingsinmicroscopicanalysis.
Redbloodcellseries
Anisocytosis≥2+ Microcytes≥2+ Macrocytes≥2+
Poikilocytosis≥2+ Elliptocytes≥2+ Stomatocytes≥2+
Codocytes≥2+ Dacryocytes≥1+ Schistocytes≥1+
Acanthocytes≥2+ Drepanocytes:present Spherocytes≥1+ Howell–Jolly:present Cabotring:present Basophilicstippling≥1+
Rouleauxformation≥2+ Hypochromia≥2+ Polychromatophilia≥2+
RBCagglutination:present Echinocytes≥2+ AnyotherRBCmorphology≥2+ HemoglobinCcrystals:present Hematozoa:present
Sumofthefollowingalterations:(anisocytosis≥1+)+(RBCshapes≥1+)+(RBCcoloralteration≥1+)
Whitebloodcellseries
Döhlebodies≥1+ Toxicgranulation≥2+ Cytoplasmicvacuoles≥1+ Polylobocytes≥1+ Hyposegmentedneutrophils:
present
Neutrophilhypo/degranulation:present
Auerrod:present Pseudo-Pelger-Huët:present Dysplasticcells:present
Platelets
Giantplatelets≥2+ Microplatelets≥2+ Plateletaggregates:≥rare/occasional Plateletanisocytosis≥2+ Degranulatedplatelets:present Grayplatelets:present
Abnormalcelltypes
Blasts≥1% Promyelocytes≥1% Myelocytes≥1%
Metamyelocytes≥3% Bandneutrophils≥15% NRBC≥1/100leukocytes Plasmocytes≥1% Prolymphocytes≥1% Atypicallymphocytes≥5%
Otherimmaturecells≥1%
NRBC:nucleatedredbloodcells.
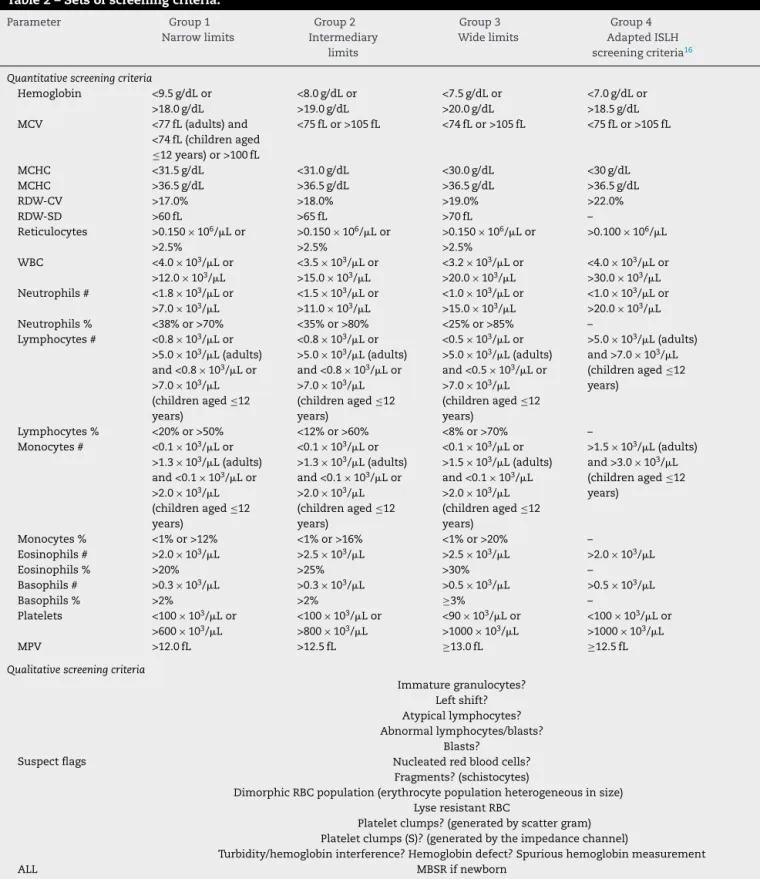
Table2–Setsofscreeningcriteria.
Parameter Group1
Narrowlimits Group2 Intermediary limits Group3 Widelimits Group4 AdaptedISLH screeningcriteria16
Quantitativescreeningcriteria
Hemoglobin <9.5g/dLor >18.0g/dL
<8.0g/dLor >19.0g/dL
<7.5g/dLor >20.0g/dL
<7.0g/dLor >18.5g/dL MCV <77fL(adults)and
<74fL(childrenaged
≤12years)or>100fL
<75fLor>105fL <74fLor>105fL <75fLor>105fL
MCHC <31.5g/dL <31.0g/dL <30.0g/dL <30g/dL
MCHC >36.5g/dL >36.5g/dL >36.5g/dL >36.5g/dL
RDW-CV >17.0% >18.0% >19.0% >22.0%
RDW-SD >60fL >65fL >70fL –
Reticulocytes >0.150×10⁶/ Lor >2.5%
>0.150×10⁶/ Lor >2.5%
>0.150×10⁶/ Lor >2.5%
>0.100×10⁶/ L
WBC <4.0×10³/
Lor >12.0×10³/
L
<3.5×10³/ Lor >15.0×10³/
L
<3.2×10³/ Lor >20.0×10³/
L
<4.0×10³/ Lor >30.0×10³/
L Neutrophils# <1.8×10³/Lor
>7.0×10³/L
<1.5×10³/Lor >11.0×10³/L
<1.0×10³/Lor >15.0×10³/L
<1.0×10³/Lor >20.0×10³/L Neutrophils% <38%or>70% <35%or>80% <25%or>85% –
Lymphocytes# <0.8×10³/Lor >5.0×10³/L(adults) and<0.8×10³/Lor >7.0×10³/L (childrenaged≤12 years)
<0.8×10³/Lor >5.0×10³/L(adults) and<0.8×10³/Lor >7.0×10³/L (childrenaged≤12 years)
<0.5×10³/Lor >5.0×10³/L(adults) and<0.5×10³/Lor >7.0×10³/L (childrenaged≤12 years)
>5.0×10³/L(adults) and>7.0×10³/L (childrenaged≤12 years)
Lymphocytes% <20%or>50% <12%or>60% <8%or>70% – Monocytes# <0.1×10³/Lor
>1.3×10³/L(adults) and<0.1×10³/
Lor >2.0×10³/
L (childrenaged≤12 years)
<0.1×10³/Lor >1.3×10³/L(adults) and<0.1×10³/
Lor >2.0×10³/
L (childrenaged≤12 years)
<0.1×10³/Lor >1.5×10³/L(adults) and<0.1×10³/
L >2.0×10³/
L (childrenaged≤12 years)
>1.5×10³/L(adults) and>3.0×10³/L (childrenaged≤12 years)
Monocytes% <1%or>12% <1%or>16% <1%or>20% – Eosinophils# >2.0×10³/
L >2.5×10³/L >2.5×10³/L >2.0×10³/L
Eosinophils% >20% >25% >30% –
Basophils# >0.3×10³/L >0.3×10³/L >0.5×10³/L >0.5×10³/L
Basophils% >2% >2% ≥3% –
Platelets <100×103/Lor >600×103/L
<100×103/Lor >800×103/L
<90×103/Lor >1000×103/L
<100×103/Lor >1000×103/L
MPV >12.0fL >12.5fL ≥13.0fL ≥12.5fL
Qualitativescreeningcriteria
Suspectflags Immaturegranulocytes? Leftshift? Atypicallymphocytes? Abnormallymphocytes/blasts? Blasts? Nucleatedredbloodcells?
Fragments?(schistocytes)
DimorphicRBCpopulation(erythrocytepopulationheterogeneousinsize) LyseresistantRBC
Plateletclumps?(generatedbyscattergram) Plateletclumps(S)?(generatedbytheimpedancechannel)
Turbidity/hemoglobininterference?Hemoglobindefect?Spurioushemoglobinmeasurement
ALL MBSRifnewborn
(*)and(----) Thesesymbolsbesidethecountsonthereadoutindicatethatautomatedcountsarenotreliableornot availableforthesampleinquestion,respectively
ISLH:InternationalSocietyforLaboratoryHematology;MCV:meancorpuscularvolume;MCHC:meancorpuscularhemoglobinconcentration; RDW-CV:redbloodcelldistributionwidthcoefficientofvariation;RDW-SD:redbloodcelldistributionwidthstandarddeviation;RBC:redblood cells;WBC:whitebloodcells;MPV:meanplateletvolume;MBSR:manualbloodsmearreview.
Specificity (%)=
TNTN+FP
×100;
Negativepredictivevalue (%)=
TNTN+FN
×100;
Positivepredictivevalue (%)=
TPTP+FP
×100;
Efficiency (%)=
TP+TNTP+FP+FN+TN
×100.
EfficiencywasdefinedasthecapabilityofasetofSCto dis-criminatecorrectlythesamplesi.e.,thetrue-positiveresults andtrue-negativeresults.Therateofmicroscopicreviewswas computedas(%)=([TP+FP]/[TP+FP+FN+TN]).Comparisons ofreceiveroperatingcharacteristic(ROC)curveswerecarried out toverifyvariationsinthe sensitivityand falsepositive fraction(1−specificity)ofdifferentsetsofSC usingoverall cut-offvalues.TheYoudenindex(J)wascalculatedusingthe formula:Y=sensitivity+(specificity−1).TheYouden’sJ statis-tic,afunctionofbothsensitivityandspecificity,hasvalues rangingfrom−1to1,andhasazerovaluewhenadiagnostic testgivesthesameproportionofpositiveresultsforgroups withandwithoutthedisease,i.e.thetestisuseless.Avalue of1indicatesthattherearenofalse-positiveresultsor false-negativeresults,i.e.thetestisperfect.Theindexgivesequal weighttofalsepositiveandfalsenegativevalues,soalltests withthesamevalueoftheindexhavethesameproportionof totalmisclassifiedresults.26,27
Statisticalanalysis
AllstatisticalanalyseswereperformedusingtheStatistica8.0 (StatSoftInc.,Tulsa,OK,USA)andMEDCALC® version7.3.0.1 (MedCalcSoftware,Mariakerke,Belgium)computerprograms. Thechi-squaretest(2)wasperformedtoverifydifferences ineachmeasureofdiagnosticaccuracyandagreement eval-uatedamongallsetsofSC.Additionally,Fisher’sexacttest, performedusing2×2tables,wasusedtocomparethe sensi-tivity,specificity,efficiency,rateofmicroscopicreviewsaswell asthe rates offalse-negative results,false-positiveresults, true-negativeresultsand true-positive resultsamongpairs ofsetsofSC.Ap-valueof≤0.05wasconsideredstatistically significant.
Results
Theanalyzedsamplesdisplayedhighamplitudesinthe inter-valsofallhematologicparametersusedasquantitativeSC, reflectingheterogeneityofthesampleatthehematology lab-oratoryofHC-UFPR.Ofthe1977samplesanalyzed,2.5%had hemoglobinlevelsbetween2.5g/dLand7.1g/dLandanother 2.5%hadhemoglobinlevelsbetween16.3g/dLand20.0g/dL. Regardingleukocyte counts,2.5%ofsampleshadcountsof 0.01×10³/Lto 1.44×10³/Land another 2.5% had counts between 22.4×10³/L and 107.8×10³/L. For the platelet counts,2.5%ofallsampleshadvaluesbetween1×103/Land 22.0×10³/
Landanother2.5%hadcountsof608×103/Lto
2110×103/
L.
Atotalof491samples(24.84%) wereconsideredpositive forthePSF(Table1)and1486(75.16%)wereconsidered nega-tive.Amongthepositivesamples,morphologicalalterations were observedin 195(39.71%) inthe red blood cell series, 217(44.19%) inthewhiteblood cellseries, seven(1.42%)in platelets,four (0.81%)inred bloodcell seriesandplatelets, 64(13.03%)intheredandwhitebloodcellseries,two(0.41%) inwhitebloodcellseriesandplateletsandtwo(0.41%)had changesinallthethreeseries.Theautomatedcountof retic-ulocyteswasperformedin191samples(onlyuponmedical request).
The three most common, abnormal red blood cell series findings were anisocytosis ≥2+ (123 occurrences), the sum of changes [(anisocytosis ≥1+)+(poikilocytosis ≥1+)+(erythrocyte form ≥1+)+(change of color ≥1+)] (102 occurrences)and dacryocytes≥1+ (66occurrences).For the whitebloodcellseries,thethreemostcommonfindingswere band neutrophils ≥15% (188 occurrences),myelocytes ≥1% (115 occurrences), and Döhlebodies (74 occurrences). Itis noteworthy that blasts were found in 16 samples. Platelet aggregates(tenoccurrences)weremorefrequentthangiant platelets(fouroccurrences).
ThequantitativeSCwhichshowedthehighestratesof indi-cationforMBSRinGroups1,2,3and4werelymphocytes<20% or>50%(38.89%),neutrophils<35%or>80%(19.92%), leuko-cytes<3.2×10³/Lor>20.0×103/L(11.68%)andleukocytes <4.0×10³/Lor>30.0×103/L(13.7%),respectively.
In Group 3, lower limits of screening for leukocytes (<3.2×10³/
L)andplatelets(<90.0×10³/L)wereused.Unlike
theSCofGroup4,therelativecountsofleukocytesandthe redbloodcelldistributionwidthstandarddeviation(RDW-SD) wereusedasSCinGroups1–3.Thecut-offpointsforplatelets rangedfrom>600×103/L(Group1)to>1000×103/L(Group 3 and Group 4). The evaluation results of SC among the four sets using the new PSF of HC-UFPR are shown in
Table3.
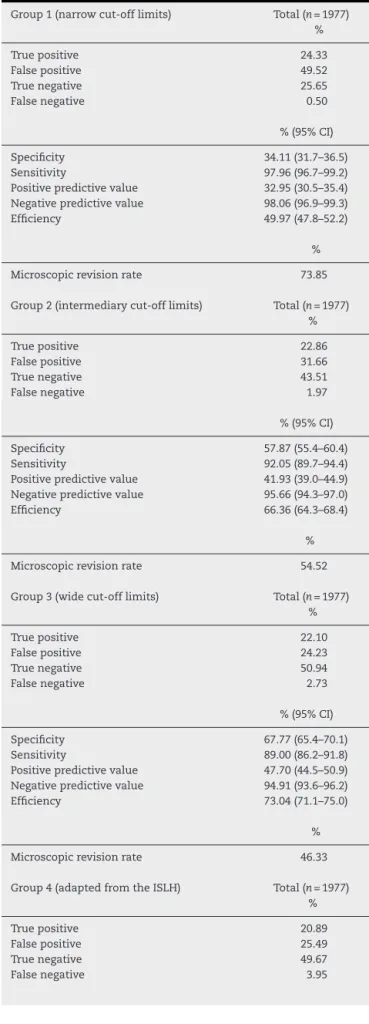
Table3–Truthtableofthesetsofscreeningcriteria.
Group1(narrowcut-offlimits) Total(n=1977) %
Truepositive 24.33
Falsepositive 49.52
Truenegative 25.65
Falsenegative 0.50
%(95%CI)
Specificity 34.11(31.7–36.5)
Sensitivity 97.96(96.7–99.2)
Positivepredictivevalue 32.95(30.5–35.4) Negativepredictivevalue 98.06(96.9–99.3)
Efficiency 49.97(47.8–52.2)
%
Microscopicrevisionrate 73.85
Group2(intermediarycut-offlimits) Total(n=1977) %
Truepositive 22.86
Falsepositive 31.66
Truenegative 43.51
Falsenegative 1.97
%(95%CI)
Specificity 57.87(55.4–60.4)
Sensitivity 92.05(89.7–94.4)
Positivepredictivevalue 41.93(39.0–44.9) Negativepredictivevalue 95.66(94.3–97.0)
Efficiency 66.36(64.3–68.4)
%
Microscopicrevisionrate 54.52
Group3(widecut-offlimits) Total(n=1977) %
Truepositive 22.10
Falsepositive 24.23
Truenegative 50.94
Falsenegative 2.73
%(95%CI)
Specificity 67.77(65.4–70.1)
Sensitivity 89.00(86.2–91.8)
Positivepredictivevalue 47.70(44.5–50.9) Negativepredictivevalue 94.91(93.6–96.2)
Efficiency 73.04(71.1–75.0)
%
Microscopicrevisionrate 46.33
Group4(adaptedfromtheISLH) Total(n=1977) %
Truepositive 20.89
Falsepositive 25.49
Truenegative 49.67
Falsenegative 3.95
Table3–(Continued)
%(95%CI)
Specificity 66.08(63.7–68.5)
Sensitivity 84.11(80.9–87.3)
Positivepredictivevalue 45.03(41.8–48.3) Negativepredictivevalue 92.64(91.1–94.2)
Efficiency 70.56(68.6–72.6)
Truepositive %
Falsepositive 46.38
95%CI:two-sided95percentconfidenceinterval;ISLH: Interna-tionalSocietyforLaboratoryHematology.
predictivevalue(46.99%)byclassifyingthetrue-positive
sam-plesmoreaccurately.
In Groups 1, 2, 3 and 4, the rates of false-negative
resultsininpatientsamples(0.30%,1.97%,3.19%and5.63%,
respectively) were not different to the rates of
false-negative results in all samples (0.50% – p-value=0.7413;
1.97% – p-value=1.0000; 2.73% –p-value=0.5885and 3.95%
–p-value=0.1011,respectively).Likewise,the ratesof
false-negativeresultsinoutpatientsamples(0.60%; 1.96%;2.50%
and3.18%,respectively)werenotdifferentfromtheratesof
false-negativeresultsinallsamples(0.50%–p-value=0.8104;
1.97% – p-value=1.0000; 2.73% –p-value=0.7402and 3.95%
– p-value=0.2575,respectively). However, the rate of
false-negativeresultsinGroup4(5.63%)wastheonlyoneamongall
thesetsofSCthatshowedasignificantincreaseininpatients
comparedtooutpatients(3.18%–p-value=0.0150).
Theratesoffalse-positiveinpatientsamplesinGroup2and
Group3(38.05%;30.13%,respectively)werehigherthan the
totalratesoffalse-positiveresults(31.66%–p-value=0.0361
and24.23%–p-value=0.0308,respectively).Withthe
excep-tionofGroup1,theratesoffalse-positiveresultsininpatients
(38.05%,30.13%and29.68%,forGroups2,3and4,respectively)
werehigherthan thoseobservedintheoutpatientsamples
(28.33%–p-value=0.0020;21.66%–p-value=0.0017and23.78%
–p-value=0.0320,respectively).
Importantly,theratesofmicroscopicreviewsininpatient
samples of Groups 1, 2, 3 and 4 (90.25%, 73.97%, 64.84%
and61.94%,respectively)weresignificantlyhigherthanthose
foundinoutpatientsamples(63.86%–p-value<0.0001;44.46%
–p-value<0.0001;37.27%–p-value<0.0001and38.78%–p
-value<0.0001,respectively).
The rates of microscopic reviewsdecreased in Group 2
(54.52%) and Group3(46.33),andthe rateoffalse-negative
resultswas≤3%inboth.WiththeexceptionofGroup4,all
theothergroupsachievedratesoffalse-negativeresults<3%
andstatisticallydifferentfromtherateintheSCofGroup4
(p-value<0.05).However,onlytheSCofGroup1were
capa-bleofscreeningasamplewith2%plasmacellsinapatient
withmultiplemyeloma(confirmedinthispatient’smedical
records).
Group 1
Group 2
Group 3
Group 4
0.3207 0.659
0.4992 0.750
0.5677 0.784 0.751 0.5019
Youden
Index
Area under the ROC
100 - Specificity
Sensitivity
100
100 90
80
80 70
60
60 50
40
40 30
20
20 10
0 0
Curve
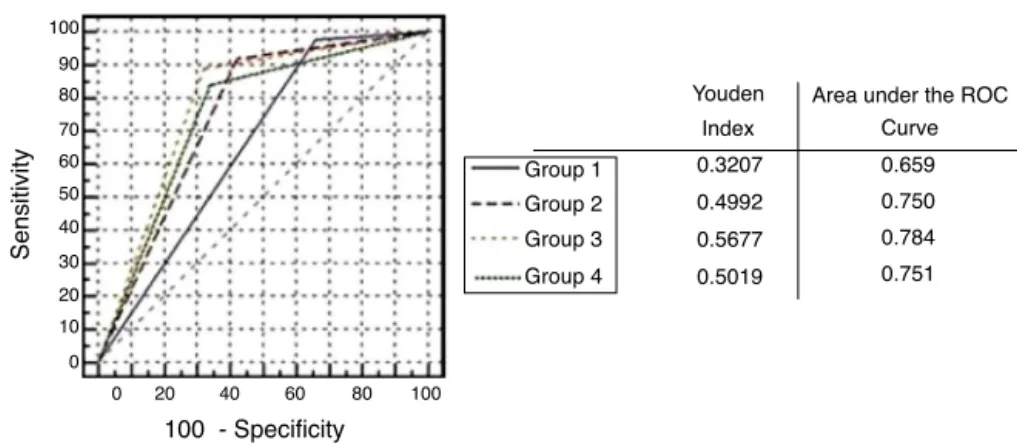
Figure1–Comparisonofreceiveroperatingcharacteristic(ROC)curvesofthescreeningcriteriasetsofGroups1–4.
Note1:100−specificity=falsepositiverate.
Note2:FourROCcurveswithdifferentvaluesoftheareaunderdeROCcurveareillustrated.Aperfecttesthasanareaunderde ROCcurveof1.Thechanceleveldiagonal(blackdashedlinesegmentfrom0(x),0(y)to100(x),100(y))hasanareaunderde ROCcurveof0.5.TheROCcurvesofGroups1–4demonstrateddifferentabilitiestodistinguishbetweensampleswithand sampleswithoutpositivesmearfindings(coloreddashedandsolidlines)andliebetweenthesetwoextremes.Group3withthe greatestareaundertheROCcurvehasthebestoveralldiagnosticperformance.
Note3:Group3hadthehighestYoudenindexandgavetheleastproportionofmisclassifiedresults,whereasGroup1hadthe lowestYoudenindexandgavethehighestproportionofmisclassifiedresults.
Note4:TheareaundertheROCcurveforGroups2and4arealmostidentical.Inthehighfalsepositiveraterange(orhigh sensitivityrange)Group2isbetterthanGroup4,whereasinthelowfalsepositiveraterange(orlowsensitivityrange)Group4 isbetterthanGroup2.
Note5:Prevalenceofpositivesamples:24.84%(491samplesin1977).
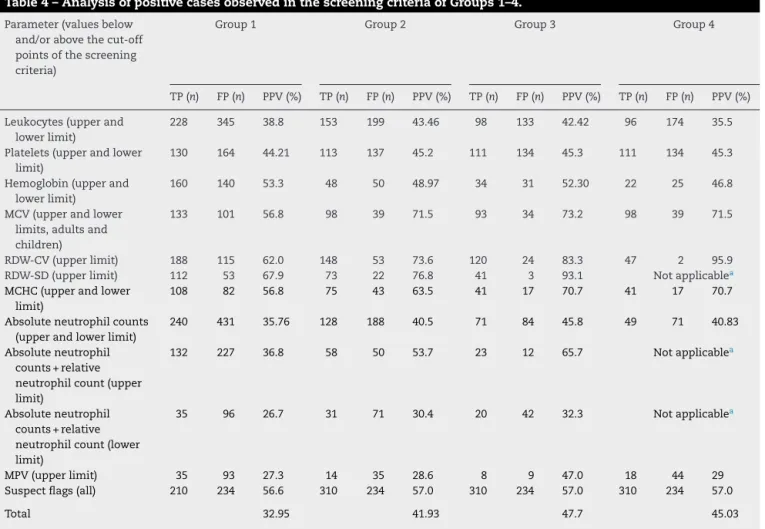
Intheanalysisofpositivecases(true-positiveresultsand false-positiveresults)(Table4),thequalitativeSCrelatedto suspectflagsdisplayedagoodpositivepredictivevalue.The RDW-CVandtheRDW-SDshowedincreasedpositive predic-tivevaluesasthecut-offpointswere raised.Theleukocyte countcut-offpointoftheSCinGroup1showedthelowest positivepredictivevaluewhileGroup2showedthehighest positivepredictivevalue.ThesetofSCinGroup3best identi-fiedthetrue-positivesamples,withapositivepredictivevalue of47.7%.
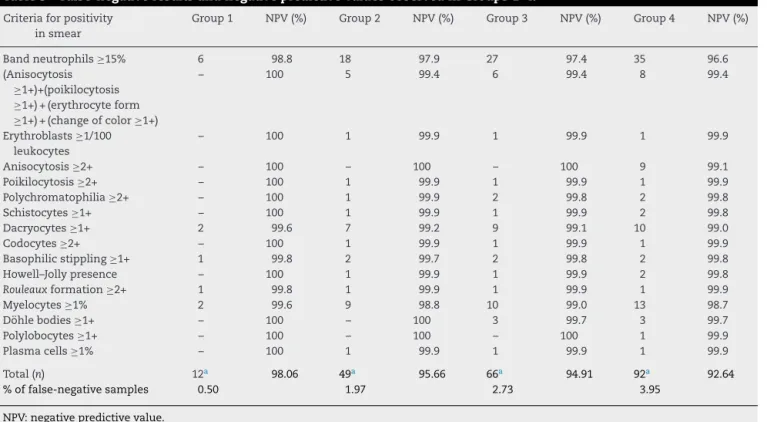
Table5providesabreakdownofthefalse-negativeresults foundinGroups1–4.Themorphologicalchangesthatledto thehighestnumber offalse-negativeresultsamongallthe evaluatedSC wereband neutrophils≥15%,and myelocytes ≥1%.InGroup3,thenegativepredictivevaluefoundforband neutrophilsof≥15%demonstratedthatin97.4%ofthecases thatdidnotindicatethepresenceofthismorphological alter-ation;the samplesactuallycontained noband neutrophils ≥15%.
InGroup3,ofthe54sampleswithfalse-negativeresults, therewere27casesofleftshift≥15%ofbandneutrophils,ten withmyelocytes≥1%,25withchangesinredbloodcellseries, threecaseswiththepresenceofDöhlebodiesandonecase withplasmacells≥1%.Therewere54sampleswith erythrob-lasts≥1/100leukocyteswithinthe1977samplesanalyzed,and onlyonesamplewasnotflaggedbytheSCofGroups2–4.There werenofalse-negativeresultsformorphologicalchangesin platelets.NocasesofblastswerelostbythefourSC.
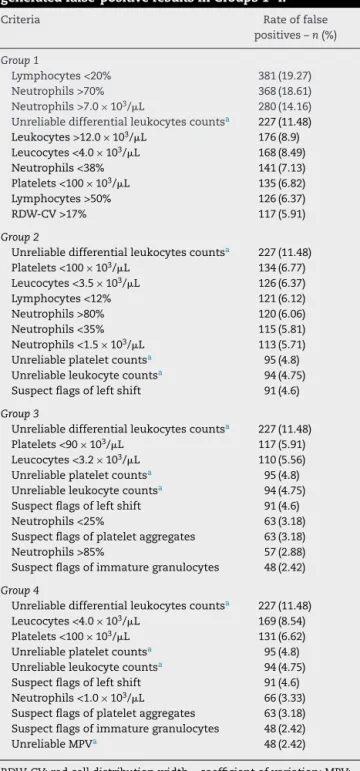
Table6showsthetoptensingleSCthatgenerated false-positiveresultsinGroups1–4.
The screening criterion that caused mostfalse-positive results in Groups 2–4 was unreliable differential leukocyte counts(227occurrences).Thesecondmajorcause of false-positive results in Groups 2, 3 and 4 was platelet counts <100×103/L, platelet counts <90×103/L and leukocyte counts<4.0×10³/L,respectively.
Discussion
InstudiesthathaveproposedSCforMBSR,challengesexist inrespecttostandardizationoftheSCand PSF,sinceboth arenotcompletelyapplicableinalllaboratories.Thus,each hematologylaboratoryshoulddevelopitsownbetter-adapted SCforMBSRtocapturesampleswithmorphologicalfindings ofclinicalsignificance(PSF),whileaccountingforthe labora-tory’speculiarities,aswellastheknowledgeandexperience ofthemedicalteam.1,2,15,16,19,28–30AsrecommendedbyFroom
et al.,31 SC specifically for childrenagedunder 15 months
couldalsobeestablished,astheseauthorsobservedahigh rateoffalse-positiveresultsduetosampleswithabsolute lym-phocytecountsabove7.0×103/L.AsdemonstratedbyTseng etal.,32studiescouldbeconductedthroughROCcurve
Table4–AnalysisofpositivecasesobservedinthescreeningcriteriaofGroups1–4.
Parameter(valuesbelow and/orabovethecut-off pointsofthescreening criteria)
Group1 Group2 Group3 Group4
TP(n) FP(n) PPV(%) TP(n) FP(n) PPV(%) TP(n) FP(n) PPV(%) TP(n) FP(n) PPV(%)
Leukocytes(upperand lowerlimit)
228 345 38.8 153 199 43.46 98 133 42.42 96 174 35.5
Platelets(upperandlower limit)
130 164 44.21 113 137 45.2 111 134 45.3 111 134 45.3
Hemoglobin(upperand lowerlimit)
160 140 53.3 48 50 48.97 34 31 52.30 22 25 46.8
MCV(upperandlower limits,adultsand children)
133 101 56.8 98 39 71.5 93 34 73.2 98 39 71.5
RDW-CV(upperlimit) 188 115 62.0 148 53 73.6 120 24 83.3 47 2 95.9 RDW-SD(upperlimit) 112 53 67.9 73 22 76.8 41 3 93.1 Notapplicablea MCHC(upperandlower
limit)
108 82 56.8 75 43 63.5 41 17 70.7 41 17 70.7
Absoluteneutrophilcounts (upperandlowerlimit)
240 431 35.76 128 188 40.5 71 84 45.8 49 71 40.83
Absoluteneutrophil counts+relative neutrophilcount(upper limit)
132 227 36.8 58 50 53.7 23 12 65.7 Notapplicablea
Absoluteneutrophil counts+relative neutrophilcount(lower limit)
35 96 26.7 31 71 30.4 20 42 32.3 Notapplicablea
MPV(upperlimit) 35 93 27.3 14 35 28.6 8 9 47.0 18 44 29
Suspectflags(all) 210 234 56.6 310 234 57.0 310 234 57.0 310 234 57.0
Total 32.95 41.93 47.7 45.03
TP:truepositive;FP:falsepositive;PPV:positivepredictivevalue;MCV:meancorpuscularvolume;RDW-CV:redcelldistributionwidth– coefficientofvariation;RDW-SD:redbloodcelldistributionwidthstandarddeviation;MPV:meanplateletvolume;MCHC:meancorpuscular hemoglobinconcentration.
a RDW-SDandrelativeneutrophilcountsarenotincludedinthescreeningcriteriaofGroup4.
showedthatvariationscanarisewiththeuseofSCforMBSR, whicharedependentonthetypeofhospital,thehematology analyzerusedandgeographicallocationofthelaboratory.33
AstudyoftheQ-Probeprogram,reportedthatthelargerthe hospital,thegreaterthepercentageofMBSRwillbe.23ThePSF
shouldencompassclinicallysignificantmorphological alter-ations,thusestablishingaminimumthresholdofinformation whichmustbedescribedinCBCsasperlocalconsensus.The PSFofHC-UFPRhavetheirrelevantthresholdvalueseither equaltoorlessthanthePSFofISLH.16
Twobasicprinciplesshouldbefollowedwhendeveloping SCforMBSR:(1)reductionintherateoffalse-negativeresults toan acceptable value.Groups 1–3 obtainedfalse-negative ratesbelowthelimitof3%specifiedinthis study.Group3 displayedamarginallyhigherefficiencycomparedtoGroup4 andbothweremoreefficientthanGroups1and2.However, therateoffalse-negativeresultsinGroup3wassignificantly lowerthanthatinGroup4(p-value=0.0414).Moreover,Kim etal.foundafalse-negativerateandspecificityof9.7%and 77.1%,respectively,usingtheSCofISLHtocapturesamples withthePSFofISLH.34
In Groups 1–3, the rates of false-negative results in inpatientsweresimilartothoseobservedinoutpatients, sug-gestingthatthesestudiescanbeusedforbothprofiles,while
thoseobservedinGroup4weresignificantlyhigherandthus, constituteaconstraintonthesafetyofhospitalizedpatients. However,Pratumvinitetal.evaluatedtheirownoptimizedSC tocapturePSFoftheISLHanddidnotobservethisdifference inpatientprofile.17
It isimportantthat no false-negative resultreflects the presence ofpreviously undetected severe hematologic dis-eases, although false-negative rates of 3%24 to 5%16 are
acceptable.Tofurtherexpandondetectingtheundiagnosed hematologicdiseases,eachinstitutionshouldperformMBSR inpatientswithincertainhospitalizationunits,suchasthe hematologyunit,evenatthecostofanincreaseintherateof microscopicreviews.
Table5–False-negativeresultsandnegativepredictivevaluesobservedinGroups1–4.
Criteriaforpositivity insmear
Group1 NPV(%) Group2 NPV(%) Group3 NPV(%) Group4 NPV(%)
Bandneutrophils≥15% 6 98.8 18 97.9 27 97.4 35 96.6
(Anisocytosis ≥1+)+(poikilocytosis ≥1+)+(erythrocyteform ≥1+)+(changeofcolor≥1+)
– 100 5 99.4 6 99.4 8 99.4
Erythroblasts≥1/100 leukocytes
– 100 1 99.9 1 99.9 1 99.9
Anisocytosis≥2+ – 100 – 100 – 100 9 99.1
Poikilocytosis≥2+ – 100 1 99.9 1 99.9 1 99.9
Polychromatophilia≥2+ – 100 1 99.9 2 99.8 2 99.8
Schistocytes≥1+ – 100 1 99.9 1 99.9 2 99.8
Dacryocytes≥1+ 2 99.6 7 99.2 9 99.1 10 99.0
Codocytes≥2+ – 100 1 99.9 1 99.9 1 99.9
Basophilicstippling≥1+ 1 99.8 2 99.7 2 99.8 2 99.8
Howell–Jollypresence – 100 1 99.9 1 99.9 2 99.8
Rouleauxformation≥2+ 1 99.8 1 99.9 1 99.9 1 99.9
Myelocytes≥1% 2 99.6 9 98.8 10 99.0 13 98.7
Döhlebodies≥1+ – 100 – 100 3 99.7 3 99.7
Polylobocytes≥1+ – 100 – 100 – 100 1 99.9
Plasmacells≥1% – 100 1 99.9 1 99.9 1 99.9
Total(n) 12a 98.06 49a 95.66 66a 94.91 92a 92.64
%offalse-negativesamples 0.50 1.97 2.73 3.95
NPV:negativepredictivevalue.
a Somesamplesshowedmorethanonepositivesmearfinding.
bloodcellpercentageisand(v)recordingerrors.2Forinstance,
unlikethisstudy,Hyunetal.considerveryhighcountsas clini-callysignificantsuchas,promyelocytes≥3%,neutrophilsand bandneutrophils≥20%,atypicallymphocytes≥7%and ery-throblasts≥2or3/100leukocytes.28 Incontrast,Joneset al.
considerimmaturegranulocytes≥3%,atypicallymphocytes ≥10% and erythroblasts ≥2/100 leukocytes as significant,35
whichshowsthediversityofPSFineachlaboratory.
Anotherimportantfactor istofind SCthat classifyless samplesasfalsepositiveinagreementwiththesecond prin-ciple,whichistoreducetherateofmicroscopicreviewstoan acceptablevalue.InallGroups,thetotalratesofmicroscopic reviewsweredirectlyinfluencedbylimitsestablishedforthe SC.Group1hadthehighesttotalrateofmicroscopicreviews andthelowestrateoffalse-negativeresultscomparedtoother SC(0.5%,p-value<0.001).AlthoughahighMBSRrateissafe forthepatients,itcanbeaprobleminrespecttothedelayof resultsforlaboratoriesthatdonothaveasufficientnumberof experiencedprofessionalstoperformMBSR.Group1isagood exampleofhowthelackofSCoptimizationmayresultinan unnecessarylabor-intensiveworkloadduetothehighrateof microscopicreviews.
Thepre-setlimitof<50%ontherateofmicroscopicreviews wasobservedinGroup3and Group4;however,thelowest rateofmicroscopicreviewsaswellasincreasedefficiencyand safetyobservedinGroup3madethissetofSCmore accept-able.PreviousstudiesbyCuietal.24andPratumvinitetal.17
obtainedlowerratesofmicroscopicreviewsthanthosefound inGroup3.However,wechosenottomakeadditional adjust-ments tothe SC inGroup 3to furtherreducethe rates of microscopicreviews,sincethiscouldincreasetherateof false-negativeresultsabovethesafetylimit.Therefore,weconclude
thattheSCofGroup3constitutethelimitofautomationfor thedirectreleaseofCBCresultsinanefficientandsafe man-nerattheHospitaldeClínicasofUFPR.
Throughtheanalysisoffalse-positiveresults,onecanalter orremovesomeSCtoreducetherateofmicroscopicreviews, ashighratesoverloadtheprofessionalscausingdelaysinthe releaseofresults.Therateofmicroscopicreviewsof46.33% obtainedinGroup3iswithinthecapacityofthehematology laboratoryatHC-UFPR.16,17,24,34
ParameterssuchasMCV,RDW-CV,RDW-SD,MCHC, differ-entialcountsofneutrophilsandsuspectflagsdisplayedthe highestpositivepredictivevalues.Thus,appropriate adjust-mentstothecut-offlimitsoftheseparameterscanincrease theabilitytodetectabnormalsamples.Ontheotherhand,low leukocyte andplateletcounts,aswellastheMPVcaptured sampleswithoutmorphologicalabnormalitiesproducingthe lowestpositivepredictivevalues.Notably,theseresultsreflect the profiles of patientsanalyzed routinely inthe hematol-ogylaboratory(quaternaryhospital).Kimetal.demonstrated thatSCwiththebestpositivepredictivevaluesinatertiary hospitalinKoreawere:hemoglobin,MCV,RDWandsuspect flags.34Likewise,Pratumvinitetal.demonstratedthattherate
offalse-positiveresultswashigherinhospitalizedpatients thaninoutpatients.17
Table6–Toptensinglescreeningcriteriawhich generatedfalse-positiveresultsinGroups1–4.
Criteria Rateoffalse
positives–n(%)
Group1
Lymphocytes<20% 381(19.27) Neutrophils>70% 368(18.61) Neutrophils>7.0×10³/L 280(14.16) Unreliabledifferentialleukocytescountsa 227(11.48) Leukocytes>12.0×10³/L 176(8.9) Leucocytes<4.0×10³/L 168(8.49)
Neutrophils<38% 141(7.13)
Platelets<100×103/
L 135(6.82)
Lymphocytes>50% 126(6.37)
RDW-CV>17% 117(5.91)
Group2
Unreliabledifferentialleukocytescountsa 227(11.48) Platelets<100×103/L 134(6.77) Leucocytes<3.5×10³/L 126(6.37)
Lymphocytes<12% 121(6.12)
Neutrophils>80% 120(6.06)
Neutrophils<35% 115(5.81)
Neutrophils<1.5×10³/
L 113(5.71)
Unreliableplateletcountsa 95(4.8) Unreliableleukocytecountsa 94(4.75) Suspectflagsofleftshift 91(4.6)
Group3
Unreliabledifferentialleukocytescountsa 227(11.48) Platelets<90×103/L 117(5.91) Leucocytes<3.2×10³/
L 110(5.56)
Unreliableplateletcountsa 95(4.8) Unreliableleukocytecountsa 94(4.75) Suspectflagsofleftshift 91(4.6)
Neutrophils<25% 63(3.18)
Suspectflagsofplateletaggregates 63(3.18)
Neutrophils>85% 57(2.88)
Suspectflagsofimmaturegranulocytes 48(2.42)
Group4
Unreliabledifferentialleukocytescountsa 227(11.48) Leucocytes<4.0×10³/
L 169(8.54)
Platelets<100×103/
L 131(6.62)
Unreliableplateletcountsa 95(4.8) Unreliableleukocytecountsa 94(4.75) Suspectflagsofleftshift 91(4.6) Neutrophils<1.0×10³/L 66(3.33) Suspectflagsofplateletaggregates 63(3.18) Suspectflagsofimmaturegranulocytes 48(2.42)
UnreliableMPVa 48(2.42)
RDW-CV:redcelldistributionwidth–coefficientofvariation;MPV: meanplateletvolume.
a Screeningcriterionthatcausedmostfalse-positiveresults.
the least misclassified results (false-positive results+ false-negativeresults); however, oncertain occasions, it may be importanttochoosethetestwithfewerfalse-negativeresults, i.e.,themostsensitive.Ahighsensitivityoccursduetothe highnumberofmicroscopicreviews(Group1),whichmaynot beinteresting,sinceitreducestheamountofcorrectly clas-sifiedsamples(efficiency).Importantly,thehighefficiencyof Group3wasobtainedattheexpenseofa2.73%false-negative rate,whichisstilllowerthanthevaluessuggestedbyBarnes etal.16(<5%)andbyCuietal.24(<3%);thus,conveyingmore
reliabilityoftheCBCresultsreleaseddirectlyafterthe appli-cationofthissetofSC.
SCforMBSRwithahighsensitivitymay bebeneficialin laboratoriesthatmostlyattendoutpatientsforscreening pur-poses,whileSCforMBSRwithhighspecificitymaybemore usefulinlaboratoriesthatattendinpatients,inorderto pro-vide faster and more efficientcare. Group 3 displayed the highestspecificity(67.77%),whichcansignificantlyreducethe delayofresultsforthepatientstreatedatHC-UFPR,asitallows abetterclassificationoftrue-negativesamples(50.94%).
Importantly, for the performance evaluation of SC for MBSR, one should not only seek higher sensitivity speci-ficity, and efficiency, but also maintain a balance between notoverloadingwithunnecessaryMBSRandfailuretoreview microscopicsamplescontainingclinicallyrelevant morpho-logicalchanges.Therefore,therateoffalse-negativeresults mustbemaintainedwithinthelimitsrecommendedbythe laboratory.1
Inanattempttoreducethemicroscopicreviewsfoundin this study,someactionscanbeadoptedforfurtherstudies suchas,changingthePSFofbandneutrophilsfrom≥15%to ≥20%orevenremovingitfromthePSF,astheInternational Council for Standardization in Hematology (ICSH) recom-mendsthatbandneutrophilsshouldbesegmentedinMDLC duetowideinter-observervariationsintheirclassification.36
Thiswouldallowelevationoftheleukocyte andneutrophil valuesinSC.Onecouldalsodeployimprovementsinthe lab-oratory informationsystemstoenabledeployment ofdelta checkrulestoincreasethequality,safetyandproductivityof results.
ThedeploymentofSCforMBSRisaimedtoensurethat satisfactory performancein productivity brings benefitsto patients,physiciansandthelaboratoryitselfbyreducingcosts andincreasingthequalityofexams.TheapplicationofGroup 3 SC in our hematology laboratory enables approximately 120,000 CBCto beconductedannually,with approximately 64,400tobereleaseddirectly, allowingeachprofessionalto betterutilizetheirtimeinthemicroscopicanalysisofdifficult cases.
Thefollowinglimitationsofthepresentstudyshouldbe considered:(i)thisstudywasnotblinded;theobservershad accesstoreportsofhematologyanalyzers,whichmayhave ledtoover-reports ofcertainmorphologicalchanges, espe-ciallythosemarkedbysuspectflags. (ii)TheMBSRand the MDLCwere performedbyonlyoneobserverforeachblood smear.Ononehand,thereviewbytwoobserversina double-blindstudycouldgivemorecredibilitytotheresults;however, itwouldnegativelyimpactthepracticalityofimplementation andperiodicevaluationsofSCforMBSR.Notably,Barnesetal. recommendthatMBSRbeperformedbyasingleexperienced observerinordertoprovideconsistentresults.16Inthisstudy,
days,andthus,unusualchangesthatmayconstitutethePSF werenotobservedduringthisstudy.Inordertoassessthese unusualPSF,furtherstudiesareneededwithalongersample collectionperiod.
Automationinthehematology field hasgrown substan-tiallyinrecentyears,andmorefunctionsareavailableinthe hematologyanalyzerssuchas,self-checkofresults,easeof maintenanceandsimplifiedinterfaceprotocols.These func-tionscontributetoareductioninthehumaninteractionwith analyzerstofacilitatetheworkflow anddecrease thedelay ofresults.Hence,humaneffortscanbedirectedtowardthe verificationofresultsofdifficultMBSRcases,verificationand analysisoftheanalyticalperformanceofthehematology ana-lyzers,andtheevaluationandestablishmentofSCforMBSR throughsurveysand dailyinteractionsbetween profession-alsinthelab,medicalteamand thehematologyanalyzers. All these factors aim to ensure appropriate, relevant, and highqualityresultsreleasedinatimelymannerfor decision-makingandappropriatemedicalmanagement.
Conclusions
The SC for MBSR of Groups 1–4 can be used in a hema-tologylaboratoryand thechosensetofSCdependsonthe needtoincreaseefficiency,thesafetyofpatients,aswellas theavailabilityofexpertlytrainedpersonneltoperformthe MBSR.Group3wasthemostappropriateforthehematology laboratoryofUFPR,displayingthebestrelationshipbetween safety(FN≤3%)andefficacyforestimatingthelimitsofthe automationofCBCs.Thisstudyreinforcestheimportanceof heterogeneityintherelevantpopulation,suchthattheSCfor MBSRmeetthecharacteristicsofdifferentcontextsinwhich hematologicaldeterminationsareperformed.
Conflicts
of
interest
Theauthorsdeclarenoconflictsofinterest.
r
e
f
e
r
e
n
c
e
s
1. GulatiGL,AlomariM,KocherW,SchwartingR.Criteriafor bloodsmearreview.LabMed.2002;33(5):374–7.
2. PierreRV.Peripheralbloodfilmreview:thedemiseofthe eyecountleukocytedifferential.ClinLabMed.
2002;22(1):279–97.
3. PierreRV.Redcellmorphologyandtheperipheralbloodfilm. ClinLabMed.2002;22(1):25–61.
4. BainBJ.Diagnosisfromthebloodsmear.NEnglJMed. 2005;353(5):498–507.
5. GulatiGL,SongJ,FloreaAD,GongJ.Purposeandcriteriafor bloodsmearscan,bloodsmearexamination,andblood smearreview.AnnLabMed.2013;33(1):1–7.
6. BainBJ.Bloodcells:apracticalguide.5thed.Oxford: Wiley-Blackwell;2015,491p.
7. WardPC.TheCBCattheturnofthemillennium:anoverview. ClinChem.2000;46(8p2):1215–20.
8. HouwenB.Thedifferentialcellcount.LabHematol. 2001;7(2):89–100.
9.RuzickaK,VeitlM,Thalhammer-ScherrerR,SchwarzingerI. ThenewhematologyanalyzerSysmexXE-2100:performance evaluationofanovelwhitebloodcelldifferentialtechnology. ArchPatholLabMed.2001;125(3):391–6.
10.StammingerG,AuchD,DiemH,SinhaP.Performanceofthe XE-2100leucocytedifferential.ClinLabHaematol.
2002;24(5):271–80.
11.HurM,ChoJH,KimH,HongMH,MoonHW,YunYM,etal. Optimizationoflaboratoryworkflowinclinicalhematology laboratorywithreducedmanualslidereview:comparison betweenSysmexXE-2100andABXPentraDX120.IntJLab Hematol.2011;33(4):434–40.
12.BriggsC,LongairI,KumarP,SinghD,MachinSJ.Performance evaluationoftheSysmexhaematologyXNmodularsystem.J ClinPathol.2012;65(11):1024–30.
13.CorberandJX,LaharraguePF,FillolaGM.Validationcriteriaof theSysmexNE-8000TMresults.Personalexperienceinthe
computerizedhaematologylaboratoryofaFrenchteaching hospital.SysmexJInt.1992;2(2):103–10.
14.ChapmanM.Hematologyanalyzersoffernewtechnologyand user-friendliness.LabMed.2000;31(3):146–50.
15.LantisKL,HarrisRJ,DavisG,RennerN,FinnWG.Elimination ofinstrument-drivenreflexmanualdifferentialleukocyte counts.Optimizationofmanualbloodsmearreviewcriteria inahigh-volumeautomatedhematologylaboratory.AmJ ClinPathol.2003;119(5):656–62.
16.BarnesPW,McFaddenSL,MachinSJ,SimsonE.The internationalconsensusgroupforhematologyreview: suggestedcriteriaforactionfollowingautomatedCBCand WBCdifferentialanalysis.LabHematol.2005;11(2):83–90.
17.PratumvinitB,WongkrajangP,ReesukumalK,KlinbuaC, NiamjoyP.Validationandoptimizationofcriteriaformanual smearreviewfollowingautomatedbloodcellanalysisina largeuniversityhospital.ArchPatholLabMed.
2013;137(3):408–14.
18.ComarSR,MalvezziM,PasquiniR.Establishmentand evaluationofreviewcriteriaofautomatedcompleteblood countsapplyingreceiveroperatingcharacteristics(ROC) curveanalysis.IntJLabHematol.2013;35(s1):44–5.
19.PetersonP,BlombergDJ,RabinovitchA,CornbleetPJ,AgostiSJ, AronsonM,etal.Physicianreviewoftheperipheralblood smear:whenandwhy.Anopinion.LabHematol. 2001;7(4):175–9.
20.ComarSR,MalvezziM,PasquiniR.Arethereviewcriteriafor automatedcompletebloodcountsoftheInternational SocietyofLaboratoryHematologysuitableforallhematology laboratories?RevBrasHematolHemoter.2014;36(3):219–25.
21.ComarSR,MalvezziM,PasquiniR.Tofollowornottofollow therecommendationsregardingmicroscopicanalysisofthe ClinicalandLaboratoryStandardsInstituteH20-A2to validatethecriteriaforbloodsmearreview?RevBras HematolHemoter.2015;37(1):69–70.
22.SilvaPH,AlvesHB,ComarSR,HennebergR,MerlinJC, StinghenST.Análisemorfológicadosangueperiféricoesua correlac¸ãocomohemograma.In:SilvaPH,AlvesHB,Comar SR,HennebergR,MerlinJC,StinghenST,editors.Hematologia laboratorial:teoriaeprocedimentos.PortoAlegre:Artmed; 2015.p.51–65.
23.NovisDA,WalshM,WilkinsonD,LorisMS,Ben-EzraJ. Laboratoryproductivityandtherateofmanualperipheral bloodsmearreview.ArchPatholLabMed.2006;130(5):596–601.
24.CuiW,WuW,WangX,WangG,HaoY,ChenY,etal. Developmentofthepersonalizedcriteriaformicroscopic reviewfollowingfourdifferentseriesofhematologyanalyzer inaChineselargescalehospital.ChinMedJ.
2010;123(22):3231–7.
26.YoudenWJ.Indexforratingdiagnostictests.Cancer. 1950;3(1):32–5.
27.ClinicalandLaboratoryStandardsInstitute(CLSI). Assessmentofthediagnosticaccuracyoflaboratorytests usingreceiveroperatingcharacteristiccurves:approved guideline.2nded.Wayne,PA:CLSIDocumentEP24-A2;2011.
28.HyunBH,GulatiGL,AshtonJK.Differentialleukocytecount: manualorautomated.Whatshoulditbe?YonseiMedJ. 1991;32(4):283–91.
29.WooHY,ShinSY,ParkH,KimYJ,KimHJ,LeeYK,etal. Currentstatusandproposalofaguidelineformanualslide reviewofautomatedcompletebloodcellcountandwhite bloodcelldifferential.KoreanJLabMed.2010;30(6):559–66.
30.CornetE,MullierF,DespasN,JacqminH,GearaC,BoubayaM, etal.Evaluationandoptimizationoftheextended
informationprocessunit(E-IPU)validationmodule integratingtheSysmexflagsystemsandthe recommendationsoftheFrench-speakingcellular hematologygroup(GFHC).ScandJClinLabInvestig. 2016;76(6):465–71.
31.FroomP,IsakovE,BarakM.Criteriaforreflexperipheralsmear reviewininfants.ScandJClinLabInvestig.2014;74(4):366–8.
32.TsengV,MorganAS,LeithCP,YangDT.Efficientassessment ofperipheralbloodlymphocytosisinadults:developingnew thresholdsforbloodsmearreviewbypathologists.ClinChem LabMed.2014;52(12):1763–70.
33.GallowayMJ,OsgerbyJC.Anauditoftheindicationsforthe reportingofbloodfilms:resultsfromtheNationalPathology BenchmarkingStudy.JClinPathol.2006;59(5):479–81.
34.KimSJ,KimY,ShinS,SongJ,ChoiJR.Comparisonstudyof theratesofmanualperipheralbloodsmearreviewfrom3 automatedhematologyanalyzers,UnicelDxH800,ADVIA 2120i,andXE2100,usinginternationalconsensusgroup guidelines.ArchPatholLabMed.2012;136(11):1408–13.
35.JonesRG,FaustA,GlazierJ,MatthewsR,PotterB.CELL-DYN® 4000:utilitywithinthecorelaboratorystructureand preliminarycomparisonofitsexpandeddifferentialwiththe 400-cellmanualdifferentialcount.LabHematol.1998;4: 34–44.