171 ORIGINAL ARTICLE EXERCISE AND SPORTS
MEDICINE CLINIC
ADAPTATION OF INVASIVE AND NON-INVASIVE
PROTOCOLS TO AEROBIC AND ANAEROBIC SPECIFIC
EVALUATION IN FEMALE BASKETBALL PLAYERS
ABSTRACT
Objective: The aim of the study was to adapt the critical velocity (CV), RAST test and lactate minimum (LM) to evaluation of female basketball players. Methods: Twelve well-trained female basketball players (19 ± 1yrs) were submitted to four running intensities (10 - 14 km/h) at shut-tle exercise until exhaustion, applied on alternate days. The linear model ‘velocity vs. 1/tlim’ was adopted to determine the aerobic (CV) and anaerobic (ARC) parameters. The lactate minimum test consisted of two phases: 1) hyperlactatemia induction using the RAST test and 2) incremental test composed of five shuttle run (20-m) at 7, 8, 9, 10, and 12 km/h. Blood samples were collected at the end of each stage. Results: The velocity (vLM) and blood lactate concentrations at LM were obtained by two polynomial adjustments: lactate vs. intensity (LM1) and lactate vs. time (LM2). One-way ANOVA, Student’s t-test and Pearson correlation were used for statistical analysis. The CV was obtained at 10.3 ± 0.2 km/h and the ARC estimated at 73.0 ± 3.4 m. The RAST was capable to induce hyperlactatemia and to determine the Pmax (3.6 ±0.2 W/kg), Pmean (2.8 ± 0.1 W/kg), Pmin
(2.3 ± 0.1 W/kg) and FI (30±3%). The vLM1 and vLM2 were obtained, respectively, at 9.47 ±0.13 km/h and 9.8 ±0.13 km/h, and CV was higher than vLM1. Conclusion: The results suggest that the non-invasive model can be used to determine the aerobic and anaerobic parameters. Fur-thermore, the LM test adapted to basketball using RAST and progressive phase was effective to evaluate female athletes considering the specificity of modality, with high success rates observed in polynomial adjustment ‘lactate vs. time’ (LM2).
Keywords: women, basketball, evaluation, lactate minimum, critical velocity.
Bruno Ferreira Camargo1
Gustavo Gomes de Araújo2
Claudio Alexandre Gobatto3
Nathália Arnosti Vieira1
Leonardo Henrique Dalcheco Messias1
Fúlvia de Barros Manchado-Gobatto3
1. Methodist University of Piracicaba – Unimep, Piracicaba São Paulo, Brazil. 2. Federal University of Alagoas UFAL, Maceió – Alagoas, Brazil. 3. State University of Campinas, Unicamp. Limeira, São Paulo, Brazil.
Mailing address:
Fúlvia de Barros Manchado-Gobatto Universidade Estadual de Campinas - Unicamp - Faculdade de Ciências Aplicadas - FCA - Caixa Posta 1068 CEP 13484-350, Limeira - SP - Brasil E-mail: [email protected]
INTRODUCTION
Basketball is a popular sports modality around the world1.
Due to the matches’ dynamism, modern basketball has become increasingly more intense, requiring greater dislocations with high velocity for middle and short distances, with or without the ball from the players2. During official basketball matches, the
athletes move about 7.5 km with different intensities (moderate, intense and severe domains) and different activities (walks, runs, jumps)3,being these characteristics directly connected to the
player’s position, physical status and tactical system adopted in defensive and offensive situations. It is still widely discussed in the literature which energetic system is mostly active during the match. Researchers believe that the actions in basketball are more dependent on the anaerobic power and resistance factors.1 Studies have shown that, during the match and at the
end of each period of the game, the anaerobic metabolism way significantly contributes to the energetic production in the inter-national level matches3,4. On the other hand, the aerobic
resis-tance is a significant factor for good performance of the actions during the game5. The activity of the aerobic metabolism during
the game may provide greater removal of blood lactate and probable tolerance in active moments of the match3, as well
as between the squares, resulting in better athletic responses during decisive tasks, such as dribbling, passing and shooting.
While investigating physiological variables such as blood lactate during basketball matches, mean values of peak lactate of ap-proximately 6.22 mM and decrease in performance at the end of the matches were found, suggesting the importance of aerobic metabolism on the recovery periods of basketball players for performance maintenance throughout the game6. Among the
methods able to evaluate the aerobic and anaerobic conditions of the athletes we highlight the non-invasive method of critical velocity, initially proposed for the critical power determination7
and the invasive protocol of lactate minimum, dependent of the hyperlactatemia induction (1st phase) and performance of a
progressive test (2nd phase) intensities8.In order to estimate the
anaerobic power of athletes, the Running Anaerobic Sprint Test
(RAST) has been widely applied9,10.The critical velocity, lactate
172 METHODS
Twelve well-trained basketball players (19 ± 1 years, 66.7 ± 10.1 kg, 1.71 ± 5.2 m, 19.2 ± 1.0% of fat), with minimum experience of five years in the modality training five to six weekly times in two shifts were evaluated. Inclusion criteria considered the athletes being members of the basketball teams selected for evaluation, necessarily participating in state championships (SP) in the period of the evaluations. After having received information about the procedures through which they would be submitted, as well as the risks and benefits of the evaluations, all participants signed a Free and Clarified Consent Form. The experimental procedure was approved by the Ethics Committee in Research of the Institution in which the study was developed (CEP-protocol # 50/10).
Place and time
All tests were performed in the training and competition pre-mises, with official measures for basketball matches.
Experimental protocols
All tests were performed in the training and competition con-ditions, with official measures for basketball matches.
The first protocol adapted and used in the study was the non-inva-sive model for determination of aerobic (CV) and anaerobic (ARC) para-meters, composed of four days of test at different intensities performed until voluntary exhaustion of the athletes. The second test used was the lactate minimum, performed in a single day, composed of two phases: hyperlactatemia induction (anaerobic phase), which was performed by the RAST and, in a second moment (separated by 8 minutes of passive recovery), a progressive test with blood collections from the earlobe after each stage, aim to obtain information about the aerobic parameter.
Evaluation of body composition
Weight (Filizola
), height (stadiometer), body mass index (weight/ height2) were determined and skinfolds were measured (chest,
axil-lary medial, tricipital, subscapular, abdominal, suprailiac and thigh) for determine the fat percentage (Jackson and Pollock, 1978).
Non-invasive model for determination of critical velocity (CV) and anaerobic running capacity (ARC)
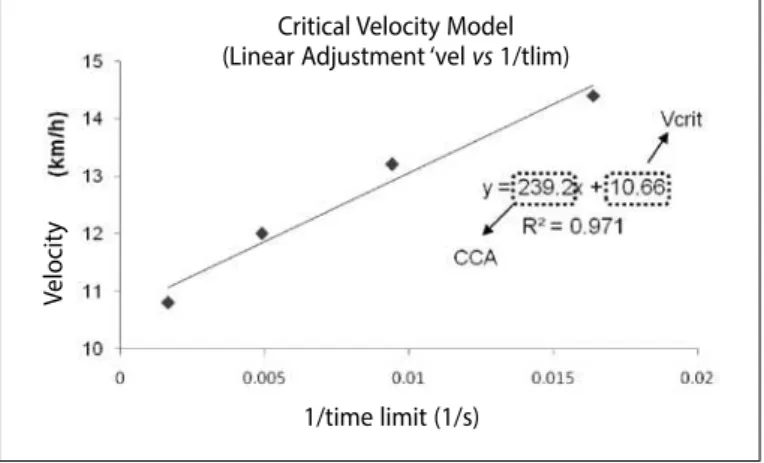
In order to determine the CV and ARC four predictive efforts were applied. The tests were randomly performed on alternated days. On each test the athletes ran in “shuttle” exercise (20m) until exhaustion. Intensity of each evaluation was controlled by a sound signal, and the athletes were asked to pass by previously set marks concomi-tantly to the signal. The intensities (10.8; 12.0; 13.0; and 14.5 km/h) were selected for exhaustion occur between 1 and 10 min and the time to exhaustion (tlim) for respective intensities were registered. The exhaustion criteria were non-maintenance of velocity set in two consecutive passages of 20 m or voluntary exhaustion. Determination of CV and ARC was performed by linear fit ‘velocity vs. 1/tlim’, in which the linear coefficient and angular coefficient corresponds to CV and ARC, respectively (values observed in the equation were divided by 3.6 for this parameter in meters) (Figure 1). The R2 values for the
in-dividual fits were used to verify the mathematical representativeness of the model to the physiological responses expected for the test.
Lactate minimum test
The lactate minimum test was performed in a single training session, being composed of two phases: hyperlactatemia induction and progressive test.
a. Hyperlactatemia induction phase: RAST adapted to baske-tball for anaerobic determination
In the hyperlactatemia induction phase the athletes performed six maximum sprints of 35 meters as it is required in the RAST original protocol, aimed determine the minimum (Pmin), median (Pmean) and
maximum power (Pmax), besides the fatigue index (FI). However, in the present study, the RAST was adapted to specificity of basketball. In this way, the 35 m were composed by two passages of 17.5 m in back and forth runs. Therefore, the athletes performed six subsequent shuttle runs (2 x 17.5 m), separated by passive interval of 10 s between them.
b. Progressive phase: Incremental test for lactate minimum determination
After the end of RAST, the participants remained on the court where they were kept in passive recovery during eight minutes for determination of peak concentration of blood lactate. For this, blood collections (25µL) from the earlobe were obtained at 3, 5 and 7 min of recovery.
At the end of the passive recovery, the second phase of the lactate minimum test was initiated. The progressive phase consisted of five stages (3 min each) with different velocities (between 7 and 12 km/h) over a 20m distance. The intensities were controlled by a sound signal. At the end of each stage, blood samples were also collected for the blood lactate determination.
Individual adjustments were generated and the lactate mini-mum values were obtained by polynomial function of second order (intensity and lactate concentration by two models):
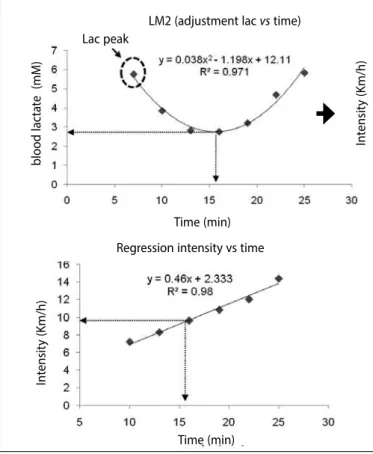
1- Relationship between ‘lactate vs. exercise intensity’, in which the derivate equal zero of the second order polynomial fit was the lactate minimum concentration (LM1, in mM) and the intensity corresponding to this point, to the lactate minimum velocity (vLM1, in km/h) (Figure 2a);
2- Relationship between ‘lactate vs. time’, considered, besides the blood lactate concentrations after the progressive exercise
in-Figure 1. Non-invasive model of critical velocity, performed by linear adjustment ‘velocity versus 1/limit time’, for determination of critical velocity (Vcrit) and anaerobic running capacity (CCA) for one participant in the sample.
Critical Velocity Model
(Linear Adjustment ‘vel vs 1/tlim)
V
elocit
y
173
tensities, the peak lactate value obtained with the hyperlactatemia induction. Thus, the lactate minimum concentration in the time was determined (LM2, in mM) and, after linear regression ‘intensity vs.
time’, the exercise intensity corresponding to the time that the LM occurred (vLM2, in km/h) was identified (Figure 2b).
In order to analyze the success of the lactate minimum test in the analyses using polynomial adjustments of second order of lactate vs. intensity (LM1) and lactate vs. time (LM2), the presence of four or more mathematical points were considered for the compo-sition of the polynomial adjustment curve in “U” shape, with the “a” of the equation presenting positive values and R2 higher than 0.80.
Blood collection and lactate analysis
During the invasive procedures, 25µL of blood were collected from the earlobe with the use of heparinized and calibrated ca-pillaries, and the samples were subsequently placed in Eppendorf
tubes containing 400µL of TCA 4%, for blocking of the reactions in the medium and blood deproteinization.
Statistical analysis
The results obtained were analyzed with the use of statistical packages STATISTICA version 7.0 and ORIGIN, version 7.0, according to the aims of the study.
Initially, normality (Shapiro Wilk) and homogeneity tests (Levene) were applied for identification of the data characteristics. Since they presented normality and homogeneity, parametric statistics metho-ds were adopted. One-way ANOVA followed by Newmann Keuls
post hoc, when necessary was applied, with the aim to compare the aerobic intensity values determined by non-invasive method (CV) and invasive models (LM1 and 2). Paired t-Student’s diagnosed the similarity or difference between the LM concentration observed by adjustments lactate vs. intensity and lactate versus time. The product-moment Pearson correlation was adopted to identify pos-sible correlations between the aerobic and anaerobic parameters identified by the two evaluation protocols specific to basketball. In all cases the significance level was pre-set in 5%.
RESULTS
Table 1 presents the results obtained by the non-invasive (critical velocity model) and invasive (lactate minimum) protocols. Besides the peak lactate (lac peak) results provided after the RAST perfor-mance, it was possible to identify after the six maximal shuttle runs of 35 meters (back and forth 2 x 17.5m) the values relativized for maximum, median and minimum powers and fatigue index of the athletes, expressed in Table 2.
When the aerobic parameters provided by non-invasive model and the invasive methods were analyzed, superiority of CV (8.7%) was ob-served in comparison with the lactate minimum velocity determined by ‘lactate vs. velocity’ fit (vLM1). On the other hand, when the ‘lactate
vs. time’ fit, which considers the peak lactate value in the analysis is adopted, the ANOVA did not showed significant differences between CV and LM2. In none of the lactate minimum fit significant correlations have been observed between CV and vLM (r = 0.23 and 0.01).
All non-invasive tests presented R2 values higher than 0.90, which
suggests good adjustments for this model. Concerning the success observed in the invasive protocol analyzed by two mathematical ad-justments, both presented the same percentage (83.3% of the cases).
One of the aims of the RAST adapted to basketball was the evaluation of anaerobic power (Table 3), also connected with the lactate minimum test, the RAST was used as a hyperlactatemia in-ducer. After the application of this protocol, the athletes presented increase of the blood lactate concentrations from minutes 1 and 3 of recovery, being the mode of peak lactate onset at the minute 7, with mean concentration of 5.91 ± 0.28 mM.
The correlations among all the aerobic and anaerobic parame-ters obtained by different procedures are presented in Table 4.
Figure 2a. Polynomial adjustment ‘lactate versus ‘exercise intensity’, zero derivate of the adjustment equals to the minimal lactate concentration (LM1, in mM), the intensity corresponding to this point, to the minimal lactate velocity (vLM1, in km/h), for one participant of the sample.
vs
LM1 (adjustment vs intensity)
blood lac
ta
te (mM)
Velocity (Km/h)
Figure 2b. Example of the polynomial adjustment ‘lactate versus time’, for one of the participants, considering, besides the lactacidemic concentrations after the progressive exercise intensities, the lactate peak value obtained with hyperlactacidemia induction. Thus, the minimal lactate concentration in time was determined (LM2, in mM) and after linear regression “intensity”.
vs
blood lac
ta
te (mM)
Lac peak
In
tensit
y (K
m/h)
In
tensit
y (K
m/h)
Time (min)
Time (min)
LM2 (adjustment lac vs time)
174
Table 1. Mean ± SEM values obtained by non-invasive and invasive protocol. The non-invasive parameters are represented by Vcrit, CCA and R2. Invasive procedure
determined vLM1, vLM2,LM1, LM2 R2.
Protocols
Non-invasive Invasive
Critical velocity model Lactate vs Intensity adjustment
Lactate vs time adjustment
Vcrit (km/h)
CCA
(m) R
2 vLM1
(km/h) LM1
(mM) R
2 vLM2
(km/h) LM2
(mM R
2
10.30 ± 0.17
73.0 ± 3.4
0.94 ± 0.01
9.47* ± 0.13
3.14 ± 0.29
0.91 ± 0.02
9.80 ± 0.13
3.20 ± 0.33
0.85 ± 0.03
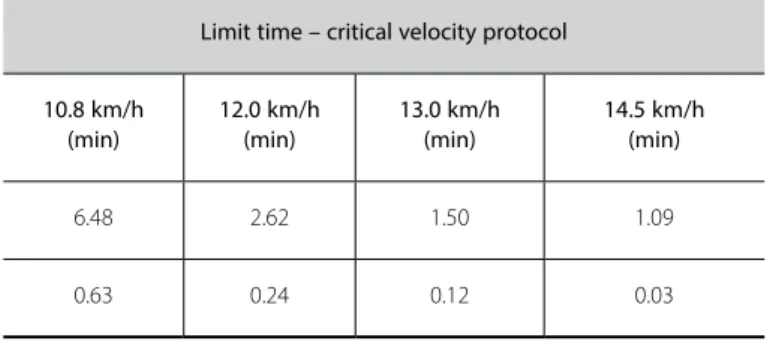
Table 2. Mean ± SEM values of the limit times, in minutes, respective to the velocities (km/h) applied in the critical velocity protocol.
Limit time – critical velocity protocol
10.8 km/h (min)
12.0 km/h (min)
13.0 km/h (min)
14.5 km/h (min)
6.48 2.62 1.50 1.09
0.63 0.24 0.12 0.03
Table 3. Mean ± sem values obtained by RAST, absolute (W) and relative values to body weight (W/kg). The non-invasive protocol determined the anaerobic powers Pmax,Pmed, Pmin and IF.
Non-invasive protocol
Pmax (w)
Pmax (w/kg)
Pmed (w)
Pmed (w/kg)
Pmin (w)
Pmin (w/kg)
IF (w/kg)
222.38 ± 13.31
3.35 ± 0.15
158.81 ± 9.22
2.79 ± 0.09
2.79 ± 8.51
154.80 ± 0.09
2.33 ± 2.91
Table 4. Correlation between the lactacidemic variables (lactate peak – Lac peak and minimal lactate concentration by two different adjustments – LM1 and LM2) and minimal anaerobic (Pmin), mean (Pmed) and maximal power (Pmax).
Lac
peak LM 1 LM 2 Pmin Pmed Pmax
Lac
peak - 0.78* 0.76* 0.64 0.58 0.29
LM1 0.78* - 0.97* 0.73* 0.63 0.40
LM2 0.76* 0.97* - 0.75* 0.77* 0.66*
PMIN 0.64 0.73* 0.75* - 0.88* 0.55
Pmed 0.58 0.63 0.77* 0.88* - 0.84*
Pmax 0.29 0.40 0.66* 0.55 0.84*
-*Significan
DISCUSSION
The determination of parameters able to predict physical per-formance in sports modalities, including basketball, is significant for sports success. Therefore, the present study had the aim to adapt and analyze different methods for determination of aerobic and anaerobic parameters in women’s basketball.
The choice of models of CV and LM for the evaluation of wo-men basketball players was based on some criteria. Concerning the non-invasive model ‘velocity vs. 1/tlim’, highly cost equipment and a team with experience in collecting biological material are not ne-cessary, which possibility the application of protocol in sports envi-ronment, added to the fact the high correlation observed between the CV and LM, identified by many methods, is well-established in the literature11,12. The model is also able to identify an anaerobic
pa-rameter (ARC), which is still material for investigation since in some cases it does not present significant correlation with other anaerobic indices13. Conversely, the option for the invasive method of lactate
minimum found support on the strength of the test for detection of the physiological phenomenon of “anaerobic threshold”8,14,being
performed in a single training session.
The results of aerobic parameters expressed in Table 1 suggest the possibility of use the CV and lactate minimum for women’s baske-tball, on the determination of aerobic and anaerobic parameters. As in other studies15,16, the CV significantly overestimated the
anaerobic threshold in approximately 8.7%, when it was determi-ned by the conventional protocol of lactate minimum (‘lactate
vs. intensity’ fit). However, when the ‘lactate vs. time’ fit was used, considering in the analysis the peak lactate value in the determi-nation, this distinction between CV and vLM2 was lower (4.85%) and insignificant. In the two mathematical adjustments adopted, significant correlations between CV and vLM (r = 0.23 and 0.01) were not identified. The success percentage of the evaluations of lactate minimum was of 83.7%, while for the unsuccessful cases in both adjustments, this value occurred due to the R2 values which,
despite being close, (higher than 0.76), were lower than 0.80. In this sense, further studies related the CV results to the pa-rameters provided by the LM protocol, specifically in running, ob-serving correlation between CV and LM, but significant difference between the parameters in middle-distance runners17 and
sprin-ters18. Both studies suggested that the CV currently considers an
aerobic transition index between the intensity domains intense and severe19, overestimates not only the anaerobic threshold classically
determined, but also the vLM. On the other hand, the CV seems to be an interesting instrument for follow-up of the vLM evolution during training, when there is correlation between the parameters, a fact which did not occur in the present investigation.
The lactate minimum test proposed in the present study used RAST9,10, being this method adapted to the basketball specific needs
(reduced space and change of direction) to generate the necessary hyperlactatemia to the method. This test, in its original version, has been used when the aim is to determine the anaerobic power in sports which use running as the main motor gesture20,21.
175
expressed in Table 2, presented values lower than the ones poin-ted by Araujo et al20 analyzing men’s basketball. However, in this
case, the authors used the conventional RAST method (six stimuli of 35 m, with 10-second intervals between the sprints. These lower values obtained in the present study may be related to the gen-der different characteristics, especially since the power expresses direct correlation with the strength levels, and also due to the test characteristic, since in the present investigation there was RAST adaptation to the spatial needs, making the task demanded and the ones performed in the basketball game closer. In that case, the adapted RAST consisted of six sprints of two shuttle runs in 17.5 m, totalizing the same 35 m, but preserving the modality specific feature in the evaluation.
The adapted RAST increased the blood lactate of the female basketball players to 5.91 ± 0.28 mM, a value which can be consi-dered viable for performance of the test and subsequent determi-nation of LM. Despite being appropriate, the values found for peak lactate in the present study were lower than the ones obtained by other groups10,14,18,22. The literature is still controversial concerning
the relation between peak lactate concentration and the results of the lactate minimum test22,23. In the present study, the LM
concen-trations in the two adjustments adopted were low (LM1 = 3.14 ± 0.29 mM and LM2 = 3.20 ± 0.33 mM) and significantly correlated with the lactate peak concentration (r = 0.78 and 0.76, respectively), suggesting that the lac peak value may generate different LM con-centrations, but not distinct intensities (vLMs). On the other hand, other studies observed differences not only of the lactate minim concentration, but also of vLM when adopted diverse protocols14,24.
Other interesting correlations have also been observed in the present study (Table 3), especially between anaerobic po-wers generated by the RAST adapted to basketball. It should be also mentioned that there is no significant correlation between
anaerobic capacity estimated by the non-invasive model (ARC) and the remaining anaerobic parameters obtained by the RAST and by lactatemia. These findings corroborate the results of other investigations which also obtained significant correlations between the anaerobic capacity determined by the critical po-wer model or its variables with anaerobic popo-wer 13,18.
CONCLUSION
The results of the present study suggest the possibility of deter-mination of aerobic and anaerobic parameters by invasive and non--invasive tests applied to female basketball players. The nonnon--invasive specific model may be used to determine aerobic and anaerobic parameters. However, as occurs in other sports modalities, the CV overestimates the LM intensity traditionally determined. Moreover, we highlight the two methods should not be interchangeably used due to the absence of significant correlations among CV, LM1 and LM2. Concerning the adoption of lactate minimum test protocol with hyperlactacidemic induction by RAST adapted to basketball, the ‘lactate vs. time’ fit, which considers the peak lactate in the LM analysis (intensity and concentration) seems to be more appro-priate, since this model presents high percentage of success and also minimizes the differences between results observed by critical velocity test.Figure 2b. Example of the second order polynomial fit ‘lactate versus time’, for one of the athletes, considering, besides the blood lactate concentrations after the progressive exercise intensities, the lactate peak value obtained with hyperlactatemia induction. Thus, the lactate minimum concentration in time was determined (LM2, in mM) and after linear regression determined the intensity of LM.
All authors have declared there is no potential conlict of interests concerning this article.
REFERENCES
1. Hoffmam JR, Maresh CM. Physiology of basketball. In: Garrett WE Jr, Kirkendall DT, editors. Exercise and sport science. Philadelphia, PA: Lippincott Williams & Wilkins, 2000;733-44.
2. Lamas L.Especificidade do treinamento no basquetebol: fatores energéticos e neuromusculares. Rev
Mackenzie de Educação Física e Esporte 2006;5:93-106.
3. Abdelkrim N, El Fazaa S, El Ati J. Time-motion analysis and physiological data of elite under-19-year-old basketball players during competition. Br J Sports Med 2007;41:69-75.
4. Rodriguez-Alonso M, Fernandez-Garcia B, Perez-Landaluce J, Terrados N. Blood lactate and heart rate during national and international women’s basketball. J Sports Med Phys Fitness 2003;43:432-6.
5. Laplaud D, Hug F, Menier R. Training-induced changes in aerobic aptitudes of professional basketball players. Int J Sports Med 2004;25:103-8.
6. Ben Abdelkrim N, Castagna C, Jabri I, Battikh T, El Fazaa S, El Ati J. Activity profile and physiological requirements of junior elite basketball players in relation to aerobic-anaerobic fitness. J Strength Cond Res 2010;24:2330-42. 7. Monod H, Scherrer J. The work capacity of a synergic muscular group. Ergonomics 1965;8:329-38.
8. Tegtbur U, Busse MW, Braumann KM. Estimation of an individual equilibrium between lactate production and catabolism during exercise. Med Sci Sports Exerc 1993;25:620-7.
9. zacharogiannis E, Peradisis G, Tziortzis S. An evaluation of tests of anaerobic power and capacity. Med Sci Sports Exerc 2004;36:116-23.
10. zagatto AM, Beck WR, Gobatto CA. Validity of the running anaerobic sprint test for assessing anaerobic power and predicting short-distance performances J Strenght Cond Res 2009;23:1820-7.
11. Wakayoshi K, Ilkuta K, Yoshida T, Udo M, Harada T, Moritanii T, et al. Determination and validity of critical velocity as na index of swimming performance in the competitive swimmer. Eur J Appl Physiol 1992;64:153-7.
12. Almeida PAS, Ferreira GR, Morais DC, Barbosa ES, Cardoso AT, Rocha CCD, et al. Comportamento dos parâmetros de controle de treinamento aeróbio durante testes de campo. Fitness Perfor J 2008;7:406-12.
13. Papoti M, zagatto AM, Mendes OC, Gobatto CA. Utilização de métodos invasivo e não invasivo na predição das performances aeróbia e anaeróbia em nadadores de nível nacional. Rev Port Cien Desp 2005;5:7-14.
14. Ribeiro LFP, Gonçalves CGS, Kater DP, Lima MCS, Gobatto CA. Influence of recovery manipulation after hyper-lactemia induction on the lactate minimum intensity. Eur J Appl Physiol 2009;2:159-65.
15. Pringle JSM, Jones AM. Maximal lactate steady state, critical power and EMG during cycling. Eur J Appl Physiol 2002;88:214-26.
16. Housh DJ, Housh TJ, Bauge SMA. A methodological consideration for determination of critical power and anaerobic work capacity. Res Q Exerc Sport 1990;61:406-9.
17. Simões HG, Denadai BS, Baldissera V, Hill DW, Campbell CSG. Relationship and significance of lactate mini-mum, critical velocity, heart rate deflection and 3000 m track-tests for running. J Sports Med Phys Fitness 2005;45:441-51.
18. Andrade VC. Métodos de velocidade crítca, lactato mínimo e RAST na determinação de parâmetros aeróbios e anaeróbios de corredores: análises transversais e longitudinais [dissertação de mestrado]. Piracicaba: Universidade Metodista de Piracicaba – UNIMEP, 2011.
19. Jones AM, Vanhatalo A, Burnley M, Morton RH, Poole DC. Critical power: implications for determination of VO2max and exercise tolerance. Med Sci Sports Exerc 2010;42:1876-1890.
20. Araújo GG, Papoti M, Manchado FB, Silva ASR, Santhiago V, Gobatto CA. Running anaerobic sprint test as hyperlactatemia inductor in lactate minimum test: Comparison between basketball teams. Med Sci Sports Med (Supp) 2008; 40: S421.
21. Roseguini Az, Silva ASR, Gobatto CA. Determinações e relações dos parâmetros anaeróbios do RAST, do limiar anaeróbio e da resposta lactacidemica obtida no início, no intervalo e ao final de uma partida oficial de
handebol.Rev Bras Med Esporte 2008;14:46-50.
22. Santhiago V, Silva ASR, Guglielmo LA, Higino WP. Influência da forma de indução à acidose na determinação da intensidade de lactato mínimo em corredores de longa distância. Rev Bras Med Esporte 2008;14:393-8. 23. Padorno E, Simões HG, Campbell CSG. Effects of methodological variations on lactate minimum identification.
Rev Bras Educ Fís Esp 2005;19:25-33.